10210 Collins Ave #306 · Bal Harbour, FL
Flood risk 9/10 · Severe
- FEMA flood zone
- AE
- Chance of flooding over 30 yrs
- 0.99%
- Est. flood insurance / yr
- $1,737 – $8,500
Fire risk 1/10 · Minimal
- Est. fire insurance / yr
- $947 – $1,759
Heat risk 10/10 · Severe
- Hot days now (above 103°F)
- 7 days/yr
- Hot days in 30 yrs
- 28 days/yr
Wind risk 10/10 · Severe
- Chance of severe wind over 30 yrs
- 99.0%
Air-quality risk 2/10 · Minimal
- Unhealthy air days now
- 1 days/yr
- Unhealthy air days in 30 yrs
- 2 days/yr
Risk factors via First Street. Map © Google.
Why this score? — see what drove the C+ grade
The composite is a weighted blend of 9 inputs, each scored 0–100. Each bar is that input's sub-score; the figure is the points it added to the 100-point composite (weight × sub-score).
- Cash flow +21.4/30.0
- Appreciation +8.1/10.0
- ARV discount +7.5/15.0
- DSCR +6.8/10.0
- 1% rule +6.5/10.0
- Schools +4.2/10.0
- Livability +3.8/5.0
- Condition / age +2.5/5.0
- Rent growth +2.2/5.0
$420,000
🖨 Deal sheet 📄 Offer letter ✓ Due diligence
Listing remarks
Looking for the perfect beach home at a phenomenal price? Then you've found it! Located in prestigious Bal Harbour directly across the street from the beach, this bright and spacious 986/SF residence is located on the top with southern exposure that sheds lots of natural light. Secured boutique building with quaint courtyard. Unit features stainless steel appliances, full size washer/dryer, closet built-ins with an enclosed, oversized balcony. Bathroom and kitchen are completely renovated Laminate wood floors throughout. 1 assigned parking space. Great location within walking distance to Bal Harbour Shops, restaurants and park. Includes beach access.
Key facts
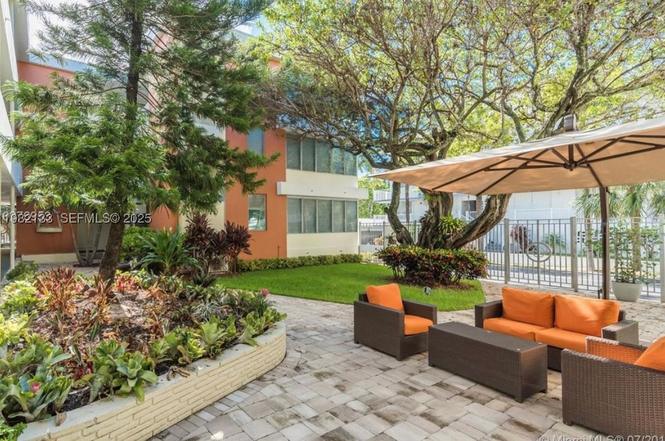
- Quaint courtyard
- Beach access
- Closet built ins
Tags
Property features AI
Finance
- Financial info: Lease considered; Pets not allowed
- HOA & community: Quarterly association fee; Association fee includes trash; Community amenities: elevator(s), barbecue, picnic area, trash service
Exterior
- Parking: Has carport (1 space); Electric vehicle charging station; One covered space
- Security: Complex fenced; Phone entry
- Utilities: Central heating and cooling
- Home design: 3 stories; Entry on third floor; Effective year built
- Exterior features: Balcony; Courtyard; Enclosed porch; Porch; Wrap-around screened porch
Interior
- Flooring: Hardwood; Wood
- Bathrooms: 1 full bathroom
- Heating & cooling: Central heating; Central air conditioning; Ceiling fans
- Interior features: Third floor entry; Balcony; Enclosed porch; Porch; Courtyard; Wrap-around porch; Screened porch
- Laundry & utility: Washer; Dryer
Neighborhood map
What this means for you Summary
Snapshot
- This is a 1-bed/1.0-bath condo listed at $420k.
Deal economics
- At list price, monthly cash flow is $196 ($2k/yr) — positive.
- The deal already cash-flows at list — no discount required.
- Meets the 1% rule at list price ($5k rent vs $420k).
- Recommended offer: $370k (12.0% below list) — sets the bar for market timing.
Location & tenants
- Location reads 76/100 on livability (#217 in FL, #3,392 nationally) — a middle-class / working-renter tenant base. Strengths: crime A+, health & safety A+, employment A; Watch: schools C-, amenities F, cost of living F.
- Miami-Dade (suburban): math 45% / reading 54% proficiency, ranked #40 of 73 in FL (top 55%) — families likely to look elsewhere, expect single-tenant / working-renter base with shorter leases; 64% free/reduced lunch — lower-income household profile, screen leases tightly.
- Market conditions: Rents soft (-1.3%/yr); 522 active listings in the ZIP; solid renter incomes; 10,051 units permitted in Miami-Dade County in 2024 (7,758 in 5+ unit buildings).
- At $4,848/mo this rent would consume 65% of the median local household income ($90k/yr) (locally 774% of renters already pay >50% of income on rent) — very limited rent-growth headroom before tenants either downsize or default.
Forward outlook
- In year one you build about $29k of equity ($3k loan paydown + $26k appreciation (6.1% local appreciation)).
- Miami-Dade County population projected at +28% by 2050 — long-run rental-demand tailwind backs the buy-and-hold thesis.
- At projected returns (6.1% appreciation + 0.0% rent growth), your $118k cash investment doubles in ~4 years — after that, you're playing with house money.
- By year 2, paydown + projected appreciation supports a ~$46k cash-out refi (75% LTV) — recoverable capital for the next deal without selling this one.
Negotiation context
- It's been on market 169 days — a 12% lower offer ($370k) is reasonable based on typical stale-listing flexibility.
- 18 sale attempts since 10y ago; this cycle's ask is 13900% above the opening price — seller raised mid-cycle; expect resistance to lowballs.
- Current owner paid $220k; list at $420k implies a 91% gain — meaningful room to come down on a strong offer.
Risks & watch-outs
- Watch-outs: flood insurance adds $427/mo; built in 1952 — expect roof / HVAC / electrical / plumbing capex.
- Climate carrying-cost: in FEMA flood zone AE (mandatory federal flood insurance); severe wind risk, 99% chance of damaging wind over 30y; extreme-heat days projected 7→28/yr by 2055 (HVAC capex compounding) — expect insurance premiums to compound above CPI over the hold.
Questions for the listing agent
- It's been on market 169 days. Have you received any prior offers? Is the seller open to a 12% concession, seller financing, or rate buy-down credit?
- Built in 1952 — when were the roof, HVAC, electrical panel, plumbing, and water heater last replaced?
- What's the actual annual flood-insurance premium (NFIP or private), and is the property in a SFHA with mandatory coverage?
- What does the HOA fee cover, when was the last increase, and are there any pending special assessments or reserve-fund shortfalls?
- Any open or pending special assessments — roof, HVAC, plumbing, elevator, façade? What's the per-unit balance and payoff schedule, and is the seller paying it off at close or rolling it to the buyer?
- Why hasn't it sold? Are there any deal-killer items the seller is aware of (foundation, flood, title, zoning, code violations)?
- Is there a deadline driving the sale (1031 exchange, divorce, estate, relocation)? That informs how much negotiation room exists.
- What's the average days-on-market for RENTAL listings here right now (not sales)? A rising rental-DOM trend means longer vacancies and softer asking-rent achievability than the comps imply.
- What's the recent tenant-quality profile in this submarket — average credit score on applications, eviction rate, late-payment / NSF rate, and stable-employment percentage? A property-management company in the area should have these aggregated.
- How much new apartment / multifamily construction is in the pipeline within 1–3 miles? Heavy new supply (>2% of stock underway) typically softens rents 12–24 months out; light construction supports rent growth.
Investment metrics
- 1% rule
- 1.15% ✓
- Cap rate
- 8.07%
- Cash-on-cash
- 6.36%
- DSCR
- 1.28
- GRM
- 7.2
CMA / ARV
No comps found within radius.
Projected returns pro-forma
6.12% appreciation · 0.0% rent growth · sell at horizon
- IRR
- 15.8%
- Equity multiple
- 2.05×
- Total profit
- $123,184
- Equity at exit
- $267,329
- IRR
- 14.6%
- Equity multiple
- 3.78×
- Total profit
- $327,292
- Equity at exit
- $487,662
Cash invested: $117,600 (down + closing). Projections, not guarantees.
Landlord ↔ Tenant lean methodology
- Overall (STATE)
- 87 Strongly Landlord-Friendly
- State Florida
- 87 Strongly Landlord-Friendly · R+3
- County
- — inherits STATE
- City
- — inherits STATE
ZIP-level market 33154
- Home prices YoY
- 1.4%
- Rents YoY
- -1.3%
- Active inventory
- 522
- Price-to-rent
- 7.2×
Monthly cashflow live
- Estimated rent
- $4,848 medium interval (Pro) →
- Mortgage (P&I)
- −$2,203
- Tax from tax record
- −$418 /mo · $5,019/yr
- Insurance
- −$175
- Flood insurance flood zone
- −$427 /mo · $5,118/yr
- HOA
- −$411
- Vacancy / Maint / Mgmt
- −$1,018
- Net cashflow
- $196
Break-even live
UW: 25.0% down · 7.5% · 30yr · 1.5% tax · 5.0% vac · 8.0% maint · 8.0% mgmt
Financing live
Cash to close
- Down payment
- $105,000
- Closing costs
- $12,600
- Reserves months
- —
- Total cash needed
- —
Loan-product check · same deal, 3 products live
Conventional
25% down · 7.5% · 30yr
- Down + closing
- —
- Monthly P&I
- —
- Monthly cashflow
- —
- DSCR
- —
- Eligible?
- —
Personal DTI + credit; lowest rate.
DSCR
20% down · 8.5% · 30yr
- Down + closing
- —
- Monthly P&I
- —
- Monthly cashflow
- —
- DSCR
- —
- Eligible?
- —
No personal income docs; deal must DSCR.
Hard money
10% down · 12.0% · 12mo
- Down + closing
- —
- Monthly P&I
- —
- Monthly cashflow
- —
- DSCR
- —
- Eligible?
- —
Short-term bridge; refi at stabilization.
HOA detail condo
- Monthly dues
- $411 · $4,932/yr
- Likely covers
- parking
- Assessments
- None detected in remarks — confirm with the listing agent.
Listing history 50 events
-
2026-06-18status $420,000 Pending 169 DOM
-
2026-06-17days on market $420,000 Active 169 DOM
-
2026-06-16days on market $420,000 Active 168 DOM
-
2026-06-15days on market $420,000 Active 167 DOM
-
2026-06-13days on market $420,000 Active 165 DOM
-
2026-06-09days on market $420,000 Active 161 DOM
-
2026-06-08days on market $420,000 Active 160 DOM
-
2026-06-07days on market $420,000 Active 159 DOM
-
2026-06-04days on market $420,000 Active 156 DOM
-
2026-06-03days on market $420,000 Active 155 DOM
-
2026-06-02days on market $420,000 Active 154 DOM
-
2026-06-01days on market $420,000 Active 153 DOM
-
2026-05-31days on market $420,000 Active 152 DOM
-
2026-02-20$3,000
-
2025-12-06historical
-
2025-12-04$420,000 Active
-
2025-12-01price $420,000
-
2025-06-25status Active
-
2025-02-07historical Active Under Contract
-
2024-12-06$455,000 Active
-
2024-03-20status Active
-
2024-02-29status Active
-
2024-01-31status Active
-
2023-12-31status Active
-
2023-12-09status Active
-
2023-12-05historical $2,850
-
2023-12-04historical Active Under Contract
-
2023-11-26$445,000 Active
-
2023-11-19historical
-
2023-11-19status Active
-
2023-11-18$2,850
-
2023-11-18$2,850 Active
-
2023-06-13$3,200 Active
-
2019-01-04soldstatus $220,000
-
2018-12-27soldstatus $220,000 Sold
-
2018-09-21status Pending
-
2018-09-03price $229,999
-
2018-04-19status Active
-
2017-11-02historical
-
2017-10-19price $239,000
-
2017-08-26price $249,000
-
2017-06-24price $259,000
-
2017-05-14$269,000 Active
-
2017-05-08historical
-
2017-01-11$289,000 Active
-
2017-01-02historical
-
2016-12-19price $292,000
-
2016-10-12$299,000 Active
-
2007-11-14soldstatus $170,000
-
1985-10-01soldstatus $60,000
ⓘ Source: listings_history table (triggers on properties + properties_extension) + one-shot
backfill from property_details.listing_events for pre-trigger history.
Tax reassessment forecast FL · Resets to sale price
- Current annual tax
- $5,019 · $418/mo
- Projected year-2 tax
- $5,019 · $418/mo
- Expected delta
- $0/yr ($0/mo · 0.0%)
ⓘ Screening estimate from a state-policy table — verify with the county assessor before closing.
Climate risk First Street
- Flood 9/10 Extreme FEMA zone AE · 99% chance over 30 yrs
- Wildfire 1/10 Low
- Heat 10/10 Extreme 7 d/yr ≥103°F today · 28 d/yr by 30 yrs out
- Wind 10/10 Extreme 99% chance of damaging wind over 30 yrs
- Air quality 2/10 Low 1 unhealthy d/yr today · 2 by 30 yrs out
Nearby sold comps map
Loading sold comps map…
Walkable amenities ~0.75 mi
Loading nearby amenities…
Taxation est. · year 1
- Rental income
- $58,172
- − Mortgage interest
- −$23,527
- − Property taxes
- −$5,019
- − Insurance
- −$7,219
- − Repairs & maintenance
- −$4,654
- − Management
- −$4,654
- − HOA
- −$4,932
- − Depreciation
- −$12,218
- Taxable loss
- −$4,050
- Est. tax savings @ 24.0%
- +$972
- After-tax cash flow
- $3,328/yr
For passive investors: Depreciation is non-cash, so a rental often shows a tax loss while cash-flowing — sheltering income. Rental losses are passive: they offset passive income freely, and up to $25,000/yr can offset ordinary (W-2) income if you actively participate and your MAGI is under $100k (phasing out to $0 by $150k); unused losses carry forward. On sale, claimed depreciation is recaptured at up to 25%, and gains may owe capital-gains tax (a 1031 exchange can defer both). Figures are a year-1 estimate at your 24.0% rate — not tax advice; consult a CPA.
Schools (NCES district)
- District
- Miami-Dade
- NCES district ID
- 1200390
- Math proficiency
- 45% ▼ -16.00%
- Reading proficiency
- 54% ▼ -5.00%
- Median HH income
- $43,928
- Composite
- 41.76/100
- National rank
- #3397
- State rank
- #40 of 73 in FL
Livability — Bal Harbour
- Score
- 76/100
- State rank
- #217
- US rank
- #3392
Category grades
Schools grade is shown separately in the Schools card above.
Census & demographics
- Census place
- Bal Harbour, FL
- County
- Miami-Dade County · 2,697,751 people
- City population
- 14,572
- Metro
- Miami-Fort Lauderdale-Pompano Beach, FL
- Population (ZIP)
- 14,572
- Household income
- $89,563
- Rent vs Own
- Severe rent burden
- 774.0
Population outlook (Miami-Dade County) Hauer SSP2
- Today (2025)
- 3,126,439 people
- By 2030
- 3,325,765 · +6.4%
- By 2040
- 3,697,561 · +18.3%
- By 2050
- 4,012,134 · +28.3%
- By 2075
- 4,605,612 · +47.3%
- By 2100
- 4,866,598 · +55.7%
Race, ethnicity, and origin ACS 2023
- Neighborhood character
- Majority White (53%)
- Race & ethnicity
- White 53% Hispanic / Latino 41% Two or more races 25% Black 2%
- Hispanic origin (detail)
- Puerto Rican 2% Cuban 12% Salvadoran 2%
- Common ancestry
- Scotch-Irish 7% Romanian 5% Lithuanian 4%
- Foreign-born
- 46% · Canada, Jamaica, Dominican Republic
- Languages at home
- 36% English-only · Spanish 41% French/Haitian/Cajun 7% Other Indo-European 5%
Political lean MEDSL · Miami-Dade
- 2024 margin
- R (+11.4) · D 43.9% · R 55.4%
- 2008→2024 swing
- -27.6pp toward R · 2008: 16.1pp · 2024: -11.4pp
- All cycles
- 2024: R+11.4 2020: D+7.3 2016: D+29.6 2012: D+23.7 2008: D+16.1
Not yet ingested
- Civics
- —
Market trends
- HPI YoY
- ▲ 6.12%
- Current HPI
- 454.1747
- Rent YoY
- ▼ -1.30%
- Metro
- Miami-Fort Lauderdale-Pompano Beach, FL
- State GDP YoY
- ▲ 3.28%
- F500 in state
- 36
Industry mix (Fortune 500 HQ in FL)
| Industry | F500 HQs | Revenue |
|---|---|---|
| Industrial Technology | 2 | $29B |
|
||
| Insurance | 2 | $17B |
|
||
| Retail | 1 | $60B |
|
||
| Technology Distribution | 1 | $58B |
|
||
| Homebuilding | 1 | $35B |
|
||
| Technology Manufacturing | 1 | $35B |
|
||
Price history
-95.0% since first listed37 events — show timeline
- 2026-02-20 Listed for Rent $3,000 MARMLS
- 2025-12-06 Listing Removed — MARMLS
- 2025-12-04 Listed $420,000 MARMLS
- 2025-12-01 Price Changed $420,000 MARMLS
- 2025-06-25 Relisted — MARMLS
- 2025-02-07 Contingent — MARMLS
- 2024-12-06 Listed $455,000 MARMLS
- 2024-03-20 Relisted — MARMLS
- 2024-02-29 Relisted — MARMLS
- 2024-01-31 Relisted — MARMLS
- 2023-12-31 Relisted — MARMLS
- 2023-12-09 Relisted — MARMLS
- 2023-12-05 Rental Removed $2,850 MARMLS
- 2023-12-04 Contingent — MARMLS
- 2023-11-26 Listed $445,000 MARMLS
- 2023-11-19 Listing Removed — MARMLS
- 2023-11-19 Relisted — MARMLS
- 2023-11-18 Listed for Rent $2,850 MARMLS
- 2023-11-18 Listed $2,850 MARMLS
- 2023-06-13 Listed $3,200 MARMLS
- 2019-01-04 Sold (Public Records) $220,000 Public Records
- 2018-12-27 Sold (MLS) $220,000 MARMLS
- 2018-09-21 Pending — MARMLS
- 2018-09-03 Price Changed $229,999 MARMLS
- 2018-04-19 Relisted — MARMLS
- 2017-11-02 Listing Removed — MARMLS
- 2017-10-19 Price Changed $239,000 MARMLS
- 2017-08-26 Price Changed $249,000 MARMLS
- 2017-06-24 Price Changed $259,000 MARMLS
- 2017-05-14 Listed $269,000 MARMLS
- 2017-05-08 Listing Removed — MARMLS
- 2017-01-11 Listed $289,000 MARMLS
- 2017-01-02 Listing Removed — MARMLS
- 2016-12-19 Price Changed $292,000 MARMLS
- 2016-10-12 Listed $299,000 MARMLS
- 2007-11-14 Sold (Public Records) $170,000 Public Records
- 1985-10-01 Sold (Public Records) $60,000 Public Records
Property tax history
+5.8%/yrLatest (2025): $5,019 · +5.7% YoY. Source: county tax records.
Cash-flow waterfall
monthlySold comps — $/sqft
last 12 mo · ≤1 miLoading sold comps…