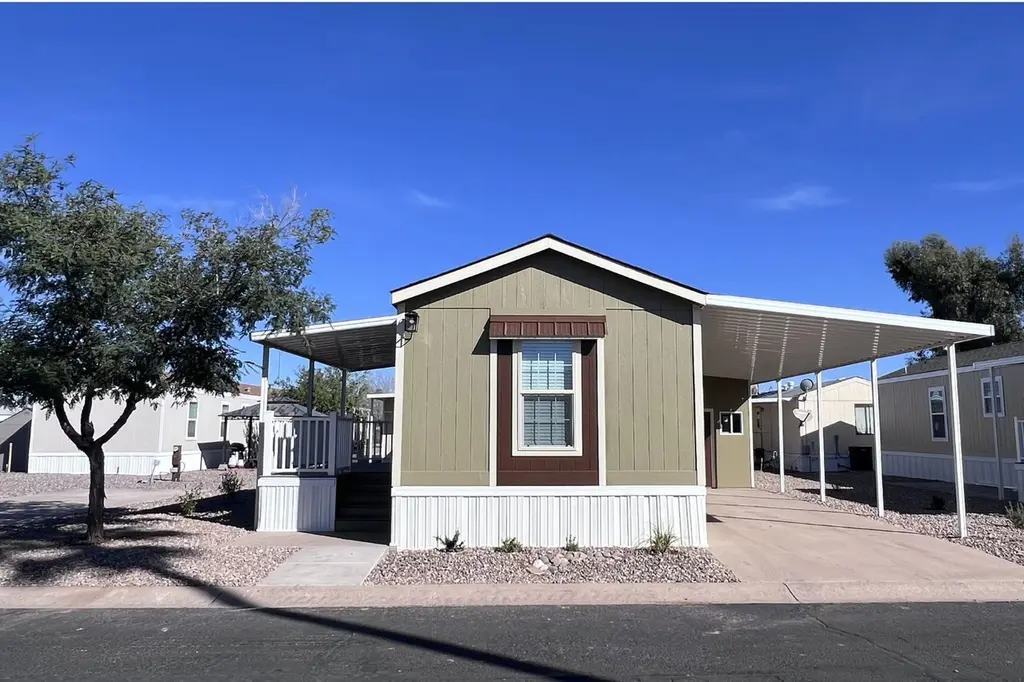
426 W Cottonwood Ln #51 · Casa Grande, AZ
Flood risk 1/10 · Minimal
- FEMA flood zone
- X (unshaded)
- Chance of flooding over 30 yrs
- 0.0%
- Est. flood insurance / yr
- $507 – $1,088
Fire risk 6/10 · Moderate
- Est. fire insurance / yr
- $610 – $1,132
Heat risk 9/10 · Severe
- Hot days now (above 113°F)
- 6 days/yr
- Hot days in 30 yrs
- 15 days/yr
Wind risk 1/10 · Minimal
- Chance of severe wind over 30 yrs
- —
Air-quality risk 2/10 · Minimal
- Unhealthy air days now
- 1 days/yr
- Unhealthy air days in 30 yrs
- 1 days/yr
Risk factors via First Street. Map © Google.
Why this score? — see what drove the C- grade
The composite is a weighted blend of 9 inputs, each scored 0–100. Each bar is that input's sub-score; the figure is the points it added to the 100-point composite (weight × sub-score).
- Cash flow +15.1/30.0
- ARV discount +12.9/15.0
- 1% rule +10.0/10.0
- DSCR +4.6/10.0
- Condition / age +4.0/5.0
- Rent growth +3.7/5.0
- Livability +2.9/5.0
- Schools +1.5/10.0
- Appreciation +0.0/10.0
$71,000
🖨 Deal sheet 📄 Offer letter ✓ Due diligence
Listing remarks
Own a brand new 2 bed 2 bath 2021 Clayton home starting at just $71000. Outside, you'll find a trex deck, custom storage shed, and a large carport. You also get the option to customize your landscaping and paint package to truly make it your own! Plus, 1-year free lot rent to kickstart your new journey or $6000 off the price of your new home - limited time offer. These homes are thoughtfully designed for modern living and comfort. The interior features sleek cabinetry, durable hard flooring throughout, brand-new appliances including a stacked washer/dryer, energy-efficient windows, and a smart thermostat. The spacious master suite boasts double sinks in the bath, while the versatile sec
Key facts
- Brand new appliances
- Large carport
- Custom storage shed
Tags
Property features AI
Finance
- Financial info: List price: $71,000
- HOA & community: Association fee: $510
Exterior
- Utilities: Natural gas; Electric for central air/heat pump
- Home design: Spec inventory, plan with custom options
- Exterior features: Address: 426 W Cottonwood Ln #51, Casa Grande, AZ 85122
Interior
- Bedrooms: 2 bedrooms
- Bathrooms: 2 full bathrooms
- Heating & cooling: Natural gas heating; Heat pump; Central air conditioning
- Interior features: Open living area (784 sq ft not shown per instructions)
Neighborhood map
What this means for you Summary
Snapshot
- This is a 2-bed/2.0-bath manufactured listed at $71k. Condition is rated good.
Deal economics
- At list price, monthly cash flow is $24 ($288/yr) — positive.
- The deal already cash-flows at list — no discount required.
- Meets the 1% rule at list price ($1k rent vs $71k).
- Recommended offer: $69k (3.0% below list) — sets the bar for market timing.
- Cap rate 6.7% vs local median 4.1% in Casa Grande — top-decile yield for the area; either an underpriced asset or a hidden risk that comps aren't pricing in. Stress-test before assuming the spread holds.
Location & tenants
- Location reads 58/100 on livability (#220 in AZ) — a working-class tenant base; expect higher turnover. Strengths: cost of living A+, housing A+; Watch: crime D+, employment D+, schools F.
- Casa Grande Union High School District (4453) (suburban): math 14% / reading 21% proficiency, ranked #193 of 249 in AZ (top 78%) — low school quality limits family demand, transient renter base, plan for 1-2y turnover.
- Market conditions: Rents rising fast (+4.6%/yr); 628 active listings in the ZIP; 22 comparable units currently listed for rent nearby; rentals at typical pace (median 15d on market — plan ~3-4 weeks tenant-placement turnaround); 9,504 units permitted in Pinal County in 2024 (776 in 5+ unit buildings).
Forward outlook
- Local home prices are declining (-3.0%/yr); year-one equity from $491 of loan paydown is wiped out by about $2k of value loss. Plan a longer hold.
Negotiation context
- It's been on market 39 days — a 3% lower offer ($69k) is reasonable based on typical stale-listing flexibility.
Risks & watch-outs
- Watch-outs: HOA is 39% of rent.
- Climate carrying-cost: major wildfire risk; extreme-heat days projected 6→15/yr by 2055 (HVAC capex compounding) — expect insurance premiums to compound above CPI over the hold.
Questions for the listing agent
- It's been on market 39 days. Have you received any prior offers? Is the seller open to a 3% concession, seller financing, or rate buy-down credit?
- What does the HOA fee cover, when was the last increase, and are there any pending special assessments or reserve-fund shortfalls?
- Is there a deadline driving the sale (1031 exchange, divorce, estate, relocation)? That informs how much negotiation room exists.
- Schools are F-rated, which usually means shorter tenancies and higher turnover. Who's the typical renter profile here, and what's been the actual vacancy rate?
- Crime grade is D in this area — have there been break-ins, vandalism, or insurance claims at this property in the last 3 years? What carrier currently insures it and at what premium?
- What's the average days-on-market for RENTAL listings here right now (not sales)? A rising rental-DOM trend means longer vacancies and softer asking-rent achievability than the comps imply.
- What's the recent tenant-quality profile in this submarket — average credit score on applications, eviction rate, late-payment / NSF rate, and stable-employment percentage? A property-management company in the area should have these aggregated.
- How much new for-sale + rental construction is in the pipeline within 1–3 miles? Heavy new supply typically softens prices + rents 12–24 months out; constrained supply supports both.
Investment metrics
- 1% rule
- 1.83% ✓
- Cap rate
- 6.70%
- Cash-on-cash
- 1.45%
- DSCR
- 1.06
- GRM
- 4.6
CMA / ARV
- ARV (on-the-fly)
- $80,752
- Comps found
- 12
Show comp detail 12 sales within ~0.75 mi
| Address | Dist | Beds/Ba | Sqft | Sold | Price | $/sf | Match |
|---|---|---|---|---|---|---|---|
| 426 W Cottonwood Ln #13 | 0.08mi | 2/2.0 | 784 (0%) | 8mo | $81,000 | $103 | 90 |
| 426 W Cottonwood Ln #11 | 0.08mi | 2/2.0 | 784 (0%) | 11mo | $88,000 | $112 | 87 |
| 426 W Cottonwood Ln #20 | 0.08mi | 2/2.5 | 786 (+0%) | 8mo | $89,000 | $113 | 87 |
| 426 W Cottonwood Ln #5 | 0.15mi | 2/2.0 | 784 (0%) | 13mo | $82,500 | $105 | 82 |
| 426 W Cottonwood Ln #4 | 0.15mi | 2/2.0 | 784 (0%) | 14mo | $81,000 | $103 | 82 |
| 426 W Cottonwood Ln #7 | 0.15mi | 2/2.0 | 784 (0%) | 15mo | $82,500 | $105 | 81 |
| 450 W Sunwest Dr #21 | 0.08mi | 2/2.0 | 896 (+14%) | 12mo | $40,000 | $45 | 63 |
| 450 W Sunwest Dr #1 | 0.08mi | 2/1.0 | 896 (+14%) | 13mo | $59,000 | $66 | 58 |
| 120 W O'neil Dr #72 | 0.45mi | 2/1.0 | 720 (-8%) | 6mo | $22,000 | $31 | 57 |
| 1451 N Pinal Ave #31 | 0.41mi | 1/1.0 (-1) | 900 (+15%) | 11mo | $15,000 | $17 | 38 |
| 708 W Mcmurray Blvd #38 | 0.56mi | 3/2.0 (+1) | 900 (+15%) | 8mo | $30,000 | $33 | 37 |
| 1451 N Pinal Ave #23 | 0.41mi | 1/1.0 (-1) | 900 (+15%) | 14mo | $9,000 | $10 | 35 |
Match score weights: distance 35% · size 25% · config 20% · recency 20%. Top-matched comps best support the ARV.
Projected returns pro-forma
-3.0% appreciation · 4.6% rent growth · sell at horizon
- IRR
- -10.0%
- Equity multiple
- 0.62×
- Total profit
- $-7,524
- Equity at exit
- $10,586
- IRR
- 3.5%
- Equity multiple
- 1.29×
- Total profit
- $5,760
- Equity at exit
- $6,139
Cash invested: $19,880 (down + closing). Projections, not guarantees.
Landlord ↔ Tenant lean methodology
- Overall (STATE)
- 87 Strongly Landlord-Friendly
- State Arizona
- 87 Strongly Landlord-Friendly · R+3
- County
- — inherits STATE
- City
- — inherits STATE
ZIP-level market 85122
- Home prices YoY
- -22.4%
- Rents YoY
- 4.6%
- Active inventory
- 628
- Price-to-rent
- 4.6×
Monthly cashflow live
- Estimated rent
- $1,297 high interval (Pro) →
- Mortgage (P&I)
- −$372
- Tax est. 1.5%
- −$89 /mo · $1,065/yr
- Insurance
- −$30
- HOA
- −$510
- Vacancy / Maint / Mgmt
- −$272
- Net cashflow
- $24
Break-even live
UW: 25.0% down · 7.5% · 30yr · 1.5% tax · 5.0% vac · 8.0% maint · 8.0% mgmt
Financing live
Cash to close
- Down payment
- $17,750
- Closing costs
- $2,130
- Reserves months
- —
- Total cash needed
- —
Loan-product check · same deal, 3 products live
Conventional
25% down · 7.5% · 30yr
- Down + closing
- —
- Monthly P&I
- —
- Monthly cashflow
- —
- DSCR
- —
- Eligible?
- —
Personal DTI + credit; lowest rate.
DSCR
20% down · 8.5% · 30yr
- Down + closing
- —
- Monthly P&I
- —
- Monthly cashflow
- —
- DSCR
- —
- Eligible?
- —
No personal income docs; deal must DSCR.
Hard money
10% down · 12.0% · 12mo
- Down + closing
- —
- Monthly P&I
- —
- Monthly cashflow
- —
- DSCR
- —
- Eligible?
- —
Short-term bridge; refi at stabilization.
Rent comps 22 comps
| Address | Beds | Baths | Sqft | Rent | $/sqft | DOM | Units | Dist |
|---|---|---|---|---|---|---|---|---|
| 541 W Melrose Dr Casa Grande, AZ | 3.0 | 2.0 | 1101 | $1,600 | $1.45 | 24d | 1 | 0.33mi |
| 290 W Viola St Unit 4 Casa Grande, AZ | 2.0 | 1.0 | 800 | $1,250 | $1.56 | 15d | 1 | 0.54mi |
| 701 W 12th St Unit F Casa Grande, AZ | 2.0 | 1.0 | 745 | $1,500 | $2.01 | 24d | 1 | 0.77mi |
| 1550 N Casa Grande Ave Casa Grande, AZ | 1.0–2.0 | 1.0–2.0 | 625 | $1,199 | $1.92 | 1d | 1 | 0.80mi |
| 1010 N Park Ave Casa Grande, AZ | 2.0 | 1.0 | 920 | $1,100 | $1.20 | 12d | 1 | 0.87mi |
| 507 W 10th St Apt D Casa Grande, AZ | 1.0 | 1.0 | 600 | $1,050 | $1.75 | 20d | 1 | 0.88mi |
| 1641 N Kadota Ave Casa Grande, AZ | 1.0–2.0 | 1.0–2.0 | 750 | $1,100 | $1.47 | 1d | 3 | 0.88mi |
| 420 E McMurray Blvd Casa Grande, AZ | 1.0 | 1.0 | 645 | $895 | $1.39 | 24d | 1 | 0.89mi |
| 1564 N Morrison Ave Casa Grande, AZ | 2.0–3.0 | 2.0 | 871 | $864 | $0.99 | 1d | 20 | 0.90mi |
| 1005 N Center Ave Unit A Casa Grande, AZ | 1.0 | 1.0 | 525 | $1,099 | $2.09 | 24d | 1 | 0.92mi |
| 1005 N Center Ave Unit A Casa Grande, AZ | 1.0 | 1.0 | 525 | $1,099 | $2.09 | 4d | 1 | 0.92mi |
| 416 W 9th St Unit 1 Casa Grande, AZ | 2.0 | 1.0 | 725 | $1,200 | $1.66 | 12d | 1 | 0.93mi |
| 300 W 9th St Casa Grande, AZ | 2.0 | 1.0 | 775 | $999 | $1.29 | 22d | 1 | 0.94mi |
| 419 W 9th St Apt A Casa Grande, AZ | 2.0 | 1.0 | 750 | $1,199 | $1.60 | 24d | 1 | 0.95mi |
| 803 N Park Ave Casa Grande, AZ | 2.0 | 1.0 | 822 | $1,275 | $1.55 | 5d | 1 | 1.03mi |
| 1650 N Kadota Ave Casa Grande, AZ | 1.0–2.0 | 1.0–2.0 | 612 | $1,170 | $1.91 | 1d | 5 | 1.05mi |
| 1113 W Corinthian Cir Casa Grande, AZ | 3.0 | 2.0 | 981 | $1,395 | $1.42 | 15d | 1 | 1.07mi |
| 1620 N Trekell Rd Casa Grande, AZ | 1.0–3.0 | 1.0–2.5 | 1090 | $2,165 | $1.99 | 1d | 1 | 1.30mi |
| 1926 N Avenida de Palmas Casa Grande, AZ | 2.0 | 2.0 | 1106 | $1,199 | $1.08 | 22d | 3 | 1.34mi |
| 1161 E O'Neil Dr Casa Grande, AZ | 2.0–4.0 | 2.0 | 1144 | $1,295 | $1.13 | 3d | 12 | 1.45mi |
| 511 N Brown Ave Casa Grande, AZ | 2.0 | 1.0 | 828 | $1,150 | $1.39 | 18d | 1 | 1.48mi |
| 515 E 4th St Casa Grande, AZ | 2.0 | 1.0 | 795 | $850 | $1.07 | 15d | 1 | 1.49mi |
HOA detail
- Monthly dues
- $510 · $6,120/yr
- Likely covers
- landscaping
Listing history 8 events
-
2026-06-09days on market $71,000 Active 39 DOM
-
2026-06-08days on market $71,000 Active 38 DOM
-
2026-06-07days on market $71,000 Active 37 DOM
-
2026-06-04days on market $71,000 Active 34 DOM
-
2026-06-03days on market $71,000 Active 33 DOM
-
2026-06-02days on market $71,000 Active 32 DOM
-
2026-06-01days on market $71,000 Active 31 DOM
-
2026-05-31days on market $71,000 Active 30 DOM
ⓘ Source: listings_history table (triggers on properties + properties_extension) + one-shot
backfill from property_details.listing_events for pre-trigger history.
Climate risk First Street
- Flood 1/10 Low FEMA zone X (unshaded) · 0% chance over 30 yrs
- Wildfire 6/10 Major
- Heat 9/10 Extreme 6 d/yr ≥113°F today · 15 d/yr by 30 yrs out
- Wind 1/10 Low
- Air quality 2/10 Low 1 unhealthy d/yr today · 1 by 30 yrs out
Nearby sold comps map
Loading sold comps map…
Walkable amenities ~0.75 mi
Loading nearby amenities…
Taxation est. · year 1
- Rental income
- $15,564
- − Mortgage interest
- −$3,977
- − Property taxes
- −$1,065
- − Insurance
- −$355
- − Repairs & maintenance
- −$1,245
- − Management
- −$1,245
- − HOA
- −$6,120
- − Depreciation
- −$2,065
- Taxable loss
- −$509
- Est. tax savings @ 24.0%
- +$122
- After-tax cash flow
- $410/yr
For passive investors: Depreciation is non-cash, so a rental often shows a tax loss while cash-flowing — sheltering income. Rental losses are passive: they offset passive income freely, and up to $25,000/yr can offset ordinary (W-2) income if you actively participate and your MAGI is under $100k (phasing out to $0 by $150k); unused losses carry forward. On sale, claimed depreciation is recaptured at up to 25%, and gains may owe capital-gains tax (a 1031 exchange can defer both). Figures are a year-1 estimate at your 24.0% rate — not tax advice; consult a CPA.
Condition & rehab AI · 10 photos
This 2021 Clayton manufactured home is in excellent condition with modern finishes and energy-efficient features. Customizable landscaping and paint package can further enhance its appeal.
Value-add opportunities
- Both Custom landscaping and paint package — Personalizes the home and enhances curb appeal
- Both Smart thermostat — Energy-efficient and user-friendly
- Both Energy-efficient windows — Reduces energy costs and enhances comfort
- Both Smart home security system — Enhances safety and adds value
Renovation cost estimate screening
Value-add ROI direction
- Both Custom landscaping and paint package — Personalizes the home and enhances curb appeal ↑
- Both Smart thermostat — Energy-efficient and user-friendly ↑
- Both Energy-efficient windows — Reduces energy costs and enhances comfort ↑
- Both Smart home security system — Enhances safety and adds value ↑
ⓘ Cost ranges are severity-bucket heuristics (US national rule-of-thumb). Get contractor quotes + a written scope before underwriting a rehab budget.
Schools (NCES district)
- District
- Casa Grande Union High School District (4453)
- NCES district ID
- 0401740
- Math proficiency
- 14% ▼ -15.00%
- Reading proficiency
- 21% ▼ -10.00%
- Median HH income
- $45,373
- Composite
- 15.38/100
- National rank
- #9319
- State rank
- #193 of 249 in AZ
Livability — Casa Grande
- Score
- 58/100
- State rank
- #220
- US rank
- #21534
Category grades
Schools grade is shown separately in the Schools card above.
Census & demographics
- Census place
- Casa Grande, AZ
- County
- Pinal County · 399,947 people
- City population
- 69,701
- Metro
- Phoenix-Mesa-Chandler, AZ
- Population (ZIP)
- 61,624
- Household income
- $68,443
- Rent vs Own
- Severe rent burden
- 1250.0
Population outlook (Pinal County) Hauer SSP2
- Today (2025)
- 437,574 people
- By 2030
- 446,903 · +2.1%
- By 2040
- 452,589 · +3.4%
- By 2050
- 444,126 · +1.5%
- By 2075
- 430,300 · -1.7%
- By 2100
- 393,536 · -10.1%
Race, ethnicity, and origin ACS 2023
- Neighborhood character
- Diverse neighborhood (Simpson 0.63)
- Race & ethnicity
- Hispanic / Latino 44% White 42% Two or more races 21% Black 4% Native American 4% Asian 1%
- Hispanic origin (detail)
- Mexican 40%
- Common ancestry
- Lithuanian 1% Slovak 1% Portuguese 1%
- Foreign-born
- 12% · Canada
- Languages at home
- 75% English-only · Spanish 23% Tagalog/Filipino 1% Other Indo-European 1%
Political lean MEDSL · Pinal
- 2024 margin
- Strong R (+22.1) · D 38.5% · R 60.6%
- 2008→2024 swing
- -7.6pp toward R · 2008: -14.5pp · 2024: -22.1pp
- All cycles
- 2024: R+22.1 2020: R+17.3 2016: R+19.3 2012: R+17.1 2008: R+14.5
Not yet ingested
- Civics
- —
Market trends
- HPI YoY
- ▼ -67.32%
- Current HPI
- 233.148
- Rent YoY
- ▲ 4.60%
- Metro
- Phoenix-Mesa-Chandler, AZ
- State GDP YoY
- ▲ 4.54%
- F500 in state
- 20
Industry mix (Fortune 500 HQ in AZ)
| Industry | F500 HQs | Revenue |
|---|---|---|
| Technology | 2 | $13B |
|
||
| Mining / Metals | 1 | $23B |
|
||
| Environmental Services | 1 | $16B |
|
||
| Metals / Steel | 1 | $14B |
|
||
| Technology Distribution | 1 | $9B |
|
||
| Homebuilding | 1 | $8B |
|
||
Cash-flow waterfall
monthlySold comps — $/sqft
last 12 mo · ≤1 miLoading sold comps…