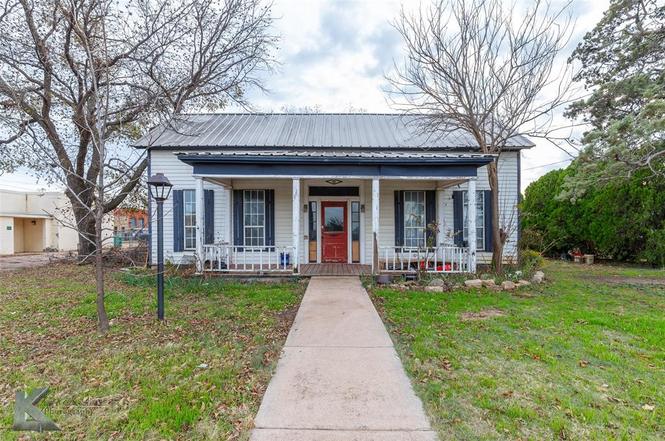
141 W 3rd St · Baird, TX
Flood risk No data
- FEMA flood zone
- —
- Chance of flooding over 30 yrs
- —
- Est. flood insurance / yr
- —
Fire risk No data
- Est. fire insurance / yr
- —
Heat risk No data
- Hot days now (above threshold)
- —
- Hot days in 30 yrs
- —
Wind risk No data
- Chance of severe wind over 30 yrs
- —
Air-quality risk No data
- Unhealthy air days now
- —
- Unhealthy air days in 30 yrs
- —
Risk factors via First Street. Map © Google.
Why this score? — see what drove the A grade
The composite is a weighted blend of 9 inputs, each scored 0–100. Each bar is that input's sub-score; the figure is the points it added to the 100-point composite (weight × sub-score).
- Cash flow +30.0/30.0
- ARV discount +15.0/15.0
- 1% rule +10.0/10.0
- DSCR +10.0/10.0
- Appreciation +8.9/10.0
- Livability +3.7/5.0
- Schools +3.6/10.0
- Rent growth +2.5/5.0
- Condition / age +2.5/5.0
$135,000
🖨 Deal sheet 📄 Offer letter ✓ Due diligence
Listing remarks
Welcome to this charming home set on a massive corner lot, featuring a classic metal roof that offers exceptional longevity, durability, and energy efficiency—all while adding timeless curb appeal. A covered front porch invites you in, leading to a gorgeous foyer highlighted by rich wood paneling (Texas-style wainscoting!), a warm design detail that’s also featured in one of the bathrooms. Inside, you’ll find four large bedrooms, two spacious bathrooms, and original hardwood floors. The entire home is truly a blank canvas—offering a clean starting point for full customization. The back entrance includes a generously sized mud room that provides excellent extra storag
Key facts
- Covered front porch
- Rich wood paneling
- Massive corner lot
Tags
Neighborhood map
What this means for you Summary
Snapshot
- This is a 4-bed/2.0-bath single-family listed at $135k.
Deal economics
- At list price, monthly cash flow is $2k ($21k/yr) — positive.
- The deal already cash-flows at list — no discount required.
- Meets the 1% rule at list price ($4k rent vs $135k).
- Recommended offer: $119k (12.0% below list) — sets the bar for market timing.
Location & tenants
- Location reads 74/100 on livability (#195 in TX, #4,977 nationally) — a middle-class / working-renter tenant base. Strengths: cost of living A+, housing A+, health & safety A+; Watch: employment C-, amenities F, commute F.
- Baird ISD (rural): math 40% / reading 40% proficiency, ranked #731 of 1,141 in TX (top 64%) — families likely to look elsewhere, expect single-tenant / working-renter base with shorter leases; 63% free/reduced lunch — lower-income household profile, screen leases tightly.
- Zoned schools: Baird El (math 47% / reading 37%, grade F, #1,335 of 4,322 statewide, top 33%, 169 students, 57% FRL).
- Market conditions: 20 active listings in the ZIP; 1 comparable units currently listed for rent nearby; 11 units permitted in Callahan County in 2024 (0 in 5+ unit buildings).
Forward outlook
- In year one you build about $11k of equity ($933 loan paydown + $10k appreciation (7.7% local appreciation)).
- Callahan County population projected to shrink 5% by 2050 — rents likely to lag national; underwrite the cash flow, not the appreciation.
- At projected returns (7.7% appreciation + 3.0% rent growth), your $38k cash investment doubles in ~2 years — after that, you're playing with house money.
- By year 4, paydown + projected appreciation supports a ~$39k cash-out refi (75% LTV) — recoverable capital for the next deal without selling this one.
Negotiation context
- It's been on market 140 days — a 12% lower offer ($119k) is reasonable based on typical stale-listing flexibility.
Risks & watch-outs
- Watch-outs: property tax is 2.5% of price; built in 1950 — expect roof / HVAC / electrical / plumbing capex.
Questions for the listing agent
- It's been on market 140 days. Have you received any prior offers? Is the seller open to a 12% concession, seller financing, or rate buy-down credit?
- Built in 1950 — when were the roof, HVAC, electrical panel, plumbing, and water heater last replaced?
- Property tax is high relative to price — has the assessment been appealed recently, and will the sale trigger a re-assessment?
- Why hasn't it sold? Are there any deal-killer items the seller is aware of (foundation, flood, title, zoning, code violations)?
- Is there a deadline driving the sale (1031 exchange, divorce, estate, relocation)? That informs how much negotiation room exists.
- What's the average days-on-market for RENTAL listings here right now (not sales)? A rising rental-DOM trend means longer vacancies and softer asking-rent achievability than the comps imply.
- What's the recent tenant-quality profile in this submarket — average credit score on applications, eviction rate, late-payment / NSF rate, and stable-employment percentage? A property-management company in the area should have these aggregated.
- How much new for-sale + rental construction is in the pipeline within 1–3 miles? Heavy new supply typically softens prices + rents 12–24 months out; constrained supply supports both.
Investment metrics
- 1% rule
- 2.59% ✓
- Cap rate
- 21.54%
- Cash-on-cash
- 54.45%
- DSCR
- 3.42
- GRM
- 3.2
CMA / ARV
- ARV (on-the-fly)
- $183,040
- Comps found
- 7
Show comp detail 7 sales within ~0.75 mi
| Address | Dist | Beds/Ba | Sqft | Sold | Price | $/sf | Match |
|---|---|---|---|---|---|---|---|
| 324 Vine St | 0.30mi | 3/2.0 (-1) | 2,121 (+2%) | 2mo | $15,000 | $7 | 76 |
| 308 Race St | 0.22mi | 3/2.5 (-1) | 2,011 (-3%) | 5mo | $195,000 | $97 | 73 |
| 541 Chestnut St | 0.22mi | 3/2.0 (-1) | 1,940 (-7%) | 6mo | $259,000 | $134 | 68 |
| 771 E 6th St | 0.50mi | 3/2.0 (-1) | 1,913 (-8%) | 2mo | $300,000 | $157 | 57 |
| 732 Race St | 0.42mi | 3/2.0 (-1) | 1,984 (-5%) | 14mo | $175,000 | $88 | 56 |
| 540 Callowhill St | 0.43mi | 4/2.0 | 2,392 (+15%) | 2mo | $164,000 | $69 | 53 |
| 541 Cherry St | 0.45mi | 3/2.0 (-1) | 2,127 (+2%) | 24mo | $165,000 | $78 | 50 |
Match score weights: distance 35% · size 25% · config 20% · recency 20%. Top-matched comps best support the ARV.
Projected returns pro-forma
7.74% appreciation · 3.0% rent growth · sell at horizon
- IRR
- 64.9%
- Equity multiple
- 5.31×
- Total profit
- $162,753
- Equity at exit
- $100,188
- IRR
- 60.4%
- Equity multiple
- 11.35×
- Total profit
- $391,251
- Equity at exit
- $196,650
Cash invested: $37,800 (down + closing). Projections, not guarantees.
Landlord ↔ Tenant lean methodology
- Overall (STATE)
- 87 Strongly Landlord-Friendly
- State Texas
- 87 Strongly Landlord-Friendly · R+5
- County
- — inherits STATE
- City
- — inherits STATE
ZIP-level market 79504
- Home prices YoY
- 5.0%
- Active inventory
- 20
- Price-to-rent
- 3.2×
Monthly cashflow live
- Estimated rent
- $3,500 medium interval (Pro) →
- Mortgage (P&I)
- −$708
- Tax from tax record
- −$285 /mo · $3,426/yr
- Insurance
- −$56
- HOA
- −$0
- Vacancy / Maint / Mgmt
- −$735
- Net cashflow
- $1,715
Break-even live
UW: 25.0% down · 7.5% · 30yr · 1.5% tax · 5.0% vac · 8.0% maint · 8.0% mgmt
Financing live
Cash to close
- Down payment
- $33,750
- Closing costs
- $4,050
- Reserves months
- —
- Total cash needed
- —
Loan-product check · same deal, 3 products live
Conventional
25% down · 7.5% · 30yr
- Down + closing
- —
- Monthly P&I
- —
- Monthly cashflow
- —
- DSCR
- —
- Eligible?
- —
Personal DTI + credit; lowest rate.
DSCR
20% down · 8.5% · 30yr
- Down + closing
- —
- Monthly P&I
- —
- Monthly cashflow
- —
- DSCR
- —
- Eligible?
- —
No personal income docs; deal must DSCR.
Hard money
10% down · 12.0% · 12mo
- Down + closing
- —
- Monthly P&I
- —
- Monthly cashflow
- —
- DSCR
- —
- Eligible?
- —
Short-term bridge; refi at stabilization.
Rent comps 1 comps
| Address | Beds | Baths | Sqft | Rent | $/sqft | DOM | Units | Dist |
|---|---|---|---|---|---|---|---|---|
| 340 E 3rd St Baird, TX | 3.0 | 3.0 | 2670 | $3,500 | $1.31 | 43d | 1 | 0.16mi |
Listing history 7 events
-
2026-04-27status Pending
-
2026-04-20historical Active Option Contract
-
2026-02-28price $135,000
-
2025-12-22price $150,000
-
2025-12-08$169,900 Active
-
2007-06-04soldstatus
-
2006-07-07soldstatus
ⓘ Source: listings_history table (triggers on properties + properties_extension) + one-shot
backfill from property_details.listing_events for pre-trigger history.
Tax reassessment forecast TX · Resets to sale price
- Current annual tax
- $3,426 · $285/mo
- Projected year-2 tax
- $3,426 · $285/mo
- Expected delta
- $0/yr ($0/mo · 0.0%)
ⓘ Screening estimate from a state-policy table — verify with the county assessor before closing.
Nearby sold comps map
Loading sold comps map…
Walkable amenities ~0.75 mi
Loading nearby amenities…
Taxation est. · year 1
- Rental income
- $42,000
- − Mortgage interest
- −$7,562
- − Property taxes
- −$3,426
- − Insurance
- −$675
- − Repairs & maintenance
- −$3,360
- − Management
- −$3,360
- − Depreciation
- −$3,927
- Taxable income
- $19,690
- Est. tax owed @ 24.0%
- −$4,726
- After-tax cash flow
- $15,858/yr
For passive investors: Depreciation is non-cash, so a rental often shows a tax loss while cash-flowing — sheltering income. Rental losses are passive: they offset passive income freely, and up to $25,000/yr can offset ordinary (W-2) income if you actively participate and your MAGI is under $100k (phasing out to $0 by $150k); unused losses carry forward. On sale, claimed depreciation is recaptured at up to 25%, and gains may owe capital-gains tax (a 1031 exchange can defer both). Figures are a year-1 estimate at your 24.0% rate — not tax advice; consult a CPA.
Schools (NCES district)
- District
- Baird ISD
- NCES district ID
- 4809280
- Math proficiency
- 40% ▲ 10.00%
- Reading proficiency
- 40% ▲ 5.00%
- Median HH income
- $43,351
- Composite
- 36.29/100
- National rank
- #9407
- State rank
- #731 of 1141 in TX
Livability — Baird
- Score
- 74/100
- State rank
- #195
- US rank
- #4977
Category grades
Schools grade is shown separately in the Schools card above.
Census & demographics
- Census place
- Baird, TX
- Population (ZIP)
- 2,995
Population outlook (Callahan County) Hauer SSP2
- Today (2025)
- 13,664 people
- By 2030
- 13,578 · -0.6%
- By 2040
- 13,283 · -2.8%
- By 2050
- 13,008 · -4.8%
- By 2075
- 12,354 · -9.6%
- By 2100
- 11,326 · -17.1%
Race, ethnicity, and origin ACS 2023
- Neighborhood character
- Predominantly White (84%)
- Race & ethnicity
- White 84% Hispanic / Latino 11% Two or more races 7% Black 2%
- Hispanic origin (detail)
- Mexican 10%
- Common ancestry
- Italian 16% Slovak 2% Iranian 1%
- Foreign-born
- 1% · Canada
- Languages at home
- 94% English-only · Spanish 6%
Political lean MEDSL · Callahan
- 2024 margin
- Solid R (+77.6) · D 10.9% · R 88.5%
- 2008→2024 swing
- -15.9pp toward R · 2008: -61.7pp · 2024: -77.6pp
- All cycles
- 2024: R+77.6 2020: R+77.3 2016: R+77.2 2012: R+69.8 2008: R+61.7
Not yet ingested
- Civics
- —
Market trends
- HPI YoY
- ▲ 7.74%
- Current HPI
- 161.9583
- Rent YoY
- —
- Metro
- —
- State GDP YoY
- ▲ 3.95%
- F500 in state
- 110
Industry mix (Fortune 500 HQ in TX)
| Industry | F500 HQs | Revenue |
|---|---|---|
| Energy | 16 | $1,198B |
|
||
| Technology | 5 | $198B |
|
||
| Engineering / Construction | 4 | $72B |
|
||
| Energy Services | 3 | $60B |
|
||
| Utilities | 3 | $41B |
|
||
| Healthcare | 2 | $330B |
|
||
Price history
-20.5% since first listed7 events — show timeline
- 2026-04-27 Pending — NTREIS
- 2026-04-20 Contingent — NTREIS
- 2026-02-28 Price Changed $135,000 NTREIS
- 2025-12-22 Price Changed $150,000 NTREIS
- 2025-12-08 Listed $169,900 NTREIS
- 2007-06-04 Sold (Public Records) — Public Records
- 2006-07-07 Sold (Public Records) — Public Records
Property tax history
+0.9%/yrLatest (2025): $3,426 · +5.4% YoY. Source: county tax records.
Cash-flow waterfall
monthlySold comps — $/sqft
last 12 mo · ≤1 miLoading sold comps…