1013 Magdalena Way · Midlothian, TX
Flood risk No data
- FEMA flood zone
- —
- Chance of flooding over 30 yrs
- —
- Est. flood insurance / yr
- —
Fire risk No data
- Est. fire insurance / yr
- —
Heat risk No data
- Hot days now (above threshold)
- —
- Hot days in 30 yrs
- —
Wind risk No data
- Chance of severe wind over 30 yrs
- —
Air-quality risk No data
- Unhealthy air days now
- —
- Unhealthy air days in 30 yrs
- —
Risk factors via First Street. Map © Google.
Why this score? — see what drove the D- grade
The composite is a weighted blend of 9 inputs, each scored 0–100. Each bar is that input's sub-score; the figure is the points it added to the 100-point composite (weight × sub-score).
- ARV discount +14.1/15.0
- Cash flow +6.9/30.0
- Schools +4.8/10.0
- Rent growth +3.6/5.0
- Livability +3.5/5.0
- Condition / age +2.5/5.0
- 1% rule +1.8/10.0
- DSCR +1.1/10.0
- Appreciation +0.0/10.0
$294,990
🖨 Deal sheet 📄 Offer letter ✓ Due diligence
Listing remarks MLS
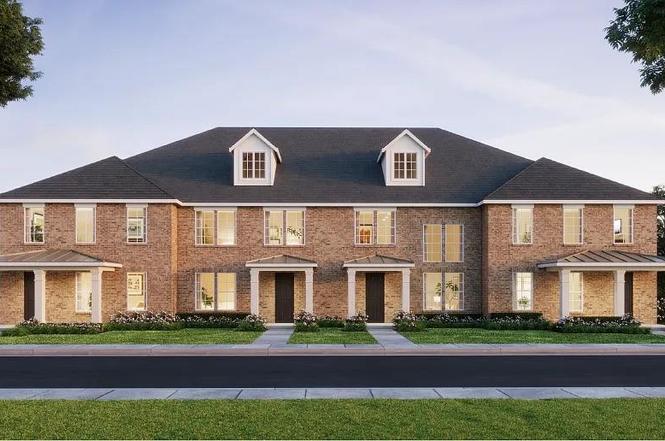
This floor plan exudes a palatial grandeur with its soaring vaulted ceilings that amplify the sense of space and baths the home in natural light. The owner's suite is to die for with a closet big enough to do cartwheels, no fighting for closet space in this one. The open gourmet kitchen has beautiful quartz counters which look out over the dining and living, makes entertaining easy and comfortable. The game room upstairs is large enough for entertaining or setting up your home office. Your downstairs is adorned with beautiful high grade wood look plank flooring that will handle all the foot traffic coming through. Your oversized secondary bedroom has a nice walk-in closet. Great storage space throughout. Energy efficiency with whole home quality construction. Too many options on this beautiful home to list.
Key facts
- 2 garage spots
- Built 2026
- Listed 63 days
Neighborhood map
What this means for you Summary
Snapshot
- This is a 2-bed/2.5-bath townhouse listed at $295k.
Deal economics
- At list price, monthly cash flow is $-450 ($-5k/yr) — negative.
- To cash-flow at today's rent, offer at most $230k (22.1% below list).
- To meet the 1% rule (rent ≥ 1% of price), the offer needs to be $201k (31.8% below list).
- Recommended offer: $201k (31.8% below list) — sets the bar for 1% rule.
- Cap rate 4.5% vs local median 3.5% in Midlothian — meaningfully above typical; check what's discounted (condition, days-on-market, listing class) to confirm the premium yield is real.
Location & tenants
- Location reads 70/100 on livability (#371 in TX) — a middle-class / working-renter tenant base. Strengths: crime A+, employment A+, housing A+; Watch: amenities F, commute F, health & safety F.
- Midlothian ISD (suburban): math 53% / reading 52% proficiency, ranked #94 of 826 in TX (top 11%) — acceptable for families but not a draw, mixed tenant base, ~2y average lease.
- Market conditions: Rents rising fast (+4.3%/yr); 1112 active listings in the ZIP; 8 comparable units currently listed for rent nearby; rentals at typical pace (median 15d on market — plan ~3-4 weeks tenant-placement turnaround); high-income renter base; 3,016 units permitted in Ellis County in 2024 (20 in 5+ unit buildings).
Forward outlook
- Local home prices are declining (-3.0%/yr); year-one equity from $2k of loan paydown is wiped out by about $9k of value loss. Plan a longer hold.
- Ellis County population projected at +36% by 2050 — long-run rental-demand tailwind backs the buy-and-hold thesis.
Negotiation context
- It's been on market 64 days — a 6% lower offer ($277k) is reasonable based on typical stale-listing flexibility.
Questions for the listing agent
- What do current leases actually rent for vs. the listed asking? Can we see a recent rent roll and the last 12 months of T-12 income?
- It's been on market 64 days. Have you received any prior offers? Is the seller open to a 32% concession, seller financing, or rate buy-down credit?
- Why hasn't it sold? Are there any deal-killer items the seller is aware of (foundation, flood, title, zoning, code violations)?
- Is there a deadline driving the sale (1031 exchange, divorce, estate, relocation)? That informs how much negotiation room exists.
- Schools are B-rated — typically a magnet for longer-tenancy family renters. What's the average tenant stay here, and is there a school-zone premium baked into asking?
- The area grade is low — what's the realistic commute time and amenity access for the typical tenant pool here? Any planned neighborhood developments (good or bad) we should know about?
- What's the average days-on-market for RENTAL listings here right now (not sales)? A rising rental-DOM trend means longer vacancies and softer asking-rent achievability than the comps imply.
- What's the recent tenant-quality profile in this submarket — average credit score on applications, eviction rate, late-payment / NSF rate, and stable-employment percentage? A property-management company in the area should have these aggregated.
- How much new for-sale + rental construction is in the pipeline within 1–3 miles? Heavy new supply typically softens prices + rents 12–24 months out; constrained supply supports both.
Investment metrics
- 1% rule
- 0.68% ✗
- Cap rate
- 4.46%
- Cash-on-cash
- -6.54%
- DSCR
- 0.71
- GRM
- 12.2
CMA / ARV
- ARV (median comp)
- $345,354
- List price
- $294,990
- Delta
- -14.58%
- Verdict
- UNDERPRICED
- Comps
- 14 within 1.0 mi
Show comp detail 5 sales within ~0.75 mi
| Address | Dist | Beds/Ba | Sqft | Sold | Price | $/sf | Match |
|---|---|---|---|---|---|---|---|
| 1021 Magdalena Way | 0.02mi | 2/2.5 | 1,900 (0%) | 1mo | $321,500 | $169 | 98 |
| 1029 Magdalena Way | 0.04mi | 2/2.5 | 1,900 (0%) | 4mo | $315,990 | $166 | 95 |
| 1037 Magdalena Way | 0.07mi | 2/2.5 | 1,900 (0%) | 14mo | $334,990 | $176 | 86 |
| 1015 Magdalena Way | 0.00mi | 3/2.5 (+1) | 2,127 (+12%) | 0mo | $319,990 | $150 | 74 |
| 1031 Magdalena Way | 0.05mi | 3/2.5 (+1) | 2,127 (+12%) | 5mo | $329,990 | $155 | 69 |
Match score weights: distance 35% · size 25% · config 20% · recency 20%. Top-matched comps best support the ARV.
Projected returns pro-forma
-3.0% appreciation · 4.32% rent growth · sell at horizon
- IRR
- -26.1%
- Equity multiple
- 0.11×
- Total profit
- $-73,735
- Equity at exit
- $43,984
- IRR
- -19.2%
- Equity multiple
- -0.08×
- Total profit
- $-89,597
- Equity at exit
- $25,505
Cash invested: $82,597 (down + closing). Projections, not guarantees.
Landlord ↔ Tenant lean methodology
- Overall (STATE)
- 87 Strongly Landlord-Friendly
- State Texas
- 87 Strongly Landlord-Friendly · R+5
- County
- — inherits STATE
- City
- — inherits STATE
ZIP-level market 76065
- Home prices YoY
- -18.9%
- Rents YoY
- 4.3%
- Active inventory
- 1112
- Price-to-rent
- 12.2×
Monthly cashflow live
- Estimated rent
- $2,011 high interval (Pro) →
- Mortgage (P&I)
- −$1,547
- Tax est. 1.5%
- −$369 /mo · $4,425/yr
- Insurance
- −$123
- HOA
- −$0
- Vacancy / Maint / Mgmt
- −$422
- Net cashflow
- $-450
Break-even live
UW: 25.0% down · 7.5% · 30yr · 1.5% tax · 5.0% vac · 8.0% maint · 8.0% mgmt
Financing live
Cash to close
- Down payment
- $73,748
- Closing costs
- $8,850
- Reserves months
- —
- Total cash needed
- —
Loan-product check · same deal, 3 products live
Conventional
25% down · 7.5% · 30yr
- Down + closing
- —
- Monthly P&I
- —
- Monthly cashflow
- —
- DSCR
- —
- Eligible?
- —
Personal DTI + credit; lowest rate.
DSCR
20% down · 8.5% · 30yr
- Down + closing
- —
- Monthly P&I
- —
- Monthly cashflow
- —
- DSCR
- —
- Eligible?
- —
No personal income docs; deal must DSCR.
Hard money
10% down · 12.0% · 12mo
- Down + closing
- —
- Monthly P&I
- —
- Monthly cashflow
- —
- DSCR
- —
- Eligible?
- —
Short-term bridge; refi at stabilization.
Rent comps 8 comps
| Address | Beds | Baths | Sqft | Rent | $/sqft | DOM | Units | Dist |
|---|---|---|---|---|---|---|---|---|
| 1007 Sierra Vista Ct Midlothian, TX | 3.0 | 2.5 | 1412 | $2,300 | $1.63 | 24d | 1 | 0.71mi |
| 101 W Maple Ridge Ct Unit 155E Midlothian, TX | 3.0 | 2.5 | 1608 | $1,995 | $1.24 | 15d | 1 | 0.72mi |
| 401 East Avenue G Unit G Midlothian, TX | 2.0 | 1.0 | 1501 | $1,700 | $1.13 | 2d | 1 | 0.75mi |
| 411 E Avenue G Midlothian, TX | 3.0 | 2.0 | 1526 | $1,975 | $1.29 | 43d | 1 | 0.75mi |
| 925 Chaparral Trl Midlothian, TX | 3.0 | 2.5 | 1307 | $1,950 | $1.49 | 4d | 1 | 0.78mi |
| 721 Eastridge Dr Midlothian, TX | 1.0–3.0 | 1.0–2.0 | 992 | $1,464 | $1.48 | 2d | 22 | 0.80mi |
| 315 E Avenue F Midlothian, TX | 3.0 | 2.0 | 2014 | $2,525 | $1.25 | 7d | 1 | 0.81mi |
| 900 W Avenue F Midlothian, TX | 2.0 | 1.0 | 1419 | $1,950 | $1.37 | 20d | 1 | 1.00mi |
Listing history 14 events
-
2026-06-18days on market $294,990 Active 64 DOM
-
2026-06-17pricedays on market $294,990 Active 63 DOM
-
2026-06-15pricedays on market $306,450 Active 1 DOM
-
2026-06-15days on market $294,990 Active 61 DOM
-
2026-06-13days on market $294,990 Active 59 DOM
-
2026-06-09pricedays on market $294,990 Active 55 DOM
-
2026-06-08days on market $299,900 Active 54 DOM
-
2026-06-07days on market $299,900 Active 53 DOM
-
2026-06-04days on market $299,900 Active 50 DOM
-
2026-06-03days on market $299,900 Active 49 DOM
-
2026-06-02days on market $299,900 Active 48 DOM
-
2026-06-01days on market $299,900 Active 47 DOM
-
2026-05-31days on market $299,900 Active 46 DOM
-
2026-04-16$299,900 Active 818-char remark
Show marketing remark (818 chars)
This floor plan exudes a palatial grandeur with its soaring vaulted ceilings that amplify the sense of space and baths the home in natural light. The owner's suite is to die for with a closet big enough to do cartwheels, no fighting for closet space in this one. The open gourmet kitchen has beautiful quartz counters which look out over the dining and living, makes entertaining easy and comfortable. The game room upstairs is large enough for entertaining or setting up your home office. Your downstairs is adorned with beautiful high grade wood look plank flooring that will handle all the foot traffic coming through. Your oversized secondary bedroom has a nice walk-in closet. Great storage space throughout. Energy efficiency with whole home quality construction. Too many options on this beautiful home to list.
ⓘ Source: listings_history table (triggers on properties + properties_extension) + one-shot
backfill from property_details.listing_events for pre-trigger history.
Nearby sold comps map
Loading sold comps map…
Walkable amenities ~0.75 mi
Loading nearby amenities…
Taxation est. · year 1
- Rental income
- $24,129
- − Mortgage interest
- −$16,524
- − Property taxes
- −$4,425
- − Insurance
- −$1,475
- − Repairs & maintenance
- −$1,930
- − Management
- −$1,930
- − Depreciation
- −$8,582
- Taxable loss
- −$10,737
- Est. tax savings @ 24.0%
- +$2,577
- After-tax cash flow
- $-2,825/yr
For passive investors: Depreciation is non-cash, so a rental often shows a tax loss while cash-flowing — sheltering income. Rental losses are passive: they offset passive income freely, and up to $25,000/yr can offset ordinary (W-2) income if you actively participate and your MAGI is under $100k (phasing out to $0 by $150k); unused losses carry forward. On sale, claimed depreciation is recaptured at up to 25%, and gains may owe capital-gains tax (a 1031 exchange can defer both). Figures are a year-1 estimate at your 24.0% rate — not tax advice; consult a CPA.
Schools (NCES district)
- District
- Midlothian ISD
- NCES district ID
- 4830600
- Math proficiency
- 53% ▼ -7.00%
- Reading proficiency
- 52% ▼ -1.00%
- Median HH income
- $85,068
- Composite
- 48.22/100
- National rank
- #2165
- State rank
- #94 of 826 in TX
Livability — Midlothian
- Score
- 70/100
- State rank
- #371
- US rank
- #7851
Category grades
Schools grade is shown separately in the Schools card above.
Census & demographics
- Census place
- Midlothian, TX
- County
- Ellis County · 199,237 people
- City population
- 47,438
- Metro
- Dallas-Fort Worth-Arlington, TX
- Population (ZIP)
- 47,438
- Household income
- $127,756
- Rent vs Own
- Severe rent burden
- 811.0
Population outlook (Ellis County) Hauer SSP2
- Today (2025)
- 194,556 people
- By 2030
- 209,679 · +7.8%
- By 2040
- 238,837 · +22.8%
- By 2050
- 265,451 · +36.4%
- By 2075
- 326,571 · +67.9%
- By 2100
- 362,156 · +86.1%
Race, ethnicity, and origin ACS 2023
- Neighborhood character
- Predominantly White (65%)
- Race & ethnicity
- White 65% Hispanic / Latino 20% Two or more races 13% Black 11%
- Hispanic origin (detail)
- Mexican 15%
- Common ancestry
- Lithuanian 2% Italian 2% Romanian 1%
- Foreign-born
- 5% · Canada
- Languages at home
- 88% English-only · Spanish 10% Other Indo-European 1%
Political lean MEDSL · Ellis
- 2024 margin
- Solid R (+31.1) · D 34.0% · R 65.1%
- 2008→2024 swing
- +11.2pp toward D · 2008: -42.2pp · 2024: -31.1pp
- All cycles
- 2024: R+31.1 2020: R+34.1 2016: R+45.4 2012: R+47.5 2008: R+42.2
Not yet ingested
- Civics
- —
Market trends
- HPI YoY
- ▼ -56.85%
- Current HPI
- 243.5953
- Rent YoY
- ▲ 4.32%
- Metro
- Dallas-Fort Worth-Arlington, TX
- State GDP YoY
- ▲ 3.95%
- F500 in state
- 110
Industry mix (Fortune 500 HQ in TX)
| Industry | F500 HQs | Revenue |
|---|---|---|
| Energy | 16 | $1,198B |
|
||
| Technology | 5 | $198B |
|
||
| Engineering / Construction | 4 | $72B |
|
||
| Energy Services | 3 | $60B |
|
||
| Utilities | 3 | $41B |
|
||
| Healthcare | 2 | $330B |
|
||
Price history
1 event — show timeline
- 2026-04-16 Listed $299,900 Zillow
Cash-flow waterfall
monthlySold comps — $/sqft
last 12 mo · ≤1 miLoading sold comps…