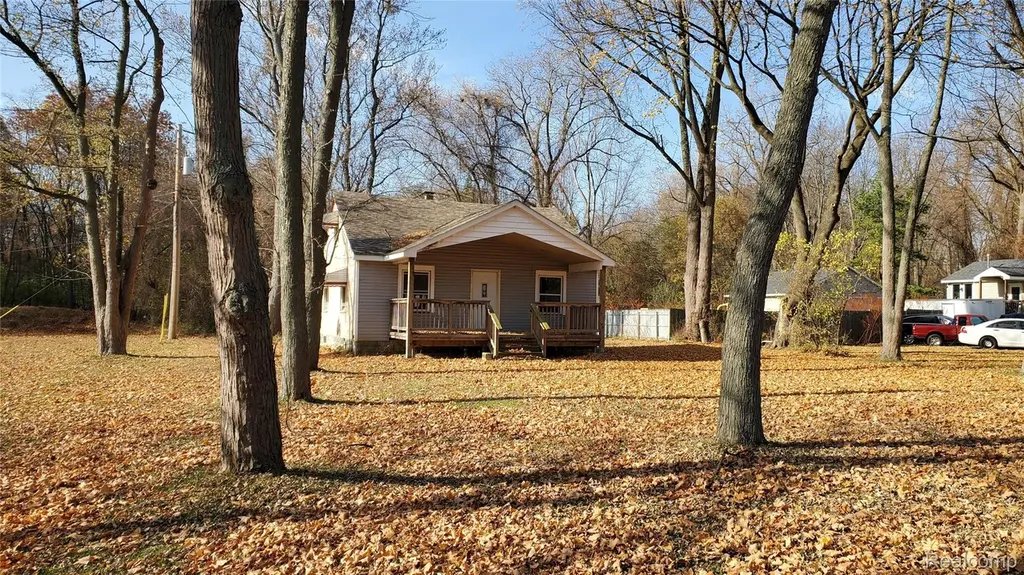
21191 Berg Rd · Southfield, MI
Flood risk 1/10 · Minimal
- FEMA flood zone
- X (unshaded)
- Chance of flooding over 30 yrs
- 0.0%
- Est. flood insurance / yr
- $473 – $860
Fire risk 1/10 · Minimal
- Est. fire insurance / yr
- $784 – $1,456
Heat risk 2/10 · Minimal
- Hot days now (above 98°F)
- 7 days/yr
- Hot days in 30 yrs
- 14 days/yr
Wind risk 2/10 · Minimal
- Chance of severe wind over 30 yrs
- —
Air-quality risk 3/10 · Minor
- Unhealthy air days now
- 2 days/yr
- Unhealthy air days in 30 yrs
- 3 days/yr
Risk factors via First Street. Map © Google.
Why this score? — see what drove the C- grade
The composite is a weighted blend of 9 inputs, each scored 0–100. Each bar is that input's sub-score; the figure is the points it added to the 100-point composite (weight × sub-score).
- Cash flow +18.6/30.0
- ARV discount +10.9/15.0
- 1% rule +6.5/10.0
- DSCR +5.8/10.0
- Livability +3.6/5.0
- Condition / age +2.5/5.0
- Schools +2.4/10.0
- Rent growth +2.0/5.0
- Appreciation +0.0/10.0
$139,000
🖨 Deal sheet 📄 Offer letter ✓ Due diligence
Listing remarks MLS
Amazing country like setting next to much more expensive homes! Seller is willing to finish interior to the new buyers liking upon closing. The seller is willing to finish the interior for the new buyers at an extra cost. There is room for expansion and a garage. There is 1.2 acres of privacy.
Key facts
- 1.2 acres of privacy
- Room for expansion
- 1.2 acre lot
Tags
Neighborhood map
What this means for you Summary
Snapshot
- This is a 3-bed/1.0-bath single-family listed at $139k.
Deal economics
- At list price, monthly cash flow is $134 ($2k/yr) — positive.
- The deal already cash-flows at list — no discount required.
- Meets the 1% rule at list price ($2k rent vs $139k).
- Recommended offer: $122k (12.0% below list) — sets the bar for market timing.
- Cap rate 7.5% vs local median 4.4% in Southfield — top-decile yield for the area; either an underpriced asset or a hidden risk that comps aren't pricing in. Stress-test before assuming the spread holds.
Location & tenants
- Location reads 72/100 on livability (#248 in MI) — a middle-class / working-renter tenant base. Strengths: commute A+, cost of living A+, housing A+; Watch: schools D, health & safety D, crime F.
- Southfield Public School District (urban): math 17% / reading 37% proficiency, ranked #392 of 540 in MI (top 73%) — low school quality limits family demand, transient renter base, plan for 1-2y turnover.
- Market conditions: Rents soft (-2.0%/yr); 80 active listings in the ZIP; 24 comparable units currently listed for rent nearby; rentals at typical pace (median 24d on market — plan ~3-4 weeks tenant-placement turnaround); 42% of comp listings sitting > 30 days — soft ceiling on asking rent; 2,614 units permitted in Oakland County in 2024 (721 in 5+ unit buildings).
- This rent runs 31% of the median local income ($61k/yr) — at the standard rent-burdened threshold; future hikes will face affordability resistance.
Forward outlook
- Local home prices are declining (-3.0%/yr); year-one equity from $961 of loan paydown is wiped out by about $4k of value loss. Plan a longer hold.
- Oakland County population projected at +10% by 2050 — modest demand growth; plan on rents tracking national, not racing it.
Negotiation context
- It's been on market 211 days — a 12% lower offer ($122k) is reasonable based on typical stale-listing flexibility.
- 9 sale attempts since 30y ago; this cycle's ask has dropped $10k (7%) from the opening price — seller is motivated, your offer sets the floor, not the list.
- Current owner paid $95k; 46% above their basis — modest negotiation headroom, anchor on the comps not their cost.
Risks & watch-outs
- Watch-outs: property tax is 2.9% of price; built in 1939 — expect roof / HVAC / electrical / plumbing capex.
Questions for the listing agent
- It's been on market 211 days. Have you received any prior offers? Is the seller open to a 12% concession, seller financing, or rate buy-down credit?
- Built in 1939 — when were the roof, HVAC, electrical panel, plumbing, and water heater last replaced?
- Property tax is high relative to price — has the assessment been appealed recently, and will the sale trigger a re-assessment?
- Why hasn't it sold? Are there any deal-killer items the seller is aware of (foundation, flood, title, zoning, code violations)?
- Is there a deadline driving the sale (1031 exchange, divorce, estate, relocation)? That informs how much negotiation room exists.
- Schools are D-rated, which usually means shorter tenancies and higher turnover. Who's the typical renter profile here, and what's been the actual vacancy rate?
- Crime grade is F in this area — have there been break-ins, vandalism, or insurance claims at this property in the last 3 years? What carrier currently insures it and at what premium?
- What's the average days-on-market for RENTAL listings here right now (not sales)? A rising rental-DOM trend means longer vacancies and softer asking-rent achievability than the comps imply.
- What's the recent tenant-quality profile in this submarket — average credit score on applications, eviction rate, late-payment / NSF rate, and stable-employment percentage? A property-management company in the area should have these aggregated.
- How much new for-sale + rental construction is in the pipeline within 1–3 miles? Heavy new supply typically softens prices + rents 12–24 months out; constrained supply supports both.
Investment metrics
- 1% rule
- 1.15% ✓
- Cap rate
- 7.45%
- Cash-on-cash
- 4.14%
- DSCR
- 1.18
- GRM
- 7.3
CMA / ARV
- ARV (median comp)
- $150,528
- List price
- $139,000
- Delta
- -1.02%
- Verdict
- FAIR
- Comps
- 20 within 1.0 mi
Show comp detail 7 sales within ~0.75 mi
| Address | Dist | Beds/Ba | Sqft | Sold | Price | $/sf | Match |
|---|---|---|---|---|---|---|---|
| 20370 Cherokee St | 0.33mi | 3/1.5 | 1,208 (-5%) | 1mo | $117,000 | $97 | 74 |
| 22893 Golfview Dr | 0.23mi | 4/2.0 (+1) | 1,320 (+4%) | 13mo | $180,000 | $136 | 64 |
| 20348 Berg Rd | 0.33mi | 3/1.5 | 1,136 (-11%) | 6mo | $135,000 | $119 | 59 |
| 21203 Berg Rd | 0.04mi | 4/1.5 (+1) | 1,408 (+10%) | 19mo | $249,000 | $177 | 58 |
| 23625 Millard St | 0.24mi | 3/2.0 | 1,400 (+10%) | 21mo | $135,000 | $96 | 51 |
| 22485 Fairway Dr | 0.65mi | 2/1.0 (-1) | 1,400 (+10%) | 11mo | $190,000 | $136 | 39 |
| 22212 Hessel Ave | 0.53mi | 3/1.5 | 1,093 (-14%) | 14mo | $120,000 | $110 | 38 |
Match score weights: distance 35% · size 25% · config 20% · recency 20%. Top-matched comps best support the ARV.
Projected returns pro-forma
-3.0% appreciation · 0.0% rent growth · sell at horizon
- IRR
- -13.7%
- Equity multiple
- 0.52×
- Total profit
- $-18,512
- Equity at exit
- $20,725
- IRR
- -11.5%
- Equity multiple
- 0.42×
- Total profit
- $-22,642
- Equity at exit
- $12,018
Cash invested: $38,920 (down + closing). Projections, not guarantees.
Landlord ↔ Tenant lean methodology
- Overall (STATE)
- 62 Landlord-Friendly
- State Michigan
- 62 Landlord-Friendly · EVEN
- County
- — inherits STATE
- City
- — inherits STATE
ZIP-level market 48033
- Rents YoY
- -2.0%
- Active inventory
- 80
- Price-to-rent
- 7.3×
Monthly cashflow live
- Estimated rent
- $1,593 high interval (Pro) →
- Mortgage (P&I)
- −$729
- Tax from tax record
- −$338 /mo · $4,052/yr
- Insurance
- −$58
- HOA
- −$0
- Vacancy / Maint / Mgmt
- −$335
- Net cashflow
- $134
Break-even live
UW: 25.0% down · 7.5% · 30yr · 1.5% tax · 5.0% vac · 8.0% maint · 8.0% mgmt
Financing live
Cash to close
- Down payment
- $34,750
- Closing costs
- $4,170
- Reserves months
- —
- Total cash needed
- —
Loan-product check · same deal, 3 products live
Conventional
25% down · 7.5% · 30yr
- Down + closing
- —
- Monthly P&I
- —
- Monthly cashflow
- —
- DSCR
- —
- Eligible?
- —
Personal DTI + credit; lowest rate.
DSCR
20% down · 8.5% · 30yr
- Down + closing
- —
- Monthly P&I
- —
- Monthly cashflow
- —
- DSCR
- —
- Eligible?
- —
No personal income docs; deal must DSCR.
Hard money
10% down · 12.0% · 12mo
- Down + closing
- —
- Monthly P&I
- —
- Monthly cashflow
- —
- DSCR
- —
- Eligible?
- —
Short-term bridge; refi at stabilization.
Rent comps 24 comps
| Address | Beds | Baths | Sqft | Rent | $/sqft | DOM | Units | Dist |
|---|---|---|---|---|---|---|---|---|
| 47129 Wedgewood Southfield, MI | 1.0–2.0 | 1.0–2.0 | 1000 | $1,275 | $1.27 | 43d | 1 | 0.54mi |
| 20555 Lahser Rd Detroit, MI | 1.0–2.0 | 1.0 | 737 | $975 | $1.32 | 43d | 2 | 0.58mi |
| 22419 Fairway Dr Southfield, MI | 3.0 | 1.0 | 1262 | $1,850 | $1.47 | 24d | 1 | 0.62mi |
| 19800 Berg Rd Detroit, MI | 3.0 | 1.0 | 1000 | $1,550 | $1.55 | 16d | 1 | 0.73mi |
| 22649 Frisbee St Detroit, MI | 3.0 | 1.0 | 1100 | $1,495 | $1.36 | 43d | 1 | 0.77mi |
| 22238 Pembroke Ave Detroit, MI | 3.0 | 1.5 | 1100 | $1,500 | $1.36 | 43d | 1 | 0.77mi |
| 19928 Houghton St Detroit, MI | 3.0 | 1.0 | 880 | $1,495 | $1.70 | 10d | 1 | 0.78mi |
| 19501 Redfern St Detroit, MI | 2.0 | 1.5 | 1816 | $1,350 | $0.74 | 43d | 1 | 0.88mi |
| 23275 Riverside Dr Southfield, MI | 2.0–3.0 | 2.0–2.5 | 2088 | $2,362 | $1.13 | 1d | 30 | 0.95mi |
| 20083 Salem St Detroit, MI | 3.0 | 1.0 | 969 | $1,050 | $1.08 | 4d | 1 | 0.98mi |
| 20083 Salem St Detroit, MI | 3.0 | 1.0 | 969 | $1,050 | $1.08 | 10d | 1 | 0.98mi |
| 20410 Five Points St Redford, MI | 3.0 | 1.0 | 950 | $1,600 | $1.68 | 4d | 1 | 0.99mi |
| 21422 Pembroke Ave Detroit, MI | 3.0 | 1.5 | 1000 | $1,695 | $1.70 | 16d | 1 | 1.03mi |
| 23404 Plum Hollow St Southfield, MI | 3.0 | 1.5 | 1050 | $2,000 | $1.90 | 24d | 1 | 1.11mi |
| 25400 Basin St Southfield, MI | 1.0–2.0 | 1.0 | 825 | $1,400 | $1.70 | 4d | 11 | 1.14mi |
| 22570 Seven Mile W Detroit, MI | 2.0 | 1.0 | 890 | $875 | $0.98 | 43d | 1 | 1.17mi |
| 19810 Blackstone St Detroit, MI | 3.0 | 1.0 | 1216 | $1,395 | $1.15 | 43d | 1 | 1.18mi |
| 25740 Shiawassee St Southfield, MI | 1.0–2.0 | 1.0 | 850 | $1,253 | $1.47 | 43d | 10 | 1.22mi |
| 20079 Patton St Detroit, MI | 3.0 | 1.0 | 1150 | $1,550 | $1.35 | 4d | 1 | 1.33mi |
| 21642 Hidden Rivers Dr S #27 Southfield, MI | 3.0 | 2.5 | 1354 | $2,100 | $1.55 | 43d | 1 | 1.42mi |
| 21642 Hidden Rivers Dr N Southfield, MI | 3.0 | 2.5 | 1754 | $1,975 | $1.13 | 2d | 1 | 1.43mi |
| 20284 Melrose St Southfield, MI | 3.0 | 1.0 | 1200 | $1,550 | $1.29 | 43d | 1 | 1.43mi |
| 21727 Hidden Rivers Dr N Southfield, MI | 4.0 | 3.5 | 1850 | $2,300 | $1.24 | 1d | 1 | 1.44mi |
| 19781 Fielding St Detroit, MI | 3.0 | 1.0 | 1000 | $1,294 | $1.29 | 4d | 1 | 1.46mi |
Listing history 39 events
-
2026-06-18days on market $139,000 Active 211 DOM
-
2026-06-17price $139,000 Active 210 DOM
-
2026-06-17days on market $149,000 Active 210 DOM
-
2026-06-16days on market $149,000 Active 209 DOM
-
2026-06-15days on market $149,000 Active 208 DOM
-
2026-06-13days on market $149,000 Active 206 DOM
-
2026-06-13days on market $149,000 Active 205 DOM
-
2026-06-09days on market $149,000 Active 202 DOM
-
2026-06-08days on market $149,000 Active 201 DOM
-
2026-06-07days on market $149,000 Active 200 DOM
-
2026-06-04days on market $149,000 Active 197 DOM
-
2026-06-03days on market $149,000 Active 196 DOM
-
2026-06-02days on market $149,000 Active 195 DOM
-
2026-06-01days on market $149,000 Active 194 DOM
-
2026-05-31days on market $149,000 Active 193 DOM
-
2025-11-19$149,000 Active 294-char remark
Show marketing remark (294 chars)
Amazing country like setting next to much more expensive homes! Seller is willing to finish interior to the new buyers liking upon closing. The seller is willing to finish the interior for the new buyers at an extra cost. There is room for expansion and a garage. There is 1.2 acres of privacy.
-
2022-06-06soldstatus $95,000 Sold
-
2022-06-06soldstatus $95,000 Closed
-
2022-05-09status Pending
-
2022-05-09status Pending
-
2022-05-07$85,000 Active
-
2022-05-07$85,000 Active
-
2022-05-06historical $85,000
-
2022-05-06historical $85,000
-
2016-02-10soldstatus $27,100 Sold
-
2016-02-10soldstatus $27,100
-
2016-01-22status Pending
-
2016-01-22historical
-
2016-01-07$29,900 Active
-
2016-01-07$29,900
-
1997-07-18soldstatus $62,000
-
1997-07-18soldstatus $30,000
-
1997-06-30soldstatus $62,000
-
1997-05-15$65,000
-
1997-05-14historical
-
1997-03-14$66,900
-
1997-03-14historical
-
1996-12-14$69,900
ⓘ Source: listings_history table (triggers on properties + properties_extension) + one-shot
backfill from property_details.listing_events for pre-trigger history.
Tax reassessment forecast MI · Partial reset (capped growth)
- Current annual tax
- $4,052 · $338/mo
- Projected year-2 tax
- $4,052 · $338/mo
- Expected delta
- $0/yr ($0/mo · 0.0%)
ⓘ Screening estimate from a state-policy table — verify with the county assessor before closing.
Climate risk First Street
- Flood 1/10 Low FEMA zone X (unshaded) · 0% chance over 30 yrs
- Wildfire 1/10 Low
- Heat 2/10 Low 7 d/yr ≥98°F today · 14 d/yr by 30 yrs out
- Wind 2/10 Low
- Air quality 3/10 Moderate 2 unhealthy d/yr today · 3 by 30 yrs out
Nearby sold comps map
Loading sold comps map…
Walkable amenities ~0.75 mi
Loading nearby amenities…
Taxation est. · year 1
- Rental income
- $19,122
- − Mortgage interest
- −$7,786
- − Property taxes
- −$4,052
- − Insurance
- −$695
- − Repairs & maintenance
- −$1,530
- − Management
- −$1,530
- − Depreciation
- −$4,044
- Taxable loss
- −$514
- Est. tax savings @ 24.0%
- +$123
- After-tax cash flow
- $1,736/yr
For passive investors: Depreciation is non-cash, so a rental often shows a tax loss while cash-flowing — sheltering income. Rental losses are passive: they offset passive income freely, and up to $25,000/yr can offset ordinary (W-2) income if you actively participate and your MAGI is under $100k (phasing out to $0 by $150k); unused losses carry forward. On sale, claimed depreciation is recaptured at up to 25%, and gains may owe capital-gains tax (a 1031 exchange can defer both). Figures are a year-1 estimate at your 24.0% rate — not tax advice; consult a CPA.
Schools (NCES district)
- District
- Southfield Public School District
- NCES district ID
- 2632310
- Math proficiency
- 17% ▼ -3.00%
- Reading proficiency
- 37% ▲ 1.00%
- Median HH income
- $51,400
- Composite
- 23.77/100
- National rank
- #7814
- State rank
- #392 of 540 in MI
Livability — Southfield
- Score
- 72/100
- State rank
- #248
- US rank
- #6175
Category grades
Schools grade is shown separately in the Schools card above.
Census & demographics
- Census place
- Southfield, MI
- County
- Oakland County · 1,009,092 people
- City population
- 54,914
- Metro
- Detroit-Warren-Dearborn, MI
- Population (ZIP)
- 17,277
- Household income
- $61,016
- Rent vs Own
- Severe rent burden
- 1166.0
Population outlook (Oakland County) Hauer SSP2
- Today (2025)
- 1,335,747 people
- By 2030
- 1,375,100 · +2.9%
- By 2040
- 1,435,385 · +7.5%
- By 2050
- 1,469,250 · +10.0%
- By 2075
- 1,531,946 · +14.7%
- By 2100
- 1,450,485 · +8.6%
Race, ethnicity, and origin ACS 2023
- Neighborhood character
- Predominantly Black (68%)
- Race & ethnicity
- Black 68% White 24% Two or more races 6% Asian 2% Hispanic / Latino 1%
- Common ancestry
- Romanian 3% Scotch-Irish 1% Slovak 1%
- Foreign-born
- 6% · Canada
- Languages at home
- 92% English-only · Spanish 1% Arabic 1% Russian/Polish/Slavic 1%
Political lean MEDSL · Oakland
- 2024 margin
- D (+10.6) · D 54.4% · R 43.8% · Other 1.9%
- 2008→2024 swing
- -3.9pp toward R · 2008: 14.5pp · 2024: 10.6pp
- All cycles
- 2024: D+10.6 2020: D+14.1 2016: D+8.1 2012: D+8.1 2008: D+14.5
Not yet ingested
- Civics
- —
Market trends
- HPI YoY
- ▼ -175.44%
- Current HPI
- 187.5011
- Rent YoY
- ▼ -1.96%
- Metro
- Detroit-Warren-Dearborn, MI
- State GDP YoY
- ▲ 1.37%
- F500 in state
- 28
Industry mix (Fortune 500 HQ in MI)
| Industry | F500 HQs | Revenue |
|---|---|---|
| Automotive Parts | 3 | $48B |
|
||
| Automotive | 2 | $372B |
|
||
| Chemicals | 1 | $45B |
|
||
| Automotive Retail | 1 | $29B |
|
||
| Healthcare / Medical Devices | 1 | $23B |
|
||
| Automotive Technology | 1 | $20B |
|
||
Price history
+113.2% since first listed24 events — show timeline
- 2025-11-19 Listed $149,000 REALCOMP
- 2025-11-19 Listed $149,000 MiRealSource-MiMLS
- 2022-06-06 Sold (MLS) $95,000 MiRealSource-MiMLS
- 2022-06-06 Sold (MLS) $95,000 REALCOMP
- 2022-05-09 Pending — MiRealSource-MiMLS
- 2022-05-09 Pending — REALCOMP
- 2022-05-07 Listed $85,000 MiRealSource-MiMLS
- 2022-05-07 Listed $85,000 REALCOMP
- 2022-05-06 Coming Soon $85,000 MiRealSource-MiMLS
- 2022-05-06 Coming Soon $85,000 REALCOMP
- 2016-02-10 Sold (MLS) $27,100 MiRealSource-MiMLS
- 2016-02-10 Sold (MLS) $27,100 REALCOMP
- 2016-01-22 Pending — REALCOMP
- 2016-01-22 Listing Removed — MiRealSource-MiMLS
- 2016-01-07 Listed $29,900 REALCOMP
- 2016-01-07 Listed $29,900 MiRealSource-MiMLS
- 1997-07-18 Sold (Public Records) $30,000 Public Records
- 1997-07-18 Sold (Public Records) $62,000 Public Records
- 1997-06-30 Sold (MLS) $62,000 REALCOMP
- 1997-05-15 Listed $65,000 REALCOMP
- 1997-05-14 Listing Removed — REALCOMP
- 1997-03-14 Listing Removed — REALCOMP
- 1997-03-14 Listed $66,900 REALCOMP
- 1996-12-14 Listed $69,900 REALCOMP
Property tax history
+9.2%/yrLatest (2025): $4,052 · -17.4% YoY. Source: county tax records.
Cash-flow waterfall
monthlySold comps — $/sqft
last 12 mo · ≤1 miLoading sold comps…