682 Route 365 · Cold Brook, NY
Flood risk 1/10 · Minimal
- FEMA flood zone
- X
- Chance of flooding over 30 yrs
- 0.0%
- Est. flood insurance / yr
- $473 – $860
Fire risk 3/10 · Minor
- Est. fire insurance / yr
- $691 – $1,283
Heat risk 1/10 · Minimal
- Hot days now (above 89°F)
- 7 days/yr
- Hot days in 30 yrs
- 16 days/yr
Wind risk 1/10 · Minimal
- Chance of severe wind over 30 yrs
- 0.0%
Air-quality risk 1/10 · Minimal
- Unhealthy air days now
- 0 days/yr
- Unhealthy air days in 30 yrs
- 0 days/yr
Risk factors via First Street. Map © Google.
Why this score? — see what drove the D+ grade
The composite is a weighted blend of 9 inputs, each scored 0–100. Each bar is that input's sub-score; the figure is the points it added to the 100-point composite (weight × sub-score).
- Cash flow +10.9/30.0
- Appreciation +10.0/10.0
- ARV discount +7.5/15.0
- Schools +5.1/10.0
- Condition / age +3.8/5.0
- 1% rule +3.2/10.0
- DSCR +3.2/10.0
- Livability +2.8/5.0
- Rent growth +2.5/5.0
$160,000
🖨 Deal sheet 📄 Offer letter ✓ Due diligence
Listing remarks MLS
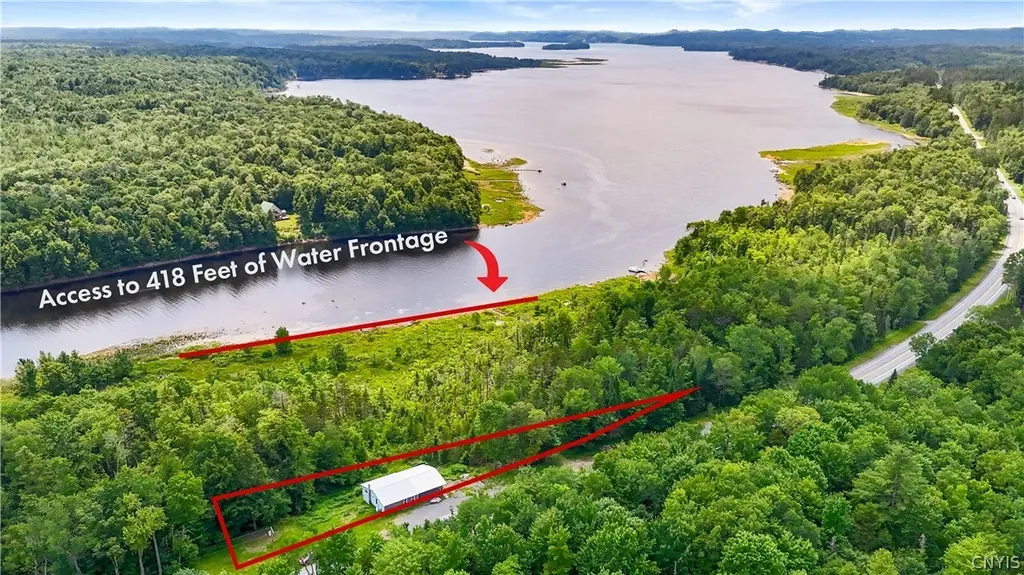
Perched above Hinckley Reservoir with scenic views, this property is a rare opportunity to create your own retreat. A blueline water feature adds natural charm and a peaceful, seasonal waterfront setting. Offering one-level living with 2 full baths, a spacious living room, and an eat-in kitchen, the home is already underway with renovations—giving you a valuable head start. Potential for improved access to the water (subject to approvals) adds to the upside. Ideal for investors or buyers looking to customize and build value in a beautiful location.
Key facts
- One-level living
- Eat-in kitchen
- Scenic views
Tags
Neighborhood map
What this means for you Summary
Snapshot
- This is a 4-bed/2.0-bath single-family listed at $160k. Condition is rated good.
Deal economics
- At list price, monthly cash flow is $-70 ($-844/yr) — negative.
- To cash-flow at today's rent, offer at most $150k (6.4% below list).
- To meet the 1% rule (rent ≥ 1% of price), the offer needs to be $131k (18.1% below list).
- Recommended offer: $131k (18.1% below list) — sets the bar for 1% rule.
Location & tenants
- Location reads 56/100 on livability (#1,123 in NY) — a working-class tenant base; expect higher turnover. Strengths: cost of living A+, housing A+; Watch: health & safety C-, schools F, crime F.
- Poland Central School District (rural): math 63% / reading 58% proficiency, ranked #240 of 590 in NY (top 41%) — acceptable for families but not a draw, mixed tenant base, ~2y average lease.
- Market conditions: 36 active listings in the ZIP; 54 units permitted in Herkimer County in 2024 (0 in 5+ unit buildings).
Forward outlook
- In year one you build about $17k of equity ($1k loan paydown + $16k appreciation (10.0% local appreciation)).
- Herkimer County population projected at -24% by 2050 — secular population decline; favor cash flow + early exit over multi-decade hold.
- At projected returns (10.0% appreciation + 3.0% rent growth), your $45k cash investment doubles in ~3 years — after that, you're playing with house money.
- By year 3, paydown + projected appreciation supports a ~$43k cash-out refi (75% LTV) — recoverable capital for the next deal without selling this one.
Negotiation context
- It's been on market 58 days — a 3% lower offer ($155k) is reasonable based on typical stale-listing flexibility.
Risks & watch-outs
- Watch-outs: built in 1900 — expect roof / HVAC / electrical / plumbing capex.
Questions for the listing agent
- What do current leases actually rent for vs. the listed asking? Can we see a recent rent roll and the last 12 months of T-12 income?
- It's been on market 58 days. Have you received any prior offers? Is the seller open to a 18% concession, seller financing, or rate buy-down credit?
- Built in 1900 — when were the roof, HVAC, electrical panel, plumbing, and water heater last replaced?
- Is there a deadline driving the sale (1031 exchange, divorce, estate, relocation)? That informs how much negotiation room exists.
- Schools are F-rated, which usually means shorter tenancies and higher turnover. Who's the typical renter profile here, and what's been the actual vacancy rate?
- Crime grade is F in this area — have there been break-ins, vandalism, or insurance claims at this property in the last 3 years? What carrier currently insures it and at what premium?
- The area grade is low — what's the realistic commute time and amenity access for the typical tenant pool here? Any planned neighborhood developments (good or bad) we should know about?
- What's the average days-on-market for RENTAL listings here right now (not sales)? A rising rental-DOM trend means longer vacancies and softer asking-rent achievability than the comps imply.
- What's the recent tenant-quality profile in this submarket — average credit score on applications, eviction rate, late-payment / NSF rate, and stable-employment percentage? A property-management company in the area should have these aggregated.
- How much new for-sale + rental construction is in the pipeline within 1–3 miles? Heavy new supply typically softens prices + rents 12–24 months out; constrained supply supports both.
Investment metrics
- 1% rule
- 0.82% ✗
- Cap rate
- 5.77%
- Cash-on-cash
- -1.88%
- DSCR
- 0.92
- GRM
- 10.2
CMA / ARV
- ARV (median comp)
- $780,132
- List price
- $160,000
- Delta
- -79.49%
- Verdict
- UNDERPRICED
- Comps
- 2 within 1.0 mi
Projected returns pro-forma
10.0% appreciation · 3.0% rent growth · sell at horizon
- IRR
- 22.9%
- Equity multiple
- 2.85×
- Total profit
- $82,682
- Equity at exit
- $144,141
- IRR
- 20.5%
- Equity multiple
- 6.51×
- Total profit
- $247,047
- Equity at exit
- $310,845
Cash invested: $44,800 (down + closing). Projections, not guarantees.
Landlord ↔ Tenant lean methodology
- Overall (STATE)
- 15 Strongly Tenant-Friendly
- State New York
- 15 Strongly Tenant-Friendly · D+10
- County
- — inherits STATE
- City
- — inherits STATE
ZIP-level market 13438
- Home prices YoY
- 10.1%
- Active inventory
- 36
- Price-to-rent
- 10.2×
Monthly cashflow live
- Estimated rent
- $1,311 medium interval (Pro) →
- Mortgage (P&I)
- −$839
- Tax est. 1.5%
- −$200 /mo · $2,400/yr
- Insurance
- −$67
- HOA
- −$0
- Vacancy / Maint / Mgmt
- −$275
- Net cashflow
- $-70
Break-even live
UW: 25.0% down · 7.5% · 30yr · 1.5% tax · 5.0% vac · 8.0% maint · 8.0% mgmt
Financing live
Cash to close
- Down payment
- $40,000
- Closing costs
- $4,800
- Reserves months
- —
- Total cash needed
- —
Loan-product check · same deal, 3 products live
Conventional
25% down · 7.5% · 30yr
- Down + closing
- —
- Monthly P&I
- —
- Monthly cashflow
- —
- DSCR
- —
- Eligible?
- —
Personal DTI + credit; lowest rate.
DSCR
20% down · 8.5% · 30yr
- Down + closing
- —
- Monthly P&I
- —
- Monthly cashflow
- —
- DSCR
- —
- Eligible?
- —
No personal income docs; deal must DSCR.
Hard money
10% down · 12.0% · 12mo
- Down + closing
- —
- Monthly P&I
- —
- Monthly cashflow
- —
- DSCR
- —
- Eligible?
- —
Short-term bridge; refi at stabilization.
Listing history 18 events
-
2026-06-19days on market $160,000 Active 58 DOM
-
2026-06-18days on market $160,000 Active 57 DOM
-
2026-06-17days on market $160,000 Active 56 DOM
-
2026-06-16days on market $160,000 Active 55 DOM
-
2026-06-15days on market $160,000 Active 54 DOM
-
2026-06-14days on market $160,000 Active 52 DOM
-
2026-06-13days on market $160,000 Active 51 DOM
-
2026-06-10days on market $160,000 Active 49 DOM
-
2026-06-09days on market $160,000 Active 48 DOM
-
2026-06-08days on market $160,000 Active 47 DOM
-
2026-06-07days on market $160,000 Active 46 DOM
-
2026-06-05days on market $160,000 Active 43 DOM
-
2026-06-03days on market $160,000 Active 42 DOM
-
2026-06-02days on market $160,000 Active 41 DOM
-
2026-06-01days on market $160,000 Active 40 DOM
-
2026-05-31days on market $160,000 Active 39 DOM
-
2026-05-30days on market $160,000 Active 38 DOM
-
2026-04-21$160,000 Active 560-char remark
Show marketing remark (560 chars)
Perched above Hinckley Reservoir with scenic views, this property is a rare opportunity to create your own retreat. A blueline water feature adds natural charm and a peaceful, seasonal waterfront setting. Offering one-level living with 2 full baths, a spacious living room, and an eat-in kitchen, the home is already underway with renovations—giving you a valuable head start. Potential for improved access to the water (subject to approvals) adds to the upside. Ideal for investors or buyers looking to customize and build value in a beautiful location.
ⓘ Source: listings_history table (triggers on properties + properties_extension) + one-shot
backfill from property_details.listing_events for pre-trigger history.
Climate risk First Street
- Flood 1/10 Low FEMA zone X · 0% chance over 30 yrs
- Wildfire 3/10 Moderate
- Heat 1/10 Low 7 d/yr ≥89°F today · 16 d/yr by 30 yrs out
- Wind 1/10 Low 0% chance of damaging wind over 30 yrs
- Air quality 1/10 Low 0 unhealthy d/yr today · 0 by 30 yrs out
Nearby sold comps map
Loading sold comps map…
Walkable amenities ~0.75 mi
Loading nearby amenities…
Taxation est. · year 1
- Rental income
- $15,728
- − Mortgage interest
- −$8,962
- − Property taxes
- −$2,400
- − Insurance
- −$800
- − Repairs & maintenance
- −$1,258
- − Management
- −$1,258
- − Depreciation
- −$4,655
- Taxable loss
- −$3,606
- Est. tax savings @ 24.0%
- +$865
- After-tax cash flow
- $22/yr
For passive investors: Depreciation is non-cash, so a rental often shows a tax loss while cash-flowing — sheltering income. Rental losses are passive: they offset passive income freely, and up to $25,000/yr can offset ordinary (W-2) income if you actively participate and your MAGI is under $100k (phasing out to $0 by $150k); unused losses carry forward. On sale, claimed depreciation is recaptured at up to 25%, and gains may owe capital-gains tax (a 1031 exchange can defer both). Figures are a year-1 estimate at your 24.0% rate — not tax advice; consult a CPA.
Condition & rehab AI · 2 photos
This single-family home is in good condition with cosmetic updates, offering a scenic waterfront location and potential for improved access. Ideal for investors looking to capitalize on its unique setting.
Value-add opportunities
- Both Landscaping improvements — Enhances curb appeal and adds value
- Both Waterfront access improvements — Subject to approvals, could significantly increase property value
Renovation cost estimate screening
Value-add ROI direction
- Both Landscaping improvements — Enhances curb appeal and adds value ↑
- Both Waterfront access improvements — Subject to approvals, could significantly increase property value ↑
ⓘ Cost ranges are severity-bucket heuristics (US national rule-of-thumb). Get contractor quotes + a written scope before underwriting a rehab budget.
Schools (NCES district)
- District
- Poland Central School District
- NCES district ID
- 3623370
- Math proficiency
- 63% ▲ 15.00%
- Reading proficiency
- 58% ▲ 17.00%
- Median HH income
- $47,888
- Composite
- 51.32/100
- National rank
- #1742
- State rank
- #240 of 590 in NY
Livability — Cold Brook
- Score
- 56/100
- State rank
- #1123
- US rank
- #23080
Category grades
Schools grade is shown separately in the Schools card above.
Census & demographics
- Population (ZIP)
- 3,310
Population outlook (Herkimer County) Hauer SSP2
- Today (2025)
- 59,340 people
- By 2030
- 56,838 · -4.2%
- By 2040
- 51,098 · -13.9%
- By 2050
- 45,080 · -24.0%
- By 2075
- 32,648 · -45.0%
- By 2100
- 22,266 · -62.5%
Race, ethnicity, and origin ACS 2023
- Neighborhood character
- Predominantly White (95%)
- Race & ethnicity
- White 95% Hispanic / Latino 2% Two or more races 2%
- Common ancestry
- Romanian 12% Lithuanian 5% Slovak 3%
- Foreign-born
- 1% · Canada
- Languages at home
- 98% English-only · Spanish 1%
Political lean MEDSL · Herkimer
- 2024 margin
- Solid R (+36.4) · D 31.8% · R 68.2%
- 2008→2024 swing
- -27.1pp toward R · 2008: -9.3pp · 2024: -36.4pp
- All cycles
- 2024: R+36.4 2020: R+30.5 2016: R+34.5 2012: R+8.4 2008: R+9.3
Not yet ingested
- Civics
- —
Market trends
- HPI YoY
- ▲ 33.60%
- Current HPI
- 368.1042
- Rent YoY
- —
- Metro
- —
- State GDP YoY
- ▲ 2.60%
- F500 in state
- 92
Industry mix (Fortune 500 HQ in NY)
| Industry | F500 HQs | Revenue |
|---|---|---|
| Financial Services | 10 | $950B |
|
||
| Consumer Goods | 9 | $162B |
|
||
| Insurance | 4 | $225B |
|
||
| Telecommunications | 2 | $144B |
|
||
| Pharmaceuticals | 2 | $112B |
|
||
| Media / Entertainment | 2 | $69B |
|
||
Price history
1 event — show timeline
- 2026-04-21 Listed $160,000 CNYIS
Cash-flow waterfall
monthlySold comps — $/sqft
last 12 mo · ≤1 miLoading sold comps…