 Duplex
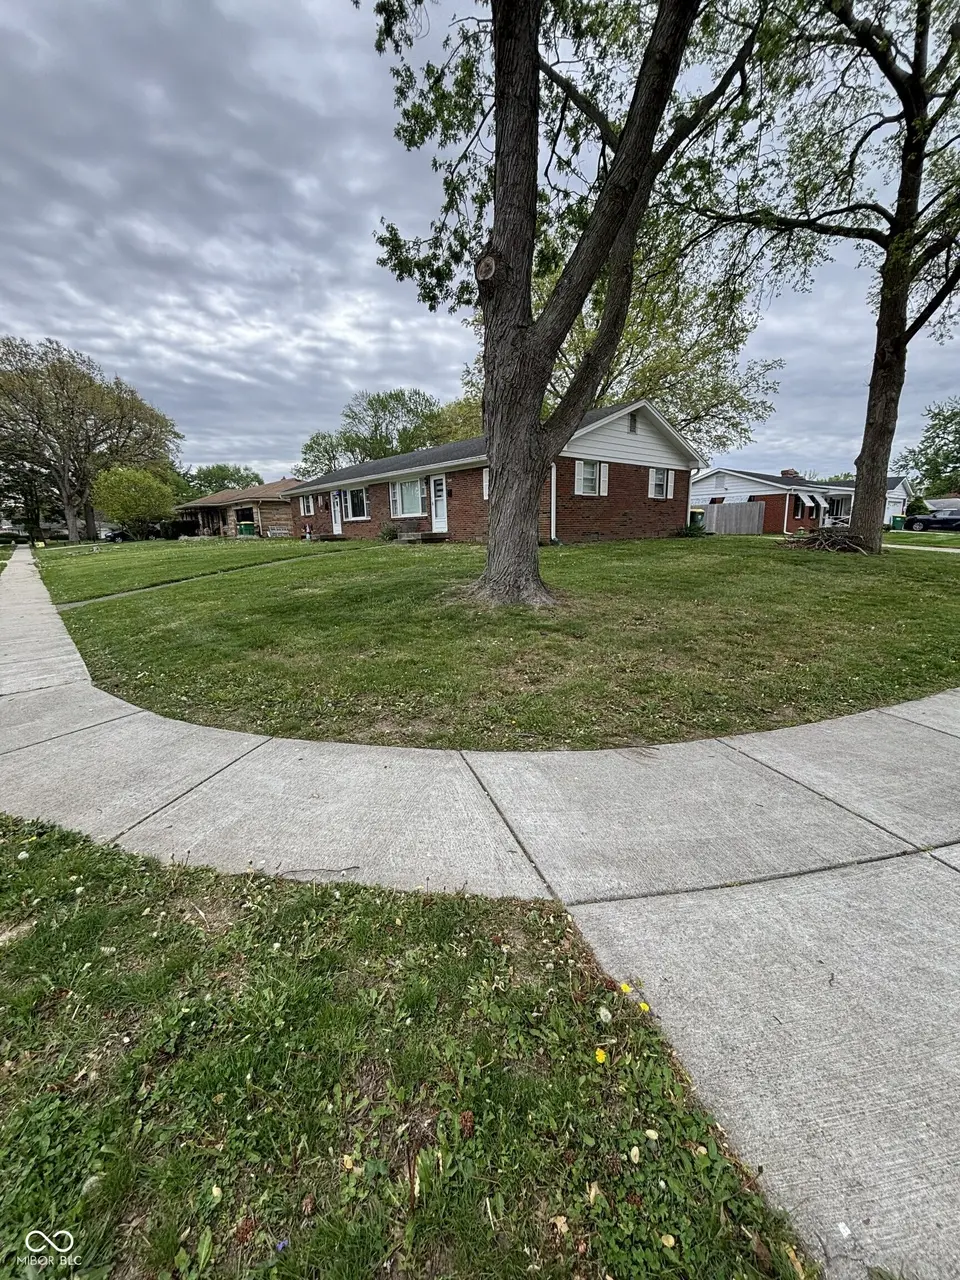
5847 - 5849 Buick Dr · Speedway, IN
Flood risk 1/10 · Minimal
- FEMA flood zone
- X (unshaded)
- Chance of flooding over 30 yrs
- 0.0%
- Est. flood insurance / yr
- $507 – $1,088
Fire risk 1/10 · Minimal
- Est. fire insurance / yr
- $717 – $1,331
Heat risk 3/10 · Minor
- Hot days now (above 101°F)
- 7 days/yr
- Hot days in 30 yrs
- 19 days/yr
Wind risk 2/10 · Minimal
- Chance of severe wind over 30 yrs
- 0.0%
Air-quality risk 4/10 · Minor
- Unhealthy air days now
- 4 days/yr
- Unhealthy air days in 30 yrs
- 5 days/yr
Risk factors via First Street. Map © Google.
Why this score? — see what drove the F grade
The composite is a weighted blend of 9 inputs, each scored 0–100. Each bar is that input's sub-score; the figure is the points it added to the 100-point composite (weight × sub-score).
- Cash flow +8.5/30.0
- ARV discount +7.5/15.0
- Schools +4.6/10.0
- Livability +3.8/5.0
- 1% rule +2.7/10.0
- Rent growth +2.7/5.0
- Condition / age +2.5/5.0
- DSCR +2.3/10.0
- Appreciation +0.0/10.0
$263,500
🖨 Deal sheet 📄 Offer letter ✓ Due diligence
Multi-family units
County records classify this as Multi-Family (2-4 Unit). Listing-text estimate: 2 units. confirmed
Listing remarks
Prime Investment Opportunity! Discover the potential at 5847 Buick DR. A charming duplex built in 1960. This property offers a unique opportunity to cultivate a personalized living experience within a generous lot spanning 10,498 square feet. This single-story duplex provides a versatile canvas for comfortable living, presenting distinct opportunities for homeowners and investors alike. Envision the possibilities this sizable 10,498 square foot lot offers, from creating vibrant outdoor entertaining spaces to cultivating a serene personal garden. Embrace the chance to craft your ideal lifestyle in this inviting duplex, where every detail can be tailored to your vision.
Key facts
- Generous lot
- Personal garden
- Sizable lot
Tags
Property features AI
Finance
- Other: Lot approximately 0.24 acres
- Financial info: Two units total; Gross annual income reported at $21,600; Expenses reported at $6,212; Each unit listed with monthly rent of $900
Exterior
- Utilities: Solid waste service not indicated
- Home design: Duplex (residential income); One story
- Construction: Brick construction
- Exterior features: Attached property; Residential use; Access road
Interior
- Kitchen: Each unit includes a kitchen
- Bedrooms: Two 2-bedroom units
- Heating & cooling: Natural gas heating; Central air conditioning
- Interior features: Natural gas heating; Central air conditioning
Neighborhood map
What this means for you Summary
Snapshot
- This is a 2 × 2-bed/2.0-bath units multifamily listed at $264k.
Deal economics
- At list price, monthly cash flow is $-233 ($-3k/yr) — negative. Per door: $-117/mo.
- To cash-flow at today's rent, offer at most $222k (15.6% below list).
- To meet the 1% rule (rent ≥ 1% of price), the offer needs to be $204k (22.5% below list).
- Recommended offer: $204k (22.5% below list) — sets the bar for 1% rule.
- Cap rate 5.2% vs local median 4.2% in Speedway — meaningfully above typical; check what's discounted (condition, days-on-market, listing class) to confirm the premium yield is real.
Location & tenants
- Location reads 76/100 on livability (#47 in IN, #3,342 nationally) — a middle-class / working-renter tenant base. Strengths: cost of living A+, housing A+, schools B+; Watch: amenities D+, employment D, commute F.
- School Town Of Speedway (suburban): math 53% / reading 56% proficiency, ranked #36 of 301 in IN (top 12%) — acceptable for families but not a draw, mixed tenant base, ~2y average lease.
- Market conditions: Rents flat; 61 active listings in the ZIP; 11 comparable units currently listed for rent nearby; rentals at typical pace (median 24d on market — plan ~3-4 weeks tenant-placement turnaround); 1,906 units permitted in Marion County in 2024 (621 in 5+ unit buildings).
- This rent runs 44% of the median local income ($56k/yr) — at the standard rent-burdened threshold; future hikes will face affordability resistance.
Forward outlook
- Local home prices are declining (-3.0%/yr); year-one equity from $2k of loan paydown is wiped out by about $8k of value loss. Plan a longer hold.
- Marion County population projected at +18% by 2050 — long-run rental-demand tailwind backs the buy-and-hold thesis.
Negotiation context
- Only 9 days on market — expect competitive offers; lowballing is unlikely to land.
Questions for the listing agent
- What do current leases actually rent for vs. the listed asking? Can we see a recent rent roll and the last 12 months of T-12 income?
- Can we see the unit-by-unit rent roll, current vacancy, and any below-market leases? What's the average tenancy length?
- What capital expenditures (roof, boiler, parking lot, exteriors) have been made in the last 5 years, and what's planned in the next 2?
- Built in 1960 — when were the roof, HVAC, electrical panel, plumbing, and water heater last replaced?
- Is there a deadline driving the sale (1031 exchange, divorce, estate, relocation)? That informs how much negotiation room exists.
- Schools are B-rated — typically a magnet for longer-tenancy family renters. What's the average tenant stay here, and is there a school-zone premium baked into asking?
- The area grade is low — what's the realistic commute time and amenity access for the typical tenant pool here? Any planned neighborhood developments (good or bad) we should know about?
- What's the average days-on-market for RENTAL listings here right now (not sales)? A rising rental-DOM trend means longer vacancies and softer asking-rent achievability than the comps imply.
- What's the recent tenant-quality profile in this submarket — average credit score on applications, eviction rate, late-payment / NSF rate, and stable-employment percentage? A property-management company in the area should have these aggregated.
- How much new apartment / multifamily construction is in the pipeline within 1–3 miles? Heavy new supply (>2% of stock underway) typically softens rents 12–24 months out; light construction supports rent growth.
Investment metrics
- 1% rule
- 0.77% ✗
- Cap rate
- 5.23%
- Cash-on-cash
- -3.79%
- DSCR
- 0.83
- GRM
- 10.8
CMA / ARV
No comps found within radius.
Projected returns pro-forma
-3.0% appreciation · 0.79% rent growth · sell at horizon
- IRR
- -25.2%
- Equity multiple
- 0.16×
- Total profit
- $-61,939
- Equity at exit
- $39,289
- IRR
- -29.8%
- Equity multiple
- -0.22×
- Total profit
- $-90,297
- Equity at exit
- $22,783
Cash invested: $73,780 (down + closing). Projections, not guarantees.
Landlord ↔ Tenant lean methodology
- Overall (STATE)
- 90 Strongly Landlord-Friendly
- State Indiana
- 90 Strongly Landlord-Friendly · R+11
- County
- — inherits STATE
- City
- — inherits STATE
ZIP-level market 46224
- Rents YoY
- 0.8%
- Active inventory
- 61
- Price-to-rent
- 21.5×
Monthly cashflow live
- Estimated rent
- $2,041 medium interval (Pro) →
- Mortgage (P&I)
- −$1,382
- Tax from tax record
- −$354 /mo · $4,246/yr
- Insurance
- −$110
- HOA
- −$0
- Vacancy / Maint / Mgmt
- −$429
- Net cashflow
- $-233
Break-even live
2-unit breakdown (identical units grouped — click to expand)
| Units | Beds | Baths | Est. rent |
|---|---|---|---|
| 2× units | 2 | 2 | $2,042 |
| #1 | 2 | 2 | $1,021 |
| #2 | 2 | 2 | $1,021 |
| Total (2 units) | $2,041 | ||
UW: 25.0% down · 7.5% · 30yr · 1.5% tax · 5.0% vac · 8.0% maint · 8.0% mgmt
Financing live
Cash to close
- Down payment
- $65,875
- Closing costs
- $7,905
- Reserves months
- —
- Total cash needed
- —
Loan-product check · same deal, 3 products live
Conventional
25% down · 7.5% · 30yr
- Down + closing
- —
- Monthly P&I
- —
- Monthly cashflow
- —
- DSCR
- —
- Eligible?
- —
Personal DTI + credit; lowest rate.
DSCR
20% down · 8.5% · 30yr
- Down + closing
- —
- Monthly P&I
- —
- Monthly cashflow
- —
- DSCR
- —
- Eligible?
- —
No personal income docs; deal must DSCR.
Hard money
10% down · 12.0% · 12mo
- Down + closing
- —
- Monthly P&I
- —
- Monthly cashflow
- —
- DSCR
- —
- Eligible?
- —
Short-term bridge; refi at stabilization.
Rent comps 11 comps
| Address | Beds | Baths | Sqft | Rent | $/sqft | DOM | Units | Dist |
|---|---|---|---|---|---|---|---|---|
| 2030 Runaway Bay Dr Indianapolis, IN | 1.0–3.0 | 1.0–2.0 | 1121 | $1,630 | $1.45 | 2d | 21 | 0.35mi |
| 5831 W 25th St Unit 1 Indianapolis, IN | 1.0 | 1.0 | 1000 | $1,190 | $1.19 | 23d | 1 | 0.79mi |
| 5911 W 25th St Apt 06 Indianapolis, IN | 1.0 | 1.0 | 600 | $849 | $1.42 | 7d | 1 | 0.80mi |
| 5911 W 25th St Indianapolis, IN | 1.0 | 1.0 | 600 | $849 | $1.42 | 16d | 1 | 0.80mi |
| 5921 W 25th St Apt 03 Indianapolis, IN | 1.0 | 1.0 | 600 | $849 | $1.42 | 23d | 1 | 0.80mi |
| 6011 W 25th St Unit 4 Indianapolis, IN | 2.0 | 1.0 | 1083 | $1,050 | $0.97 | 23d | 1 | 0.81mi |
| 6010 W 25th St Indianapolis, IN | 1.0–2.0 | 1.0–1.5 | 878 | $1,250 | $1.42 | 2d | 18 | 0.87mi |
| 6038 W 25th St Indianapolis, IN | 1.0 | 1.0 | 575 | $900 | $1.57 | 23d | 1 | 0.88mi |
| 1545 N Main St Speedway, IN | 1.0–2.0 | 1.0–2.0 | 891 | $1,972 | $2.21 | 7d | 9 | 1.15mi |
| 6436 Lupine Dr Indianapolis, IN | 2.0 | 1.0 | 966 | $950 | $0.98 | 23d | 1 | 1.47mi |
| 6458 Lupine Dr Indianapolis, IN | 2.0 | 1.0 | 966 | $950 | $0.98 | 23d | 1 | 1.49mi |
Listing history 2 events
-
2026-05-02status Pending
-
2026-04-21$263,500 Active
ⓘ Source: listings_history table (triggers on properties + properties_extension) + one-shot
backfill from property_details.listing_events for pre-trigger history.
Tax reassessment forecast IN · Partial reset (capped growth)
- Current annual tax
- $4,246 · $354/mo
- Projected year-2 tax
- $4,246 · $354/mo
- Expected delta
- $0/yr ($0/mo · 0.0%)
ⓘ Screening estimate from a state-policy table — verify with the county assessor before closing.
Climate risk First Street
- Flood 1/10 Low FEMA zone X (unshaded) · 0% chance over 30 yrs
- Wildfire 1/10 Low
- Heat 3/10 Moderate 7 d/yr ≥101°F today · 19 d/yr by 30 yrs out
- Wind 2/10 Low 0% chance of damaging wind over 30 yrs
- Air quality 4/10 Moderate 4 unhealthy d/yr today · 5 by 30 yrs out
Nearby sold comps map
Loading sold comps map…
Walkable amenities ~0.75 mi
Loading nearby amenities…
Taxation est. · year 1
- Rental income
- $24,492
- − Mortgage interest
- −$14,760
- − Property taxes
- −$4,246
- − Insurance
- −$1,318
- − Repairs & maintenance
- −$1,959
- − Management
- −$1,959
- − Depreciation
- −$7,665
- Taxable loss
- −$7,416
- Est. tax savings @ 24.0%
- +$1,780
- After-tax cash flow
- $-1,017/yr
For passive investors: Depreciation is non-cash, so a rental often shows a tax loss while cash-flowing — sheltering income. Rental losses are passive: they offset passive income freely, and up to $25,000/yr can offset ordinary (W-2) income if you actively participate and your MAGI is under $100k (phasing out to $0 by $150k); unused losses carry forward. On sale, claimed depreciation is recaptured at up to 25%, and gains may owe capital-gains tax (a 1031 exchange can defer both). Figures are a year-1 estimate at your 24.0% rate — not tax advice; consult a CPA.
Schools (NCES district)
- District
- School Town Of Speedway
- NCES district ID
- 1810920
- Math proficiency
- 53% ▼ -10.00%
- Reading proficiency
- 56% ▼ -4.00%
- Median HH income
- $39,982
- Composite
- 45.55/100
- National rank
- #2601
- State rank
- #36 of 301 in IN
Livability — Speedway
- Score
- 76/100
- State rank
- #47
- US rank
- #3342
Category grades
Schools grade is shown separately in the Schools card above.
Census & demographics
- Census place
- Speedway, IN
- County
- Marion County · 998,460 people
- City population
- 40,228
- Metro
- Indianapolis-Carmel-Anderson, IN
- Population (ZIP)
- 40,228
- Household income
- $55,986
- Rent vs Own
- Severe rent burden
- 2206.0
Population outlook (Marion County) Hauer SSP2
- Today (2025)
- 1,025,572 people
- By 2030
- 1,065,727 · +3.9%
- By 2040
- 1,141,577 · +11.3%
- By 2050
- 1,208,920 · +17.9%
- By 2075
- 1,367,288 · +33.3%
- By 2100
- 1,438,201 · +40.2%
Race, ethnicity, and origin ACS 2023
- Neighborhood character
- Diverse neighborhood (Simpson 0.69)
- Race & ethnicity
- Black 39% White 33% Hispanic / Latino 23% Two or more races 7% Asian 1%
- Hispanic origin (detail)
- Mexican 14% Dominican 2%
- Common ancestry
- Hispanic 3% Arab 1% Italian 1%
- Foreign-born
- 31% · Canada, Philippines
- Languages at home
- 62% English-only · Spanish 19% French/Haitian/Cajun 5% Arabic 2%
Political lean MEDSL · Marion
- 2024 margin
- Strong D (+27.7) · D 63.0% · R 35.3% · Other 1.7%
- 2008→2024 swing
- -0.7pp no change · 2008: 28.4pp · 2024: 27.7pp
- All cycles
- 2024: D+27.7 2020: D+29.1 2016: D+22.8 2012: D+22.2 2008: D+28.4
Not yet ingested
- Civics
- —
Market trends
- HPI YoY
- ▼ -179.31%
- Current HPI
- 297.7156
- Rent YoY
- ▲ 0.79%
- Metro
- Indianapolis-Carmel-Anderson, IN
- State GDP YoY
- ▲ 2.90%
- F500 in state
- 18
Industry mix (Fortune 500 HQ in IN)
| Industry | F500 HQs | Revenue |
|---|---|---|
| Industrial Machinery | 2 | $37B |
|
||
| Healthcare | 1 | $177B |
|
||
| Pharmaceuticals | 1 | $45B |
|
||
| Metals / Steel | 1 | $18B |
|
||
| Agriculture | 1 | $17B |
|
||
| Packaging | 1 | $12B |
|
||
Price history
2 events — show timeline
- 2026-05-02 Pending — MIBOR as Distributed by MLS Grid
- 2026-04-21 Listed $263,500 MIBOR as Distributed by MLS Grid
Property tax history
+7.5%/yrLatest (2025): $4,246 · +0.1% YoY. Source: county tax records.
Cash-flow waterfall
monthlySold comps — $/sqft
last 12 mo · ≤1 miLoading sold comps…