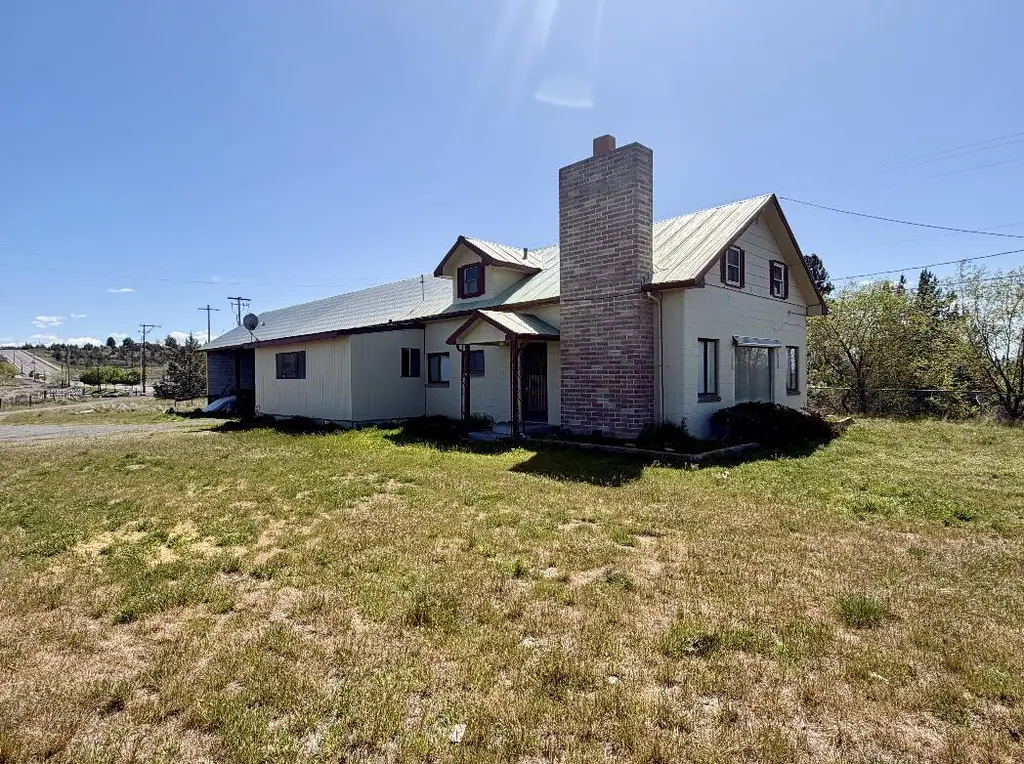
950 E B St · Madras, OR
Flood risk 1/10 · Minimal
- FEMA flood zone
- —
- Chance of flooding over 30 yrs
- 0.0%
- Est. flood insurance / yr
- —
Fire risk 8/10 · Major
- Est. fire insurance / yr
- $498 – $926
Heat risk 4/10 · Minor
- Hot days now (above 95°F)
- 7 days/yr
- Hot days in 30 yrs
- 15 days/yr
Wind risk 1/10 · Minimal
- Chance of severe wind over 30 yrs
- —
Air-quality risk 10/10 · Severe
- Unhealthy air days now
- 18 days/yr
- Unhealthy air days in 30 yrs
- 22 days/yr
Risk factors via First Street. Map © Google.
Why this score? — see what drove the D grade
The composite is a weighted blend of 9 inputs, each scored 0–100. Each bar is that input's sub-score; the figure is the points it added to the 100-point composite (weight × sub-score).
- ARV discount +14.4/15.0
- Appreciation +10.0/10.0
- Cash flow +5.4/30.0
- Livability +3.4/5.0
- Rent growth +2.5/5.0
- Condition / age +2.5/5.0
- Schools +2.1/10.0
- 1% rule +1.0/10.0
- DSCR +0.0/10.0
$375,000
🖨 Deal sheet (PDF) 📄 Offer letter ✓ Due diligence
Listing remarks MLS
Do you want to live on 3.08 acres in the Madras City Limits with a tremendous view of the cascades and the city. This is the home for you. Very Close the Madras Aquatic Center and Juniper Hills Park. Walking trails next to the house. This is a great location. This home is sold as is, Seller will do no repairs. Call your favorite realtor today and tour this home.
Key facts
- 2.82 acre lot
- Parking
- Built 1952
Property features AI
Finance
- Other: Additional parcels associated with the property
- Financial info: Property is not currently rented
- HOA & community: No CCRs
Exterior
- Parking: Driveway; Gravel parking; RV access/parking
- Security: Carbon monoxide detector(s); Smoke detector(s)
- Utilities: Public water; Public sewer; Public utilities
- Home design: Single-family residence; Two levels; Residential property; No short-term rental permit; No audio or video surveillance on premises; Zoning: R1
- Construction: Built in 1952; Block construction; Block and concrete perimeter foundation; No common walls
- Exterior features: Metal roof; Aluminum window frames; Paved road access; Poultry coop; RV/boat storage
Interior
- Kitchen: Dishwasher; Microwave; Refrigerator; Water heater
- Bedrooms: 4 bedrooms (primary bedroom downstairs)
- Flooring: Carpet; Vinyl
- Bathrooms: 3 full bathrooms
- Heating & cooling: Forced air heating with zoned controls; Heat pump (cooling)
- Interior features: Ceiling fan(s); Laminate counters; Primary bedroom on the main floor; Shower/tub combination; Living room fireplace
- Laundry & utility: Laundry room
Neighborhood map
What this means for you Summary
Snapshot
- This is a 4-bed/3.0-bath single-family listed at $375k.
Deal economics
- At list price, monthly cash flow is $-819 ($-10k/yr) — negative.
- To cash-flow at today's rent, offer at most $257k (31.6% below list).
- To meet the 1% rule (rent ≥ 1% of price), the offer needs to be $224k (40.2% below list).
- Recommended offer: $224k (40.2% below list) — sets the bar for 1% rule.
- Cap rate 3.7% vs local median 2.9% in Madras — meaningfully above typical; check what's discounted (condition, days-on-market, listing class) to confirm the premium yield is real.
Location & tenants
- Location reads 67/100 on livability (#180 in OR) — a middle-class / working-renter tenant base. Strengths: cost of living A+, health & safety A+, housing A; Watch: amenities D+, crime D-, commute F.
- Jefferson County SD 509J (rural): math 19% / reading 30% proficiency, ranked #55 of 58 in OR (top 95%) — low school quality limits family demand, transient renter base, plan for 1-2y turnover; 77% free/reduced lunch — lower-income household profile, screen leases tightly.
- Zoned schools: Madras Elementary School (math 17% / reading 22%, grade F, #377 of 412 statewide, top 93%, 363 students, 94% FRL); Jefferson County Middle School (math 21% / reading 39%, grade F, #84 of 128 statewide, top 66%, 473 students, 94% FRL); Madras High School (math 8% / reading 47%, grade F, #114 of 143 statewide, top 80%, 781 students, 93% FRL) — zoned schools average 94% FRL vs 77% district-wide (17 pts higher); higher-poverty schools than district average — tighter screening recommended.
- Market conditions: 260 active listings in the ZIP; 1 comparable units currently listed for rent nearby; 108 units permitted in Jefferson County in 2024 (5 in 5+ unit buildings).
Forward outlook
- In year one you build about $40k of equity ($3k loan paydown + $38k appreciation (10.0% local appreciation)).
- Jefferson County population projected at +7% by 2050 — modest demand growth; plan on rents tracking national, not racing it.
- By year 2, paydown + projected appreciation supports a ~$64k cash-out refi (75% LTV) — recoverable capital for the next deal without selling this one.
Negotiation context
- It's been on market 35 days — a 3% lower offer ($364k) is reasonable based on typical stale-listing flexibility.
- 4 sale attempts since 12y ago; this cycle's ask is 4% above the opening price — seller raised mid-cycle; expect resistance to lowballs.
- Current owner paid $242k; list at $375k implies a 55% gain — meaningful room to come down on a strong offer.
Risks & watch-outs
- Watch-outs: built in 1952 — expect roof / HVAC / electrical / plumbing capex.
- Climate carrying-cost: severe wildfire risk — expect insurance premiums to compound above CPI over the hold.
Questions for the listing agent
- What do current leases actually rent for vs. the listed asking? Can we see a recent rent roll and the last 12 months of T-12 income?
- It's been on market 35 days. Have you received any prior offers? Is the seller open to a 40% concession, seller financing, or rate buy-down credit?
- Built in 1952 — when were the roof, HVAC, electrical panel, plumbing, and water heater last replaced?
- Is there a deadline driving the sale (1031 exchange, divorce, estate, relocation)? That informs how much negotiation room exists.
- Schools are F-rated, which usually means shorter tenancies and higher turnover. Who's the typical renter profile here, and what's been the actual vacancy rate?
- Crime grade is D in this area — have there been break-ins, vandalism, or insurance claims at this property in the last 3 years? What carrier currently insures it and at what premium?
- The area grade is low — what's the realistic commute time and amenity access for the typical tenant pool here? Any planned neighborhood developments (good or bad) we should know about?
- What's the average days-on-market for RENTAL listings here right now (not sales)? A rising rental-DOM trend means longer vacancies and softer asking-rent achievability than the comps imply.
- What's the recent tenant-quality profile in this submarket — average credit score on applications, eviction rate, late-payment / NSF rate, and stable-employment percentage? A property-management company in the area should have these aggregated.
- How much new for-sale + rental construction is in the pipeline within 1–3 miles? Heavy new supply typically softens prices + rents 12–24 months out; constrained supply supports both.
Investment metrics
- 1% rule
- 0.60% ✗
- Cap rate
- 3.67%
- Cash-on-cash
- -9.36%
- DSCR
- 0.58
- GRM
- 13.9
CMA / ARV
- ARV (median comp)
- $443,146
- List price
- $375,000
- Delta
- -15.38%
- Verdict
- UNDERPRICED
- Comps
- 20 within 1.0 mi
Show comp detail 12 sales within ~0.75 mi
| Address | Dist | Beds/Ba | Sqft | Sold | Price | $/sf | Match |
|---|---|---|---|---|---|---|---|
| 640 NE B St | 0.33mi | 3/3.0 (-1) | 2,024 (+4%) | 9mo | $540,000 | $267 | 66 |
| 739 NE Marigold St | 0.51mi | 4/2.5 | 2,045 (+5%) | 12mo | $412,000 | $201 | 56 |
| 630 NE Bean Dr | 0.63mi | 3/2.5 (-1) | 2,052 (+5%) | 1mo | $345,000 | $168 | 55 |
| 738 NE Marigold St | 0.53mi | 3/2.0 (-1) | 1,964 (+0%) | 14mo | $405,000 | $206 | 54 |
| 418 NE Petal Ct | 0.58mi | 4/2.5 | 2,064 (+6%) | 11mo | $410,000 | $199 | 52 |
| 1001 SE Greenleaf Ln #141 | 0.44mi | 3/2.5 (-1) | 2,051 (+5%) | 16mo | $600,000 | $293 | 51 |
| 1024 SE Bluegrass Ln | 0.51mi | 3/2.0 (-1) | 1,869 (-4%) | 11mo | $475,000 | $254 | 51 |
| 330 NE Hillcrest St | 0.56mi | 3/2.0 (-1) | 1,804 (-8%) | 5mo | $390,000 | $216 | 48 |
| 440 NE Hillcrest St | 0.63mi | 3/2.0 (-1) | 1,812 (-7%) | 5mo | $295,000 | $163 | 45 |
| 401 NE Orchid Ct | 0.47mi | 3/2.5 (-1) | 1,664 (-15%) | 3mo | $405,000 | $243 | 44 |
| 755 NE Posey Ct | 0.46mi | 3/2.5 (-1) | 1,664 (-15%) | 13mo | $375,000 | $225 | 36 |
| 323 NE Hillcrest St | 0.52mi | 3/2.0 (-1) | 1,704 (-13%) | 14mo | $375,000 | $220 | 34 |
Match score weights: distance 35% · size 25% · config 20% · recency 20%. Top-matched comps best support the ARV.
Projected returns pro-forma
10.0% appreciation · 3.0% rent growth · sell at horizon
- IRR
- 17.7%
- Equity multiple
- 2.45×
- Total profit
- $152,129
- Equity at exit
- $337,830
- IRR
- 16.6%
- Equity multiple
- 5.66×
- Total profit
- $489,065
- Equity at exit
- $728,543
Cash invested: $105,000 (down + closing). Projections, not guarantees.
Landlord ↔ Tenant lean methodology
- Overall (STATE)
- 28 Tenant-Leaning
- State Oregon
- 28 Tenant-Leaning · D+6
- County
- — inherits STATE
- City
- — inherits STATE
ZIP-level market 97741
- Home prices YoY
- 5.3%
- Active inventory
- 260
- Price-to-rent
- 13.9×
Monthly cashflow live
- Estimated rent
- $2,244 medium interval (Pro) →
- Mortgage (P&I)
- −$1,967
- Tax est. 1.5%
- −$469 /mo · $5,625/yr
- Insurance
- −$156
- HOA
- −$0
- Vacancy / Maint / Mgmt
- −$471
- Net cashflow
- $-819
Break-even live
Sensitivity live
| Price | -10% $-559 | -5% $-689 | +0% $-819 | +5% $-948 | +10% $-1,078 |
|---|---|---|---|---|---|
| Rent | -10% $-996 | -5% $-907 | +0% $-819 | +5% $-730 | +10% $-641 |
| Rate | -1.0pp $-630 | -0.5pp $-723 | base $-819 | +0.5pp $-916 | +1.0pp $-1,015 |
UW: 25.0% down · 7.5% · 30yr · 1.5% tax · 5.0% vac · 8.0% maint · 8.0% mgmt
Financing live
Cash to close
- Down payment
- $93,750
- Closing costs
- $11,250
- Reserves months
- —
- Total cash needed
- —
Loan-product check · same deal, 3 products live
Conventional
25% down · 7.5% · 30yr
- Down + closing
- —
- Monthly P&I
- —
- Monthly cashflow
- —
- DSCR
- —
- Eligible?
- —
Personal DTI + credit; lowest rate.
DSCR
20% down · 8.5% · 30yr
- Down + closing
- —
- Monthly P&I
- —
- Monthly cashflow
- —
- DSCR
- —
- Eligible?
- —
No personal income docs; deal must DSCR.
Hard money
10% down · 12.0% · 12mo
- Down + closing
- —
- Monthly P&I
- —
- Monthly cashflow
- —
- DSCR
- —
- Eligible?
- —
Short-term bridge; refi at stabilization.
Rent comps 1 comps
| Address | Beds | Baths | Sqft | Rent | $/sqft | DOM | Units | Dist |
|---|---|---|---|---|---|---|---|---|
| 652 NE McCampbell St Madras, OR | 3.0 | 2.0 | 1677 | $2,550 | $1.52 | 44d | 1 | 0.78mi |
Listing history 27 events
-
2026-06-19days on market $375,000 Active 35 DOM
-
2026-06-18days on market $375,000 Active 34 DOM
-
2026-06-17days on market $375,000 Active 33 DOM
-
2026-06-16days on market $375,000 Active 32 DOM
-
2026-06-15days on market $375,000 Active 31 DOM
-
2026-06-14days on market $375,000 Active 29 DOM
-
2026-06-12pricedays on market $375,000 Active 28 DOM
-
2026-06-09days on market $359,900 Active 25 DOM
-
2026-06-08days on market $359,900 Active 24 DOM
-
2026-06-07days on market $359,900 Active 23 DOM
-
2026-06-07days on market $359,900 Active 22 DOM
-
2026-06-04days on market $359,900 Active 19 DOM
-
2026-06-02days on market $359,900 Active 18 DOM
-
2026-06-01days on market $359,900 Active 17 DOM
-
2026-05-31days on market $359,900 Active 16 DOM
-
2026-05-31days on market $359,900 Active 15 DOM
-
2026-05-15$359,900 Active 924-char remark
-
2025-08-31historical
-
2025-08-22price $424,000
-
2025-07-07price $439,000
-
2025-05-13price $459,000
-
2025-01-29$464,000 Active
-
2022-07-08soldstatus $242,000 Closed
Show marketing remark (364 chars)
Do you want to live on 3.08 acres in the Madras City Limits with a tremendous view of the cascades and the city. This is the home for you. Very Close the Madras Aquatic Center and Juniper Hills Park. Walking trails next to the house. This is a great location. This home is sold as is, Seller will do no repairs. Call your favorite realtor today and tour this home.
-
2022-05-10historical
Show marketing remark (364 chars)
Do you want to live on 3.08 acres in the Madras City Limits with a tremendous view of the cascades and the city. This is the home for you. Very Close the Madras Aquatic Center and Juniper Hills Park. Walking trails next to the house. This is a great location. This home is sold as is, Seller will do no repairs. Call your favorite realtor today and tour this home.
-
2022-05-10$250,000
Show marketing remark (364 chars)
Do you want to live on 3.08 acres in the Madras City Limits with a tremendous view of the cascades and the city. This is the home for you. Very Close the Madras Aquatic Center and Juniper Hills Park. Walking trails next to the house. This is a great location. This home is sold as is, Seller will do no repairs. Call your favorite realtor today and tour this home.
-
2014-04-03historical
-
2014-03-21$169,500
ⓘ Source: listings_history table (triggers on properties + properties_extension) + one-shot
backfill from property_details.listing_events for pre-trigger history.
Climate risk First Street
- Flood 1/10 Low 0% chance over 30 yrs
- Wildfire 8/10 Severe
- Heat 4/10 Moderate 7 d/yr ≥95°F today · 15 d/yr by 30 yrs out
- Wind 1/10 Low
- Air quality 10/10 Extreme 18 unhealthy d/yr today · 22 by 30 yrs out
Nearby sold comps map
Loading sold comps map…
Walkable amenities ~0.75 mi
Loading nearby amenities…
Taxation est. · year 1
- Rental income
- $26,930
- − Mortgage interest
- −$21,006
- − Property taxes
- −$5,625
- − Insurance
- −$1,875
- − Repairs & maintenance
- −$2,154
- − Management
- −$2,154
- − Depreciation
- −$10,909
- Taxable loss
- −$16,794
- Est. tax savings @ 24.0%
- +$4,030
- After-tax cash flow
- $-5,793/yr
For passive investors: Depreciation is non-cash, so a rental often shows a tax loss while cash-flowing — sheltering income. Rental losses are passive: they offset passive income freely, and up to $25,000/yr can offset ordinary (W-2) income if you actively participate and your MAGI is under $100k (phasing out to $0 by $150k); unused losses carry forward. On sale, claimed depreciation is recaptured at up to 25%, and gains may owe capital-gains tax (a 1031 exchange can defer both). Figures are a year-1 estimate at your 24.0% rate — not tax advice; consult a CPA.
Schools (NCES district)
- District
- Jefferson County SD 509J
- NCES district ID
- 4106740
- Math proficiency
- 19% ▼ -8.00%
- Reading proficiency
- 30% ▼ -9.00%
- Median HH income
- $42,663
- Composite
- 20.9/100
- National rank
- #8488
- State rank
- #55 of 58 in OR
Livability — Madras
- Score
- 67/100
- State rank
- #180
- US rank
- #11012
Category grades
Schools grade is shown separately in the Schools card above.
Census & demographics
- Census place
- Madras, OR
- County
- Jefferson County · 13,663 people
- City population
- 13,663
- Metro
- The Dalles, OR
- Population (ZIP)
- 13,663
- Household income
- $70,983
- Rent vs Own
- Severe rent burden
- 466.0
Population outlook (Jefferson County) Hauer SSP2
- Today (2025)
- 24,040 people
- By 2030
- 24,631 · +2.5%
- By 2040
- 25,499 · +6.1%
- By 2050
- 25,801 · +7.3%
- By 2075
- 25,682 · +6.8%
- By 2100
- 22,222 · -7.6%
Race, ethnicity, and origin ACS 2023
- Neighborhood character
- Diverse neighborhood (Simpson 0.62)
- Race & ethnicity
- White 56% Hispanic / Latino 27% Two or more races 19% Native American 8%
- Hispanic origin (detail)
- Mexican 24%
- Common ancestry
- Portuguese 2% Italian 1% Iranian 1%
- Foreign-born
- 8% · Canada
- Languages at home
- 78% English-only · Spanish 20%
Political lean MEDSL · Jefferson
- 2024 margin
- Solid R (+30.2) · D 33.6% · R 63.8% · Other 2.5%
- 2008→2024 swing
- -21.5pp toward R · 2008: -8.7pp · 2024: -30.2pp
- All cycles
- 2024: R+30.2 2020: R+23.5 2016: R+27.6 2012: R+16.8 2008: R+8.7
Not yet ingested
- Civics
- —
Market trends
- HPI YoY
- ▲ 29.68%
- Current HPI
- 590.9612
- Rent YoY
- —
- Metro
- The Dalles, OR
- State GDP YoY
- ▲ 2.05%
- F500 in state
- 2
Industry mix (Fortune 500 HQ in OR)
| Industry | F500 HQs | Revenue |
|---|---|---|
| Consumer Goods | 1 | $51B |
|
||
Price history
+121.2% since first listed12 events — show timeline
- 2026-06-11 Price Changed $375,000 MLSCO
- 2026-05-15 Listed $359,900 MLSCO
- 2025-08-31 Listing Removed — MLSCO
- 2025-08-22 Price Changed $424,000 MLSCO
- 2025-07-07 Price Changed $439,000 MLSCO
- 2025-05-13 Price Changed $459,000 MLSCO
- 2025-01-29 Listed $464,000 MLSCO
- 2022-07-08 Sold (MLS) $242,000 MLSCO
- 2022-05-10 Listing Removed — MLSCO
- 2022-05-10 Listed $250,000 MLSCO
- 2014-04-03 Listing Removed — MLSCO
- 2014-03-21 Listed $169,500 MLSCO
Property tax history
+1.8%/yrLatest (2025): $536 · +1.8% YoY. Source: county tax records.
Cash-flow waterfall
monthlySold comps — $/sqft
last 12 mo · ≤1 miLoading sold comps…