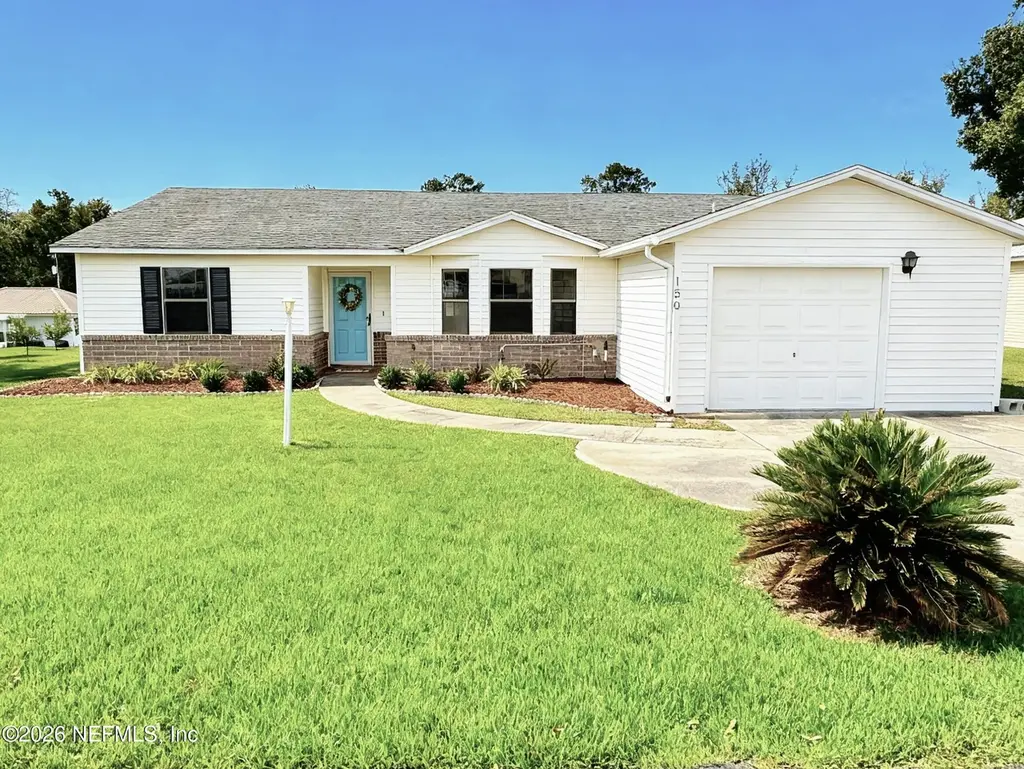
150 SE Sable Ln · Watertown, FL
Flood risk 1/10 · Minimal
- FEMA flood zone
- X (unshaded)
- Chance of flooding over 30 yrs
- 0.0%
- Est. flood insurance / yr
- $507 – $1,088
Fire risk 6/10 · Moderate
- Est. fire insurance / yr
- $947 – $1,759
Heat risk 8/10 · Major
- Hot days now (above 107°F)
- 7 days/yr
- Hot days in 30 yrs
- 20 days/yr
Wind risk 9/10 · Severe
- Chance of severe wind over 30 yrs
- 99.0%
Air-quality risk 5/10 · Moderate
- Unhealthy air days now
- 9 days/yr
- Unhealthy air days in 30 yrs
- 10 days/yr
Risk factors via First Street. Map © Google.
Why this score? — see what drove the C- grade
The composite is a weighted blend of 9 inputs, each scored 0–100. Each bar is that input's sub-score; the figure is the points it added to the 100-point composite (weight × sub-score).
- ARV discount +14.6/15.0
- Cash flow +10.8/30.0
- Appreciation +10.0/10.0
- Schools +4.5/10.0
- 1% rule +3.1/10.0
- DSCR +3.1/10.0
- Livability +3.0/5.0
- Rent growth +2.5/5.0
- Condition / age +2.5/5.0
$219,000
🖨 Deal sheet (PDF) 📄 Offer letter ✓ Due diligence
Listing remarks MLS
Move-in ready home has been completely remodeled with newer appliances and kitchen upgrades, tiled baths & laminated flooring thru-out the entire home; huge rooms, plenty of storage closets, vaulted ceiling in living area; bright open floor plan; quiet beautiful view of the fountain in Eastside Village; great attention to details and fully furnished! This home is a MUST SEE!!!!
Key facts
- Garage
- Community pool
- Built 1990
Property features AI
Finance
- HOA & community
- Homeowners association with clubhouseMonthly association fee of $75Senior community
Exterior
- Parking
- Attached garage with garage door opener (1 car)
- Utilities
- Public sewerElectricity connectedSewer connectedWater connected
- Home design
- Single family residenceOne story
- Construction
- Brick and vinyl siding exteriorShingle roof
- Exterior features
- Covered rear porchScreened porchPaved road accessCommunity pool (not private)
Interior
- Kitchen
- DishwasherElectric rangeMicrowaveRefrigeratorIce maker
- Bedrooms
- 2 bedrooms
- Flooring
- Tile flooring
- Bathrooms
- 2 full bathroomsAccessible full bathroom
- Heating & cooling
- Central heatingCentral air
- Interior features
- Ceiling fansPantryPrimary bedroom on the ground floorVaulted ceilings
- Laundry & utility
- Washer and dryer includedWasher hookupElectric dryer hookupElectric water heater
Neighborhood map
What this means for you Summary
Snapshot
- This is a 3-bed/2.0-bath single-family listed at $219k.
Deal economics
- At list price, monthly cash flow is $-100 ($-1k/yr) — negative.
- To cash-flow at today's rent, offer at most $201k (8.1% below list).
- To meet the 1% rule (rent ≥ 1% of price), the offer needs to be $176k (19.5% below list).
- Recommended offer: $176k (19.5% below list) — sets the bar for 1% rule.
Location & tenants
- Location reads 60/100 on livability (#798 in FL) — a middle-class / working-renter tenant base. Strengths: crime A+, cost of living A+, housing A-; Watch: amenities F, commute F, employment F.
- Columbia (town): math 53% / reading 54% proficiency, ranked #25 of 73 in FL (top 34%) — acceptable for families but not a draw, mixed tenant base, ~2y average lease.
- Zoned schools: Eastside Elementary School (math 68% / reading 62%, grade B+, #514 of 2,144 statewide, top 24%, 631 students, 62% FRL); Columbia High School (math 28% / reading 45%, grade F, #351 of 667 statewide, top 54%, 1,737 students, 50% FRL) — zoned schools at 56% FRL track the district average.
- Market conditions: 146 active listings in the ZIP; 178 units permitted in Columbia County in 2024 (0 in 5+ unit buildings).
- This rent runs 38% of the median local income ($55k/yr) — at the standard rent-burdened threshold; future hikes will face affordability resistance.
Forward outlook
- In year one you build about $23k of equity ($2k loan paydown + $22k appreciation (10.0% local appreciation)).
- Columbia County population projected to shrink 7% by 2050 — rents likely to lag national; underwrite the cash flow, not the appreciation.
- By year 2, paydown + projected appreciation supports a ~$38k cash-out refi (75% LTV) — recoverable capital for the next deal without selling this one.
Negotiation context
- It's been on market 73 days — a 6% lower offer ($206k) is reasonable based on typical stale-listing flexibility.
- Current owner paid $110k; list at $219k implies a 98% gain — meaningful room to come down on a strong offer.
Risks & watch-outs
- Climate carrying-cost: severe wind risk, 99% chance of damaging wind over 30y; major wildfire risk; extreme-heat days projected 7→20/yr by 2055 (HVAC capex compounding) — expect insurance premiums to compound above CPI over the hold.
Questions for the listing agent
- What do current leases actually rent for vs. the listed asking? Can we see a recent rent roll and the last 12 months of T-12 income?
- It's been on market 73 days. Have you received any prior offers? Is the seller open to a 19% concession, seller financing, or rate buy-down credit?
- What does the HOA fee cover, when was the last increase, and are there any pending special assessments or reserve-fund shortfalls?
- Why hasn't it sold? Are there any deal-killer items the seller is aware of (foundation, flood, title, zoning, code violations)?
- Is there a deadline driving the sale (1031 exchange, divorce, estate, relocation)? That informs how much negotiation room exists.
- Schools are F-rated, which usually means shorter tenancies and higher turnover. Who's the typical renter profile here, and what's been the actual vacancy rate?
- What's the average days-on-market for RENTAL listings here right now (not sales)? A rising rental-DOM trend means longer vacancies and softer asking-rent achievability than the comps imply.
- What's the recent tenant-quality profile in this submarket — average credit score on applications, eviction rate, late-payment / NSF rate, and stable-employment percentage? A property-management company in the area should have these aggregated.
- How much new for-sale + rental construction is in the pipeline within 1–3 miles? Heavy new supply typically softens prices + rents 12–24 months out; constrained supply supports both.
Investment metrics
- 1% rule
- 0.81% ✗
- Cap rate
- 5.74%
- Cash-on-cash
- -1.96%
- DSCR
- 0.91
- GRM
- 10.3
CMA / ARV
- ARV (on-the-fly)
- $259,749
- Comps found
- 12
Show comp detail 12 sales within ~0.75 mi
| Address | Dist | Beds/Ba | Sqft | Sold | Price | $/sf | Match |
|---|---|---|---|---|---|---|---|
| 114 SE Ibis Way | 0.27mi | 3/2.0 | 1,745 (-1%) | 8mo | $257,050 | $147 | 79 |
| 212 SE Willow Dr | 0.07mi | 3/2.0 | 1,878 (+6%) | 10mo | $325,000 | $173 | 78 |
| 195 SE Jenese Way | 0.09mi | 3/2.0 | 1,596 (-10%) | 14mo | $195,000 | $122 | 68 |
| 795 SE Defender Dr | 0.20mi | 3/1.5 | 1,568 (-11%) | 8mo | $193,500 | $123 | 63 |
| 132 SE Tribble St | 0.49mi | 4/3.0 (+1) | 1,800 (+2%) | 3mo | $274,900 | $153 | 62 |
| 234 SE Emerson Ct | 0.43mi | 3/2.0 | 1,636 (-7%) | 7mo | $200,000 | $122 | 62 |
| 772 SE Defender Dr | 0.21mi | 3/1.5 | 1,509 (-15%) | 8mo | $170,000 | $113 | 57 |
| 231 SE Golf Club Ave | 0.54mi | 4/1.5 (+1) | 1,696 (-4%) | 6mo | $119,000 | $70 | 56 |
| 144 SE Wilderness Dr | 0.24mi | 3/2.0 | 1,514 (-14%) | 12mo | $275,000 | $182 | 55 |
| 434 SE Rosewood Cir | 0.33mi | 3/2.0 | 1,511 (-14%) | 11mo | $265,000 | $175 | 52 |
| 1871 SE Baya Dr | 0.52mi | 3/2.0 | 1,575 (-11%) | 10mo | $175,000 | $111 | 50 |
| 479 SE Rosewood Cir | 0.37mi | 3/2.0 | 1,511 (-14%) | 20mo | $288,000 | $191 | 42 |
Match score weights: distance 35% · size 25% · config 20% · recency 20%. Top-matched comps best support the ARV.
Projected returns pro-forma
10.0% appreciation · 3.0% rent growth · sell at horizon
- IRR
- 22.9%
- Equity multiple
- 2.84×
- Total profit
- $112,902
- Equity at exit
- $197,293
- IRR
- 20.4%
- Equity multiple
- 6.50×
- Total profit
- $337,527
- Equity at exit
- $425,469
Cash invested: $61,320 (down + closing). Projections, not guarantees.
Landlord ↔ Tenant lean methodology
- Overall (STATE)
- 87 Strongly Landlord-Friendly
- State Florida
- 87 Strongly Landlord-Friendly · R+3
- County
- — inherits STATE
- City
- — inherits STATE
ZIP-level market 32025
- Home prices YoY
- 6.8%
- Active inventory
- 146
- Price-to-rent
- 10.3×
Monthly cashflow live
- Estimated rent
- $1,764 medium interval (Pro) →
- Mortgage (P&I)
- −$1,148
- Tax from tax record
- −$179 /mo · $2,146/yr
- Insurance
- −$91
- HOA
- −$75
- Lot rent
- −$0
- Vacancy / Maint / Mgmt
- −$370
- Net cashflow
- $-100
Break-even live
Sensitivity live
| Price | -10% $24 | -5% $-38 | +0% $-100 | +5% $-162 | +10% $-224 |
|---|---|---|---|---|---|
| Rent | -10% $-240 | -5% $-170 | +0% $-100 | +5% $-31 | +10% $39 |
| Rate | -1.0pp $10 | -0.5pp $-45 | base $-100 | +0.5pp $-157 | +1.0pp $-215 |
UW: 25.0% down · 7.5% · 30yr · 1.5% tax · 5.0% vac · 8.0% maint · 8.0% mgmt
Financing live
Cash to close
- Down payment
- $54,750
- Closing costs
- $6,570
- Reserves months
- —
- Total cash needed
- —
Loan-product check · same deal, 3 products live
Conventional
25% down · 7.5% · 30yr
- Down + closing
- —
- Monthly P&I
- —
- Monthly cashflow
- —
- DSCR
- —
- Eligible?
- —
Personal DTI + credit; lowest rate.
DSCR
20% down · 8.5% · 30yr
- Down + closing
- —
- Monthly P&I
- —
- Monthly cashflow
- —
- DSCR
- —
- Eligible?
- —
No personal income docs; deal must DSCR.
Hard money
10% down · 12.0% · 12mo
- Down + closing
- —
- Monthly P&I
- —
- Monthly cashflow
- —
- DSCR
- —
- Eligible?
- —
Short-term bridge; refi at stabilization.
HOA detail
- Monthly dues
- $75 · $900/yr
Listing history 23 events
-
2026-06-22days on market $219,000 Active 73 DOM
-
2026-06-21days on market $219,000 Active 72 DOM
-
2026-06-19days on market $219,000 Active 70 DOM
-
2026-06-18days on market $219,000 Active 69 DOM
-
2026-06-17days on market $219,000 Active 68 DOM
-
2026-06-16days on market $219,000 Active 67 DOM
-
2026-06-15days on market $219,000 Active 66 DOM
-
2026-06-14days on market $219,000 Active 64 DOM
-
2026-06-12days on market $219,000 Active 63 DOM
-
2026-06-09days on market $219,000 Active 60 DOM
-
2026-06-08days on market $219,000 Active 59 DOM
-
2026-06-07days on market $219,000 Active 58 DOM
-
2026-06-05days on market $219,000 Active 55 DOM
-
2026-06-03days on market $219,000 Active 54 DOM
-
2026-06-02days on market $219,000 Active 53 DOM
-
2026-06-01days on market $219,000 Active 52 DOM
-
2026-05-31days on market $219,000 Active 51 DOM
-
2026-05-30days on market $219,000 Active 50 DOM
-
2026-05-22price $219,000
-
2026-04-10$230,000 Active
-
2016-01-27soldstatus $110,500
-
2015-12-14soldstatus $110,450 386-char remark
Show marketing remark (386 chars)
Move-in ready home has been completely remodeled with newer appliances and kitchen upgrades, tiled baths & laminated flooring thru-out the entire home; huge rooms, plenty of storage closets, vaulted ceiling in living area; bright open floor plan; quiet beautiful view of the fountain in Eastside Village; great attention to details and fully furnished! This home is a MUST SEE!!!!
-
2003-07-16soldstatus $88,900
ⓘ Source: listings_history table (triggers on properties + properties_extension) + one-shot
backfill from property_details.listing_events for pre-trigger history.
Tax reassessment forecast FL · Resets to sale price
- Current annual tax
- $2,146 · $179/mo
- Projected year-2 tax
- $2,146 · $179/mo
- Expected delta
- $0/yr ($0/mo · 0.0%)
ⓘ Screening estimate from a state-policy table — verify with the county assessor before closing.
Climate risk First Street
- Flood 1/10 Low FEMA zone X (unshaded) · 0% chance over 30 yrs
- Wildfire 6/10 Major
- Heat 8/10 Severe 7 d/yr ≥107°F today · 20 d/yr by 30 yrs out
- Wind 9/10 Extreme 99% chance of damaging wind over 30 yrs
- Air quality 5/10 Major 9 unhealthy d/yr today · 10 by 30 yrs out
Nearby sold comps map
Loading sold comps map…
Walkable amenities ~0.75 mi
Loading nearby amenities…
Taxation est. · year 1
- Rental income
- $21,164
- − Mortgage interest
- −$12,267
- − Property taxes
- −$2,146
- − Insurance
- −$1,095
- − Repairs & maintenance
- −$1,693
- − Management
- −$1,693
- − HOA
- −$900
- − Depreciation
- −$6,371
- Taxable loss
- −$5,002
- Est. tax savings @ 24.0%
- +$1,200
- After-tax cash flow
- $-3/yr
For passive investors: Depreciation is non-cash, so a rental often shows a tax loss while cash-flowing — sheltering income. Rental losses are passive: they offset passive income freely, and up to $25,000/yr can offset ordinary (W-2) income if you actively participate and your MAGI is under $100k (phasing out to $0 by $150k); unused losses carry forward. On sale, claimed depreciation is recaptured at up to 25%, and gains may owe capital-gains tax (a 1031 exchange can defer both). Figures are a year-1 estimate at your 24.0% rate — not tax advice; consult a CPA.
Schools (NCES district)
- District
- Columbia
- NCES district ID
- 1200360
- Math proficiency
- 53% ▼ -10.00%
- Reading proficiency
- 54% ▼ -3.00%
- Median HH income
- $40,053
- Composite
- 44.74/100
- National rank
- #2750
- State rank
- #25 of 73 in FL
Livability — Watertown
- Score
- 60/100
- State rank
- #798
- US rank
- #18481
Category grades
Schools grade is shown separately in the Schools card above.
Census & demographics
- Census place
- Watertown, FL
- County
- Columbia County · 40,507 people
- Metro
- Lake City, FL
- Population (ZIP)
- 22,948
- Household income
- $55,004
- Rent vs Own
- Severe rent burden
- 754.0
Population outlook (Columbia County) Hauer SSP2
- Today (2025)
- 68,129 people
- By 2030
- 67,501 · -0.9%
- By 2040
- 65,465 · -3.9%
- By 2050
- 63,058 · -7.4%
- By 2075
- 56,291 · -17.4%
- By 2100
- 45,243 · -33.6%
Race, ethnicity, and origin ACS 2023
- Neighborhood character
- Predominantly White (67%)
- Race & ethnicity
- White 67% Black 20% Hispanic / Latino 8% Two or more races 7%
- Hispanic origin (detail)
- Mexican 1% Puerto Rican 3% Cuban 1%
- Common ancestry
- Serbian 2% Lithuanian 2% Romanian 2%
- Foreign-born
- 3% · Canada
- Languages at home
- 91% English-only · Spanish 6% French/Haitian/Cajun 2%
Political lean MEDSL · Columbia
- 2024 margin
- Solid R (+50.2) · D 24.6% · R 74.7%
- 2008→2024 swing
- -16.4pp toward R · 2008: -33.8pp · 2024: -50.2pp
- All cycles
- 2024: R+50.2 2020: R+45.2 2016: R+44.5 2012: R+36.7 2008: R+33.8
Not yet ingested
- Civics
- —
Market trends
- HPI YoY
- ▲ 17.57%
- Current HPI
- 276.7253
- Rent YoY
- —
- Metro
- Lake City, FL
- State GDP YoY
- ▲ 3.28%
- F500 in state
- 36
Industry mix (Fortune 500 HQ in FL)
| Industry | F500 HQs | Revenue |
|---|---|---|
| Industrial Technology | 2 | $29B |
|
||
| Insurance | 2 | $17B |
|
||
| Retail | 1 | $60B |
|
||
| Technology Distribution | 1 | $58B |
|
||
| Homebuilding | 1 | $35B |
|
||
| Technology Manufacturing | 1 | $35B |
|
||
Price history
+146.3% since first listed5 events — show timeline
- 2026-05-22 Price Changed $219,000 realMLS
- 2026-04-10 Listed $230,000 realMLS
- 2016-01-27 Sold (Public Records) $110,500 Public Records
- 2015-12-14 Sold (MLS) $110,450 NFMLS
- 2003-07-16 Sold (Public Records) $88,900 Public Records
Property tax history
+3.2%/yrLatest (2025): $2,146 · -18.9% YoY. Source: county tax records.
Cash-flow waterfall
monthlySold comps — $/sqft
last 12 mo · ≤1 miLoading sold comps…