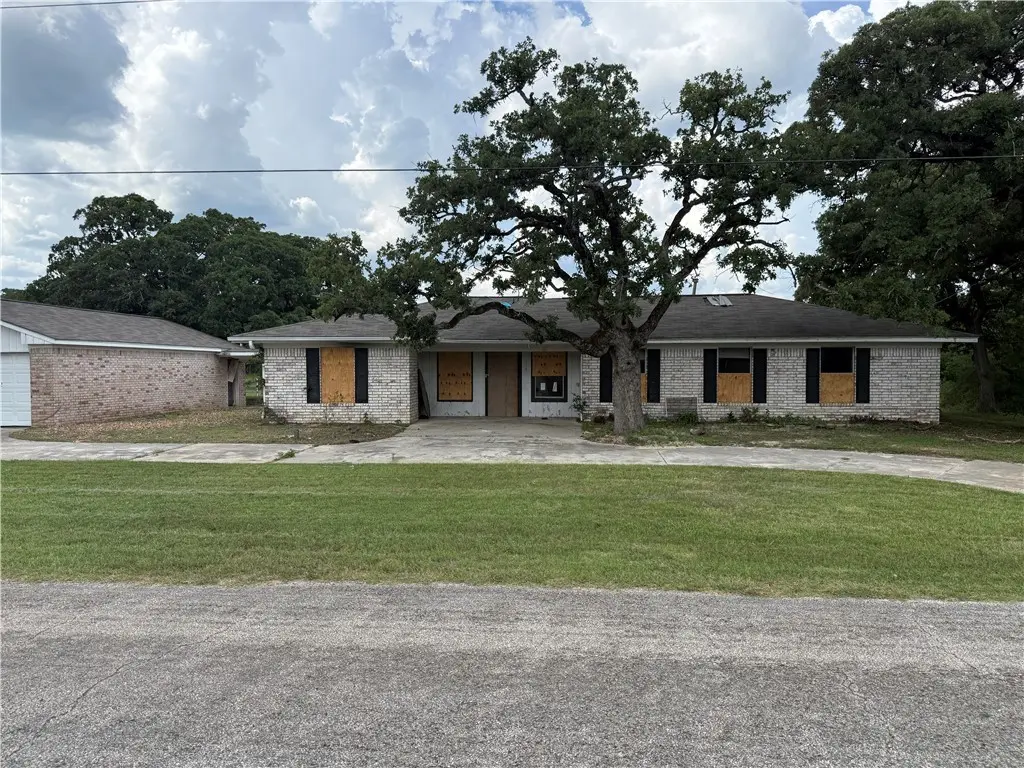
245 Golfview Dr · Hilltop Lakes, TX
Flood risk 1/10 · Minimal
- FEMA flood zone
- X (unshaded)
- Chance of flooding over 30 yrs
- 0.0%
- Est. flood insurance / yr
- $507 – $1,088
Fire risk 3/10 · Minor
- Est. fire insurance / yr
- $1,222 – $2,270
Heat risk 8/10 · Major
- Hot days now (above 110°F)
- 7 days/yr
- Hot days in 30 yrs
- 26 days/yr
Wind risk 8/10 · Major
- Chance of severe wind over 30 yrs
- 80.0%
Air-quality risk 1/10 · Minimal
- Unhealthy air days now
- 0 days/yr
- Unhealthy air days in 30 yrs
- 0 days/yr
Risk factors via First Street. Map © Google.
Why this score? — see what drove the B grade
The composite is a weighted blend of 9 inputs, each scored 0–100. Each bar is that input's sub-score; the figure is the points it added to the 100-point composite (weight × sub-score).
- Cash flow +27.4/30.0
- 1% rule +10.0/10.0
- DSCR +9.6/10.0
- ARV discount +7.5/15.0
- Appreciation +6.6/10.0
- Schools +3.7/10.0
- Livability +3.1/5.0
- Rent growth +2.5/5.0
- Condition / age +2.5/5.0
$81,280
🖨 Deal sheet 📄 Offer letter ✓ Due diligence
Listing remarks
Investor special in the desirable Hilltop Lakes community! This 4-bedroom, 2-bath home offers 1,627 sq ft of potential on a 0.15-acre lot. Built in 1965, this property is a true fixer-upper and will require extensive renovation due to fire and water damage. With the right vision, this home could be restored or reimagined as a weekend getaway, rental, or full-time residence. Located in the unique Hilltop Lakes community, residents enjoy access to neighborhood amenities including lakes, golf, parks, and recreational spaces. Bring your contractor, creativity, and plans—this property is ready for its next chapter!
Key facts
- Golf
- Lakes
- Parks
Tags
Neighborhood map
What this means for you Summary
Snapshot
- This is a 4-bed/1.0-bath single-family listed at $81k.
Deal economics
- At list price, monthly cash flow is $238 ($3k/yr) — positive.
- The deal already cash-flows at list — no discount required.
- Meets the 1% rule at list price ($1k rent vs $81k).
- Cap rate 9.8% vs local median 1.2% in Hilltop Lakes — top-decile yield for the area; either an underpriced asset or a hidden risk that comps aren't pricing in. Stress-test before assuming the spread holds.
Location & tenants
- Location reads 61/100 on livability (#1,029 in TX) — a middle-class / working-renter tenant base. Strengths: cost of living A+, housing A; Watch: crime C-, employment D+, schools F.
- Normangee ISD (rural): math 41% / reading 46% proficiency, ranked #301 of 826 in TX (top 36%) — families likely to look elsewhere, expect single-tenant / working-renter base with shorter leases.
- Market conditions: 132 active listings in the ZIP.
Forward outlook
- In year one you build about $3k of equity ($562 loan paydown + $3k appreciation (3.2% local appreciation)).
- At projected returns (3.2% appreciation + 3.0% rent growth), your $23k cash investment doubles in ~4 years — after that, you're playing with house money.
- By year 10, paydown + projected appreciation supports a ~$31k cash-out refi (75% LTV) — recoverable capital for the next deal without selling this one.
Negotiation context
- Only 8 days on market — expect competitive offers; lowballing is unlikely to land.
- 2 sale attempts; this cycle's ask has dropped $20k (20%) from the opening price — seller is motivated, your offer sets the floor, not the list.
Risks & watch-outs
- Watch-outs: property tax is 4.9% of price.
- Climate carrying-cost: severe wind risk, 80% chance of damaging wind over 30y; extreme-heat days projected 7→26/yr by 2055 (HVAC capex compounding) — expect insurance premiums to compound above CPI over the hold.
Questions for the listing agent
- Built in 1965 — when were the roof, HVAC, electrical panel, plumbing, and water heater last replaced?
- Property tax is high relative to price — has the assessment been appealed recently, and will the sale trigger a re-assessment?
- What does the HOA fee cover, when was the last increase, and are there any pending special assessments or reserve-fund shortfalls?
- Is there a deadline driving the sale (1031 exchange, divorce, estate, relocation)? That informs how much negotiation room exists.
- Schools are F-rated, which usually means shorter tenancies and higher turnover. Who's the typical renter profile here, and what's been the actual vacancy rate?
- What's the average days-on-market for RENTAL listings here right now (not sales)? A rising rental-DOM trend means longer vacancies and softer asking-rent achievability than the comps imply.
- What's the recent tenant-quality profile in this submarket — average credit score on applications, eviction rate, late-payment / NSF rate, and stable-employment percentage? A property-management company in the area should have these aggregated.
- How much new for-sale + rental construction is in the pipeline within 1–3 miles? Heavy new supply typically softens prices + rents 12–24 months out; constrained supply supports both.
Investment metrics
- 1% rule
- 1.71% ✓
- Cap rate
- 9.81%
- Cash-on-cash
- 12.54%
- DSCR
- 1.56
- GRM
- 4.9
CMA / ARV
- ARV (median comp)
- $281,030
- List price
- $81,280
- Delta
- -67.46%
- Verdict
- UNDERPRICED
- Comps
- 20 within 1.0 mi
Show comp detail 5 sales within ~0.75 mi
| Address | Dist | Beds/Ba | Sqft | Sold | Price | $/sf | Match |
|---|---|---|---|---|---|---|---|
| 191 Golfview Dr N | 0.34mi | 3/2.0 (-1) | 1,606 (-1%) | 12mo | $280,000 | $174 | 62 |
| 87 Fairway Dr | 0.58mi | 3/2.0 (-1) | 1,746 (+7%) | 12mo | $270,000 | $155 | 42 |
| 83 Fairway Dr | 0.60mi | 3/2.0 (-1) | 1,472 (-10%) | 14mo | $291,868 | $198 | 36 |
| 40 Golfclub Dr | 0.75mi | 4/2.0 | 1,800 (+11%) | 12mo | $158,000 | $88 | 33 |
| 86 Fairway Dr | 0.61mi | 3/2.0 (-1) | 1,476 (-9%) | 18mo | $191,200 | $130 | 32 |
Match score weights: distance 35% · size 25% · config 20% · recency 20%. Top-matched comps best support the ARV.
Projected returns pro-forma
3.24% appreciation · 3.0% rent growth · sell at horizon
- IRR
- 19.9%
- Equity multiple
- 2.15×
- Total profit
- $26,174
- Equity at exit
- $37,639
- IRR
- 21.0%
- Equity multiple
- 4.12×
- Total profit
- $70,974
- Equity at exit
- $58,870
Cash invested: $22,758 (down + closing). Projections, not guarantees.
Landlord ↔ Tenant lean methodology
- Overall (STATE)
- 87 Strongly Landlord-Friendly
- State Texas
- 87 Strongly Landlord-Friendly · R+5
- County
- — inherits STATE
- City
- — inherits STATE
ZIP-level market 77871
- Home prices YoY
- 1.4%
- Active inventory
- 132
- Price-to-rent
- 4.9×
Monthly cashflow live
- Estimated rent
- $1,389 medium interval (Pro) →
- Mortgage (P&I)
- −$426
- Tax from tax record
- −$334 /mo · $4,012/yr
- Insurance
- −$34
- HOA
- −$65
- Vacancy / Maint / Mgmt
- −$292
- Net cashflow
- $238
Break-even live
UW: 25.0% down · 7.5% · 30yr · 1.5% tax · 5.0% vac · 8.0% maint · 8.0% mgmt
Financing live
Cash to close
- Down payment
- $20,320
- Closing costs
- $2,438
- Reserves months
- —
- Total cash needed
- —
Loan-product check · same deal, 3 products live
Conventional
25% down · 7.5% · 30yr
- Down + closing
- —
- Monthly P&I
- —
- Monthly cashflow
- —
- DSCR
- —
- Eligible?
- —
Personal DTI + credit; lowest rate.
DSCR
20% down · 8.5% · 30yr
- Down + closing
- —
- Monthly P&I
- —
- Monthly cashflow
- —
- DSCR
- —
- Eligible?
- —
No personal income docs; deal must DSCR.
Hard money
10% down · 12.0% · 12mo
- Down + closing
- —
- Monthly P&I
- —
- Monthly cashflow
- —
- DSCR
- —
- Eligible?
- —
Short-term bridge; refi at stabilization.
HOA detail
- Monthly dues
- $65 · $780/yr
- Likely covers
- water
Listing history 12 events
-
2026-06-18days on market $81,280 Active 8 DOM
-
2026-06-17price $81,280 Active 7 DOM
-
2026-06-08days on market $86,360 Active 7 DOM
-
2026-06-08days on market $86,360 Active 6 DOM
-
2026-06-07days on market $86,360 Active 5 DOM
-
2026-06-03days on market $86,360 Active 2 DOM
-
2026-06-02remarks 617-char remark
-
2026-06-02pricestatusdays on market $86,360 Active 1 DOM
-
2026-04-13price $91,440
-
2026-04-13status Active
-
2026-03-16price $96,520
-
2026-01-29$101,600 Active
ⓘ Source: listings_history table (triggers on properties + properties_extension) + one-shot
backfill from property_details.listing_events for pre-trigger history.
Tax reassessment forecast TX · Resets to sale price
- Current annual tax
- $4,012 · $334/mo
- Projected year-2 tax
- $4,012 · $334/mo
- Expected delta
- $0/yr ($0/mo · 0.0%)
ⓘ Screening estimate from a state-policy table — verify with the county assessor before closing.
Climate risk First Street
- Flood 1/10 Low FEMA zone X (unshaded) · 0% chance over 30 yrs
- Wildfire 3/10 Moderate
- Heat 8/10 Severe 7 d/yr ≥110°F today · 26 d/yr by 30 yrs out
- Wind 8/10 Severe 80% chance of damaging wind over 30 yrs
- Air quality 1/10 Low 0 unhealthy d/yr today · 0 by 30 yrs out
Nearby sold comps map
Loading sold comps map…
Walkable amenities ~0.75 mi
Loading nearby amenities…
Taxation est. · year 1
- Rental income
- $16,668
- − Mortgage interest
- −$4,553
- − Property taxes
- −$4,012
- − Insurance
- −$406
- − Repairs & maintenance
- −$1,333
- − Management
- −$1,333
- − HOA
- −$780
- − Depreciation
- −$2,365
- Taxable income
- $1,886
- Est. tax owed @ 24.0%
- −$453
- After-tax cash flow
- $2,402/yr
For passive investors: Depreciation is non-cash, so a rental often shows a tax loss while cash-flowing — sheltering income. Rental losses are passive: they offset passive income freely, and up to $25,000/yr can offset ordinary (W-2) income if you actively participate and your MAGI is under $100k (phasing out to $0 by $150k); unused losses carry forward. On sale, claimed depreciation is recaptured at up to 25%, and gains may owe capital-gains tax (a 1031 exchange can defer both). Figures are a year-1 estimate at your 24.0% rate — not tax advice; consult a CPA.
Schools (NCES district)
- District
- Normangee ISD
- NCES district ID
- 4832910
- Math proficiency
- 41% ▼ -8.00%
- Reading proficiency
- 46% ▼ -2.00%
- Median HH income
- $46,539
- Composite
- 37.05/100
- National rank
- #4510
- State rank
- #301 of 826 in TX
Livability — Hilltop Lakes
- Score
- 61/100
- State rank
- #1029
- US rank
- #18255
Category grades
Schools grade is shown separately in the Schools card above.
Census & demographics
- Census place
- Hilltop Lakes, TX
- Population (ZIP)
- 2,744
Population outlook (Leon County) Hauer SSP2
- Today (2025)
- 17,271 people
- By 2030
- 17,271 · +0.0%
- By 2040
- 17,151 · -0.7%
- By 2050
- 16,863 · -2.4%
- By 2075
- 16,304 · -5.6%
- By 2100
- 13,968 · -19.1%
Race, ethnicity, and origin ACS 2023
- Neighborhood character
- Predominantly White (81%)
- Race & ethnicity
- White 81% Hispanic / Latino 12% Black 5% Two or more races 4%
- Hispanic origin (detail)
- Mexican 9%
- Common ancestry
- Slovak 2% Lithuanian 2%
- Foreign-born
- 1% · Vietnam, Canada
- Languages at home
- 96% English-only · Spanish 3% Vietnamese 1%
Political lean MEDSL · Leon
- 2024 margin
- Solid R (+76.7) · D 11.4% · R 88.1%
- 2008→2024 swing
- -17.8pp toward R · 2008: -58.9pp · 2024: -76.7pp
- All cycles
- 2024: R+76.7 2020: R+74.4 2016: R+74.0 2012: R+68.4 2008: R+58.9
Not yet ingested
- Civics
- —
Market trends
- HPI YoY
- ▲ 3.24%
- Current HPI
- 232.7718
- Rent YoY
- —
- Metro
- —
- State GDP YoY
- ▲ 3.95%
- F500 in state
- 110
Industry mix (Fortune 500 HQ in TX)
| Industry | F500 HQs | Revenue |
|---|---|---|
| Energy | 16 | $1,198B |
|
||
| Technology | 5 | $198B |
|
||
| Engineering / Construction | 4 | $72B |
|
||
| Energy Services | 3 | $60B |
|
||
| Utilities | 3 | $41B |
|
||
| Healthcare | 2 | $330B |
|
||
Price history
-10.0% since first listed4 events — show timeline
- 2026-04-13 Price Changed $91,440 BCSRMLS
- 2026-04-13 Relisted — BCSRMLS
- 2026-03-16 Price Changed $96,520 BCSRMLS
- 2026-01-29 Listed $101,600 BCSRMLS
Property tax history
+6.8%/yrLatest (2025): $4,012 · +1.5% YoY. Source: county tax records.
Cash-flow waterfall
monthlySold comps — $/sqft
last 12 mo · ≤1 miLoading sold comps…