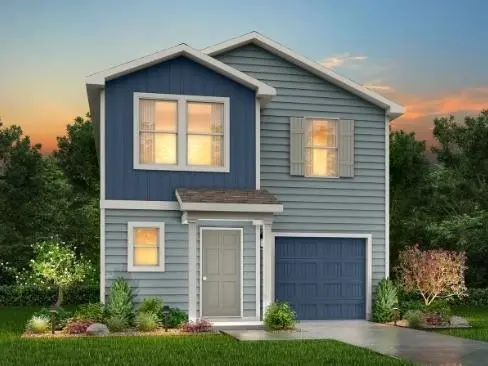
515 Don Ln · Itasca, TX
Flood risk No data
- FEMA flood zone
- —
- Chance of flooding over 30 yrs
- —
- Est. flood insurance / yr
- —
Fire risk No data
- Est. fire insurance / yr
- —
Heat risk No data
- Hot days now (above threshold)
- —
- Hot days in 30 yrs
- —
Wind risk No data
- Chance of severe wind over 30 yrs
- —
Air-quality risk No data
- Unhealthy air days now
- —
- Unhealthy air days in 30 yrs
- —
Risk factors via First Street. Map © Google.
Why this score? — see what drove the C- grade
The composite is a weighted blend of 9 inputs, each scored 0–100. Each bar is that input's sub-score; the figure is the points it added to the 100-point composite (weight × sub-score).
- Cash flow +12.3/30.0
- Appreciation +10.0/10.0
- ARV discount +9.5/15.0
- Condition / age +4.0/5.0
- DSCR +3.7/10.0
- 1% rule +3.5/10.0
- Livability +3.2/5.0
- Rent growth +2.5/5.0
- Schools +2.5/10.0
$201,990
🖨 Deal sheet 📄 Offer letter ✓ Due diligence
Listing remarks MLS
MLS# 21130140 - Built by NHC - Jul 2026 completion! ~ Model 1600-1 A1 - Everglades The Everglades Plan from our Freedom Series offers an ideal blend of space, functionality, and value. This charming 2-story home features 4 bedrooms, 2.5 bathrooms, a 1-car garage, and 1,600 square feet of thoughtfully designed living space. Step into the welcoming entryway, where you’ll find a convenient half bathroom and the staircase leading to the upper level. Continue down the hall past the laundry room and into the open-concept living area. The kitchen, complete with a central island, overlooks the dining area and family room, creating a perfect space for meals and family time. Upstairs, the primary suite offers a private retreat with its own bathroom. Three additional bedrooms and a full bathroom complete the upper level, providing ample space for guests.
Key facts
- 5,663 sq ft lot
- Garage
- Built 2026
Neighborhood map
What this means for you Summary
Snapshot
- This is a 4-bed/2.5-bath single-family listed at $202k. Condition is rated good.
Deal economics
- At list price, monthly cash flow is $-35 ($-424/yr) — negative.
- To cash-flow at today's rent, offer at most $197k (2.5% below list).
- To meet the 1% rule (rent ≥ 1% of price), the offer needs to be $172k (14.7% below list).
- Recommended offer: $172k (14.7% below list) — sets the bar for 1% rule.
Location & tenants
- Location reads 63/100 on livability (#832 in TX) — a middle-class / working-renter tenant base. Strengths: cost of living A+, housing A+, crime A-; Watch: employment D, schools D-, amenities F.
- Itasca ISD (rural): math 23% / reading 35% proficiency, ranked #636 of 826 in TX (top 77%) — low school quality limits family demand, transient renter base, plan for 1-2y turnover; 63% free/reduced lunch — lower-income household profile, screen leases tightly.
- Market conditions: 83 active listings in the ZIP; 4 comparable units currently listed for rent nearby; rentals lingering (median 44d on market — plan ~5-8 weeks vacancy on turnover, expect pricing pressure); 75% of comp listings sitting > 30 days — soft ceiling on asking rent; 65 units permitted in Hill County in 2024 (0 in 5+ unit buildings).
Forward outlook
- In year one you build about $22k of equity ($1k loan paydown + $20k appreciation (10.0% local appreciation)).
- Hill County population projected at -12% by 2050 — secular population decline; favor cash flow + early exit over multi-decade hold.
- At projected returns (10.0% appreciation + 3.0% rent growth), your $57k cash investment doubles in ~3 years — after that, you're playing with house money.
- By year 2, paydown + projected appreciation supports a ~$35k cash-out refi (75% LTV) — recoverable capital for the next deal without selling this one.
Negotiation context
- It's been on market 190 days — a 12% lower offer ($178k) is reasonable based on typical stale-listing flexibility.
- 2 sale attempts; this cycle's ask has dropped $240k (54%) from the opening price — seller is motivated, your offer sets the floor, not the list.
Questions for the listing agent
- What do current leases actually rent for vs. the listed asking? Can we see a recent rent roll and the last 12 months of T-12 income?
- It's been on market 190 days. Have you received any prior offers? Is the seller open to a 15% concession, seller financing, or rate buy-down credit?
- Why hasn't it sold? Are there any deal-killer items the seller is aware of (foundation, flood, title, zoning, code violations)?
- Is there a deadline driving the sale (1031 exchange, divorce, estate, relocation)? That informs how much negotiation room exists.
- Schools are D-rated, which usually means shorter tenancies and higher turnover. Who's the typical renter profile here, and what's been the actual vacancy rate?
- What's the average days-on-market for RENTAL listings here right now (not sales)? A rising rental-DOM trend means longer vacancies and softer asking-rent achievability than the comps imply.
- What's the recent tenant-quality profile in this submarket — average credit score on applications, eviction rate, late-payment / NSF rate, and stable-employment percentage? A property-management company in the area should have these aggregated.
- How much new for-sale + rental construction is in the pipeline within 1–3 miles? Heavy new supply typically softens prices + rents 12–24 months out; constrained supply supports both.
Investment metrics
- 1% rule
- 0.85% ✗
- Cap rate
- 6.08%
- Cash-on-cash
- -0.75%
- DSCR
- 0.97
- GRM
- 9.8
CMA / ARV
- ARV (median comp)
- $211,525
- List price
- $201,990
- Delta
- -4.51%
- Verdict
- FAIR
- Comps
- 20 within 1.0 mi
Show comp detail 12 sales within ~0.75 mi
| Address | Dist | Beds/Ba | Sqft | Sold | Price | $/sf | Match |
|---|---|---|---|---|---|---|---|
| 104 Beard Dr | 0.18mi | 3/2.5 (-1) | 1,562 (-2%) | 3mo | $130,000 | $83 | 80 |
| 605 S Files St | 0.16mi | 3/2.0 (-1) | 1,670 (+4%) | 4mo | $224,900 | $135 | 75 |
| 512 Don Ln | 0.02mi | 3/2.0 (-1) | 1,501 (-6%) | 8mo | $249,900 | $166 | 75 |
| 604 E South St | 0.32mi | 3/2.0 (-1) | 1,534 (-4%) | 3mo | $249,999 | $163 | 69 |
| 526 Don Ln | 0.07mi | 4/2.0 | 1,401 (-12%) | 10mo | $182,990 | $131 | 66 |
| 106 Don Ln | 0.08mi | 3/2.0 (-1) | 1,400 (-12%) | 13mo | $225,000 | $161 | 57 |
| 205 E South St | 0.33mi | 3/2.0 (-1) | 1,462 (-9%) | 7mo | $219,900 | $150 | 57 |
| 104 Don Ln | 0.08mi | 3/2.0 (-1) | 1,400 (-12%) | 14mo | $225,000 | $161 | 56 |
| 202 E Henderson St | 0.39mi | 3/2.0 (-1) | 1,485 (-7%) | 13mo | $198,000 | $133 | 52 |
| 105 E North St | 0.69mi | 3/2.0 (-1) | 1,500 (-6%) | 2mo | $158,000 | $105 | 49 |
| 705 E South St | 0.40mi | 3/2.0 (-1) | 1,430 (-11%) | 10mo | $214,900 | $150 | 48 |
| 103 S Hooks St | 0.59mi | 3/2.0 (-1) | 1,416 (-12%) | 12mo | $282,000 | $199 | 36 |
Match score weights: distance 35% · size 25% · config 20% · recency 20%. Top-matched comps best support the ARV.
Projected returns pro-forma
10.0% appreciation · 3.0% rent growth · sell at horizon
- IRR
- 23.7%
- Equity multiple
- 2.91×
- Total profit
- $107,785
- Equity at exit
- $181,969
- IRR
- 21.1%
- Equity multiple
- 6.64×
- Total profit
- $319,231
- Equity at exit
- $392,422
Cash invested: $56,557 (down + closing). Projections, not guarantees.
Landlord ↔ Tenant lean methodology
- Overall (STATE)
- 87 Strongly Landlord-Friendly
- State Texas
- 87 Strongly Landlord-Friendly · R+5
- County
- — inherits STATE
- City
- — inherits STATE
ZIP-level market 76055
- Home prices YoY
- 4.1%
- Active inventory
- 83
- Price-to-rent
- 9.8×
Monthly cashflow live
- Estimated rent
- $1,722 medium interval (Pro) →
- Mortgage (P&I)
- −$1,059
- Tax est. 1.5%
- −$252 /mo · $3,030/yr
- Insurance
- −$84
- HOA
- −$0
- Vacancy / Maint / Mgmt
- −$362
- Net cashflow
- $-35
Break-even live
UW: 25.0% down · 7.5% · 30yr · 1.5% tax · 5.0% vac · 8.0% maint · 8.0% mgmt
Financing live
Cash to close
- Down payment
- $50,498
- Closing costs
- $6,060
- Reserves months
- —
- Total cash needed
- —
Loan-product check · same deal, 3 products live
Conventional
25% down · 7.5% · 30yr
- Down + closing
- —
- Monthly P&I
- —
- Monthly cashflow
- —
- DSCR
- —
- Eligible?
- —
Personal DTI + credit; lowest rate.
DSCR
20% down · 8.5% · 30yr
- Down + closing
- —
- Monthly P&I
- —
- Monthly cashflow
- —
- DSCR
- —
- Eligible?
- —
No personal income docs; deal must DSCR.
Hard money
10% down · 12.0% · 12mo
- Down + closing
- —
- Monthly P&I
- —
- Monthly cashflow
- —
- DSCR
- —
- Eligible?
- —
Short-term bridge; refi at stabilization.
Rent comps 4 comps
| Address | Beds | Baths | Sqft | Rent | $/sqft | DOM | Units | Dist |
|---|---|---|---|---|---|---|---|---|
| 111 Minnie Dr Itasca, TX | 3.0 | 2.0 | 1250 | $1,775 | $1.42 | 43d | 1 | 0.26mi |
| 202 E Henderson St Itasca, TX | 3.0 | 2.0 | 1485 | $1,750 | $1.18 | 11d | 1 | 0.36mi |
| 108 E Adams St Itasca, TX | 3.0 | 2.0 | 1188 | $1,650 | $1.39 | 43d | 1 | 0.43mi |
| 106 W Adams St Itasca, TX | 3.0 | 2.0 | 1174 | $1,650 | $1.41 | 43d | 1 | 0.51mi |
Listing history 24 events
-
2026-06-18days on market $201,990 Active 190 DOM
-
2026-06-17days on market $201,990 Active 189 DOM
-
2026-06-16days on market $201,990 Active 188 DOM
-
2026-06-15days on market $201,990 Active 187 DOM
-
2026-06-13days on market $201,990 Active 185 DOM
-
2026-06-12days on market $201,990 Active 184 DOM
-
2026-06-10days on market $201,990 Active 181 DOM
-
2026-06-08days on market $201,990 Active 180 DOM
-
2026-06-08days on market $201,990 Active 179 DOM
-
2026-06-05days on market $201,990 Active 177 DOM
-
2026-06-03days on market $201,990 Active 175 DOM
-
2026-06-02days on market $201,990 Active 174 DOM
-
2026-06-01days on market $201,990 Active 173 DOM
-
2026-05-31days on market $201,990 Active 172 DOM
-
2026-05-14price $209,990 866-char remark
Show marketing remark (28 chars)
Model 1600-1 A1 - Everglades
-
2026-05-14price $209,990 28-char remark
Show marketing remark (28 chars)
Model 1600-1 A1 - Everglades
-
2026-04-03price $226,990 866-char remark
Show marketing remark (28 chars)
Model 1600-1 A1 - Everglades
-
2026-04-03price $226,990 28-char remark
Show marketing remark (28 chars)
Model 1600-1 A1 - Everglades
-
2026-03-31price $222,990 866-char remark
Show marketing remark (28 chars)
Model 1600-1 A1 - Everglades
-
2026-03-31price $222,990 28-char remark
Show marketing remark (28 chars)
Model 1600-1 A1 - Everglades
-
2026-03-31price $223,990 28-char remark
Show marketing remark (28 chars)
Model 1600-1 A1 - Everglades
-
2025-12-12price $222,211 28-char remark
Show marketing remark (28 chars)
Model 1600-1 A1 - Everglades
-
2025-12-10$442,201 Active 28-char remark
Show marketing remark (866 chars)
MLS# 21130140 - Built by NHC - Jul 2026 completion! ~ Model 1600-1 A1 - Everglades The Everglades Plan from our Freedom Series offers an ideal blend of space, functionality, and value. This charming 2-story home features 4 bedrooms, 2.5 bathrooms, a 1-car garage, and 1,600 square feet of thoughtfully designed living space. Step into the welcoming entryway, where you’ll find a convenient half bathroom and the staircase leading to the upper level. Continue down the hall past the laundry room and into the open-concept living area. The kitchen, complete with a central island, overlooks the dining area and family room, creating a perfect space for meals and family time. Upstairs, the primary suite offers a private retreat with its own bathroom. Three additional bedrooms and a full bathroom complete the upper level, providing ample space for guests.
-
2025-12-10$222,211 Active 866-char remark
Show marketing remark (866 chars)
MLS# 21130140 - Built by NHC - Jul 2026 completion! ~ Model 1600-1 A1 - Everglades The Everglades Plan from our Freedom Series offers an ideal blend of space, functionality, and value. This charming 2-story home features 4 bedrooms, 2.5 bathrooms, a 1-car garage, and 1,600 square feet of thoughtfully designed living space. Step into the welcoming entryway, where you’ll find a convenient half bathroom and the staircase leading to the upper level. Continue down the hall past the laundry room and into the open-concept living area. The kitchen, complete with a central island, overlooks the dining area and family room, creating a perfect space for meals and family time. Upstairs, the primary suite offers a private retreat with its own bathroom. Three additional bedrooms and a full bathroom complete the upper level, providing ample space for guests.
ⓘ Source: listings_history table (triggers on properties + properties_extension) + one-shot
backfill from property_details.listing_events for pre-trigger history.
Nearby sold comps map
Loading sold comps map…
Walkable amenities ~0.75 mi
Loading nearby amenities…
Taxation est. · year 1
- Rental income
- $20,667
- − Mortgage interest
- −$11,315
- − Property taxes
- −$3,030
- − Insurance
- −$1,010
- − Repairs & maintenance
- −$1,653
- − Management
- −$1,653
- − Depreciation
- −$5,876
- Taxable loss
- −$3,870
- Est. tax savings @ 24.0%
- +$929
- After-tax cash flow
- $505/yr
For passive investors: Depreciation is non-cash, so a rental often shows a tax loss while cash-flowing — sheltering income. Rental losses are passive: they offset passive income freely, and up to $25,000/yr can offset ordinary (W-2) income if you actively participate and your MAGI is under $100k (phasing out to $0 by $150k); unused losses carry forward. On sale, claimed depreciation is recaptured at up to 25%, and gains may owe capital-gains tax (a 1031 exchange can defer both). Figures are a year-1 estimate at your 24.0% rate — not tax advice; consult a CPA.
Condition & rehab AI · 12 photos
This home is in excellent condition with a fresh paint job and modern finishes. It's move-in ready and ready for a smart home upgrade to add value.
Value-add opportunities
- Both Painting the exterior and interior walls — Fresh paint enhances curb appeal and interior aesthetics
- Both Landscaping improvements — Enhances curb appeal and adds value
- Both Adding smart home features — Improves convenience and adds value
- Both Upgrading appliances — Modernizes the kitchen and adds value
Renovation cost estimate screening
Value-add ROI direction
- Both Painting the exterior and interior walls — Fresh paint enhances curb appeal and interior aesthetics ↑
- Both Landscaping improvements — Enhances curb appeal and adds value ↑
- Both Adding smart home features — Improves convenience and adds value ↑
- Both Upgrading appliances — Modernizes the kitchen and adds value ↑
ⓘ Cost ranges are severity-bucket heuristics (US national rule-of-thumb). Get contractor quotes + a written scope before underwriting a rehab budget.
Schools (NCES district)
- District
- Itasca ISD
- NCES district ID
- 4824480
- Math proficiency
- 23% ▼ -8.00%
- Reading proficiency
- 35% ▼ -1.00%
- Median HH income
- $49,224
- Composite
- 25.26/100
- National rank
- #7499
- State rank
- #636 of 826 in TX
Livability — Itasca
- Score
- 63/100
- State rank
- #832
- US rank
- #14977
Category grades
Schools grade is shown separately in the Schools card above.
Census & demographics
- Census place
- Itasca, TX
- City population
- 3,719
- Population (ZIP)
- 3,719
Population outlook (Hill County) Hauer SSP2
- Today (2025)
- 34,013 people
- By 2030
- 33,289 · -2.1%
- By 2040
- 31,688 · -6.8%
- By 2050
- 30,100 · -11.5%
- By 2075
- 26,818 · -21.2%
- By 2100
- 22,918 · -32.6%
Race, ethnicity, and origin ACS 2023
- Neighborhood character
- Majority White (60%)
- Race & ethnicity
- White 60% Hispanic / Latino 30% Two or more races 9% Black 6%
- Hispanic origin (detail)
- Mexican 29%
- Common ancestry
- Lithuanian 2% Slovak 1% Italian 1%
- Foreign-born
- 5% · Canada
- Languages at home
- 87% English-only · Spanish 11% German/W. Germanic 1% French/Haitian/Cajun 1%
Political lean MEDSL · Hill
- 2024 margin
- Solid R (+64.4) · D 17.5% · R 81.8%
- 2008→2024 swing
- -23.0pp toward R · 2008: -41.4pp · 2024: -64.4pp
- All cycles
- 2024: R+64.4 2020: R+60.7 2016: R+58.4 2012: R+53.0 2008: R+41.4
Not yet ingested
- Civics
- —
Market trends
- HPI YoY
- ▲ 10.37%
- Current HPI
- 264.5221
- Rent YoY
- —
- Metro
- —
- State GDP YoY
- ▲ 3.95%
- F500 in state
- 110
Industry mix (Fortune 500 HQ in TX)
| Industry | F500 HQs | Revenue |
|---|---|---|
| Energy | 16 | $1,198B |
|
||
| Technology | 5 | $198B |
|
||
| Engineering / Construction | 4 | $72B |
|
||
| Energy Services | 3 | $60B |
|
||
| Utilities | 3 | $41B |
|
||
| Healthcare | 2 | $330B |
|
||
Price history
-5.5% since first listed10 events — show timeline
- 2026-05-14 Price Changed $209,990 NTREIS
- 2026-05-14 Price Changed $209,990 Zillow
- 2026-04-03 Price Changed $226,990 NTREIS
- 2026-04-03 Price Changed $226,990 Zillow
- 2026-03-31 Price Changed $222,990 NTREIS
- 2026-03-31 Price Changed $222,990 Zillow
- 2026-03-31 Price Changed $223,990 Zillow
- 2025-12-12 Price Changed $222,211 Zillow
- 2025-12-10 Listed $442,201 Zillow
- 2025-12-10 Listed $222,211 NTREIS
Cash-flow waterfall
monthlySold comps — $/sqft
last 12 mo · ≤1 miLoading sold comps…