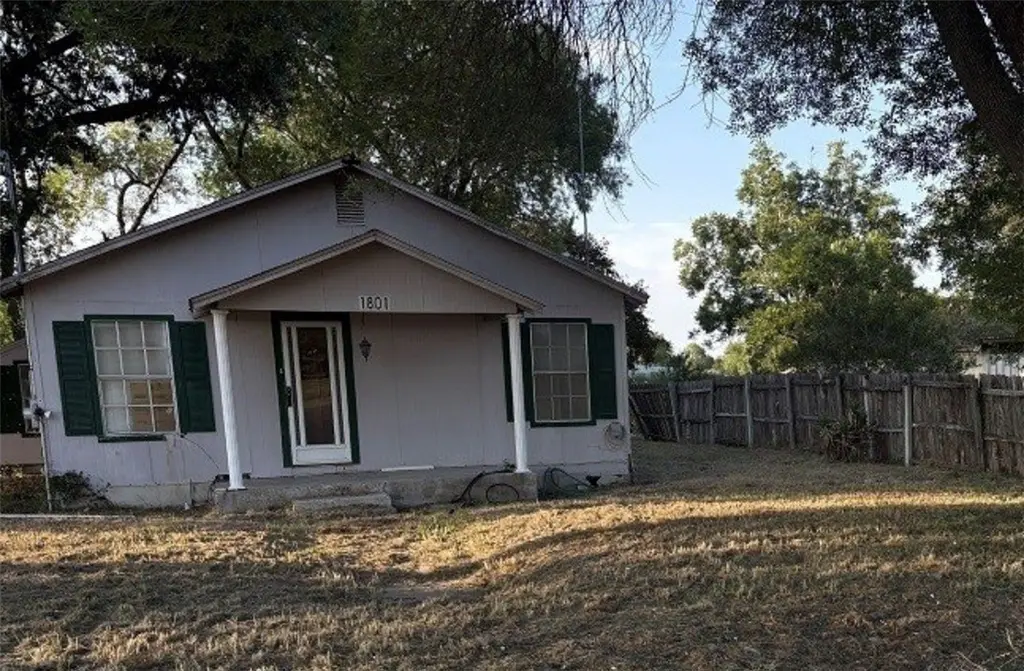
1801 E Highway 285 · Airport Road Addition, TX
Flood risk 5/10 · Moderate
- FEMA flood zone
- X (unshaded)
- Chance of flooding over 30 yrs
- 0.67%
- Est. flood insurance / yr
- $507 – $1,088
Fire risk 8/10 · Major
- Est. fire insurance / yr
- $1,222 – $2,270
Heat risk 9/10 · Severe
- Hot days now (above 114°F)
- 7 days/yr
- Hot days in 30 yrs
- 20 days/yr
Wind risk 9/10 · Severe
- Chance of severe wind over 30 yrs
- 99.0%
Air-quality risk 1/10 · Minimal
- Unhealthy air days now
- 0 days/yr
- Unhealthy air days in 30 yrs
- 0 days/yr
Risk factors via First Street. Map © Google.
Why this score? — see what drove the B grade
The composite is a weighted blend of 9 inputs, each scored 0–100. Each bar is that input's sub-score; the figure is the points it added to the 100-point composite (weight × sub-score).
- Cash flow +30.0/30.0
- 1% rule +10.0/10.0
- DSCR +10.0/10.0
- ARV discount +7.5/15.0
- Appreciation +5.2/10.0
- Livability +3.2/5.0
- Rent growth +2.5/5.0
- Condition / age +2.2/5.0
- Schools +1.7/10.0
$59,000
🖨 Deal sheet 📄 Offer letter ✓ Due diligence
Listing remarks MLS
Large lot with trees. Possible owner finance on this 3/1. City water and sewer.
Key facts
- Large lot
- City water
- City sewer
Tags
Neighborhood map
What this means for you Summary
Snapshot
- This is a 3-bed/1.0-bath single-family listed at $59k. Condition is rated fair.
Deal economics
- At list price, monthly cash flow is $528 ($6k/yr) — positive.
- The deal already cash-flows at list — no discount required.
- Meets the 1% rule at list price ($1k rent vs $59k).
- Recommended offer: $54k (9.0% below list) — sets the bar for market timing.
Location & tenants
- Location reads 65/100 on livability (#669 in TX) — a middle-class / working-renter tenant base. Strengths: employment A+, cost of living A+, housing A+; Watch: health & safety C-, schools F, crime F.
- Brooks County ISD (town): math 19% / reading 26% proficiency, ranked #776 of 826 in TX (top 94%) — low school quality limits family demand, transient renter base, plan for 1-2y turnover; only 19% free/reduced lunch — higher-income household profile.
- Market conditions: 42 active listings in the ZIP.
Forward outlook
- In year one you build about $696 of equity ($408 loan paydown + $288 appreciation (0.5% local appreciation)).
- At projected returns (0.5% appreciation + 3.0% rent growth), your $17k cash investment doubles in ~3 years — after that, you're playing with house money.
Negotiation context
- It's been on market 112 days — a 9% lower offer ($54k) is reasonable based on typical stale-listing flexibility.
- 2 sale attempts with the ask held roughly flat each time — persistent listings suggest the price (not the market) is what's stuck; bring a comps-based counter.
- Current owner paid $50k; 17% above their basis — modest negotiation headroom, anchor on the comps not their cost.
Risks & watch-outs
- Climate carrying-cost: moderate flood risk; severe wind risk, 99% chance of damaging wind over 30y; severe wildfire risk; extreme-heat days projected 7→20/yr by 2055 (HVAC capex compounding) — expect insurance premiums to compound above CPI over the hold.
Questions for the listing agent
- It's been on market 112 days. Have you received any prior offers? Is the seller open to a 9% concession, seller financing, or rate buy-down credit?
- Have any recent inspections been done? Can we get a copy of the seller's disclosures and any deferred-maintenance estimates?
- Built in 1970 — when were the roof, HVAC, electrical panel, plumbing, and water heater last replaced?
- Why hasn't it sold? Are there any deal-killer items the seller is aware of (foundation, flood, title, zoning, code violations)?
- Is there a deadline driving the sale (1031 exchange, divorce, estate, relocation)? That informs how much negotiation room exists.
- Schools are F-rated, which usually means shorter tenancies and higher turnover. Who's the typical renter profile here, and what's been the actual vacancy rate?
- Crime grade is F in this area — have there been break-ins, vandalism, or insurance claims at this property in the last 3 years? What carrier currently insures it and at what premium?
- What's the average days-on-market for RENTAL listings here right now (not sales)? A rising rental-DOM trend means longer vacancies and softer asking-rent achievability than the comps imply.
- What's the recent tenant-quality profile in this submarket — average credit score on applications, eviction rate, late-payment / NSF rate, and stable-employment percentage? A property-management company in the area should have these aggregated.
- How much new for-sale + rental construction is in the pipeline within 1–3 miles? Heavy new supply typically softens prices + rents 12–24 months out; constrained supply supports both.
Investment metrics
- 1% rule
- 2.03% ✓
- Cap rate
- 17.03%
- Cash-on-cash
- 38.34%
- DSCR
- 2.71
- GRM
- 4.1
CMA / ARV
- ARV (median comp)
- $185,000
- List price
- $59,000
- Delta
- -68.11%
- Verdict
- UNDERPRICED
- Comps
- 3 within 1.0 mi
Show comp detail 1 sale within ~0.75 mi
| Address | Dist | Beds/Ba | Sqft | Sold | Price | $/sf | Match |
|---|---|---|---|---|---|---|---|
| 513 County Road 205 | 0.62mi | 3/2.0 | 1,351 (-3%) | 2mo | $185,000 | $137 | 60 |
Match score weights: distance 35% · size 25% · config 20% · recency 20%. Top-matched comps best support the ARV.
Projected returns pro-forma
0.49% appreciation · 3.0% rent growth · sell at horizon
- IRR
- 40.1%
- Equity multiple
- 3.01×
- Total profit
- $33,282
- Equity at exit
- $18,587
- IRR
- 42.6%
- Equity multiple
- 5.94×
- Total profit
- $81,689
- Equity at exit
- $23,540
Cash invested: $16,520 (down + closing). Projections, not guarantees.
Landlord ↔ Tenant lean methodology
- Overall (STATE)
- 87 Strongly Landlord-Friendly
- State Texas
- 87 Strongly Landlord-Friendly · R+5
- County
- — inherits STATE
- City
- — inherits STATE
ZIP-level market 78355
- Home prices YoY
- 0.6%
- Active inventory
- 42
- Price-to-rent
- 4.1×
Monthly cashflow live
- Estimated rent
- $1,199 medium interval (Pro) →
- Mortgage (P&I)
- −$309
- Tax from tax record
- −$86 /mo · $1,030/yr
- Insurance
- −$25
- HOA
- −$0
- Vacancy / Maint / Mgmt
- −$252
- Net cashflow
- $528
Break-even live
UW: 25.0% down · 7.5% · 30yr · 1.5% tax · 5.0% vac · 8.0% maint · 8.0% mgmt
Financing live
Cash to close
- Down payment
- $14,750
- Closing costs
- $1,770
- Reserves months
- —
- Total cash needed
- —
Loan-product check · same deal, 3 products live
Conventional
25% down · 7.5% · 30yr
- Down + closing
- —
- Monthly P&I
- —
- Monthly cashflow
- —
- DSCR
- —
- Eligible?
- —
Personal DTI + credit; lowest rate.
DSCR
20% down · 8.5% · 30yr
- Down + closing
- —
- Monthly P&I
- —
- Monthly cashflow
- —
- DSCR
- —
- Eligible?
- —
No personal income docs; deal must DSCR.
Hard money
10% down · 12.0% · 12mo
- Down + closing
- —
- Monthly P&I
- —
- Monthly cashflow
- —
- DSCR
- —
- Eligible?
- —
Short-term bridge; refi at stabilization.
Listing history 23 events
-
2026-06-18days on market $59,000 Active 112 DOM
-
2026-06-17days on market $59,000 Active 111 DOM
-
2026-06-16days on market $59,000 Active 110 DOM
-
2026-06-15days on market $59,000 Active 109 DOM
-
2026-06-13days on market $59,000 Active 107 DOM
-
2026-06-12days on market $59,000 Active 106 DOM
-
2026-06-09days on market $59,000 Active 103 DOM
-
2026-06-08days on market $59,000 Active 102 DOM
-
2026-06-08days on market $59,000 Active 101 DOM
-
2026-06-07days on market $59,000 Active 100 DOM
-
2026-06-03days on market $59,000 Active 97 DOM
-
2026-06-02days on market $59,000 Active 96 DOM
-
2026-06-01days on market $59,000 Active 95 DOM
-
2026-05-31days on market $59,000 Active 94 DOM
-
2026-02-26$59,000 Active 79-char remark
Show marketing remark (79 chars)
Large lot with trees. Possible owner finance on this 3/1. City water and sewer.
-
2026-01-17status Pending
-
2025-12-17price $29,900
-
2025-12-04price $39,900
-
2025-10-07price $49,900
-
2025-08-29price $59,900
-
2025-07-31price $69,900
-
2025-06-30$74,900 Active
-
2024-12-16soldstatus $50,256
ⓘ Source: listings_history table (triggers on properties + properties_extension) + one-shot
backfill from property_details.listing_events for pre-trigger history.
Tax reassessment forecast TX · Resets to sale price
- Current annual tax
- $1,030 · $86/mo
- Projected year-2 tax
- $1,080 · $90/mo
- Expected delta
- +$50/yr (+$4/mo · 4.9%)
ⓘ Screening estimate from a state-policy table — verify with the county assessor before closing.
Climate risk First Street
- Flood 5/10 Major FEMA zone X (unshaded) · 67% chance over 30 yrs
- Wildfire 8/10 Severe
- Heat 9/10 Extreme 7 d/yr ≥114°F today · 20 d/yr by 30 yrs out
- Wind 9/10 Extreme 99% chance of damaging wind over 30 yrs
- Air quality 1/10 Low 0 unhealthy d/yr today · 0 by 30 yrs out
Nearby sold comps map
Loading sold comps map…
Walkable amenities ~0.75 mi
Loading nearby amenities…
Taxation est. · year 1
- Rental income
- $14,394
- − Mortgage interest
- −$3,305
- − Property taxes
- −$1,030
- − Insurance
- −$295
- − Repairs & maintenance
- −$1,151
- − Management
- −$1,151
- − Depreciation
- −$1,716
- Taxable income
- $5,745
- Est. tax owed @ 24.0%
- −$1,379
- After-tax cash flow
- $4,955/yr
For passive investors: Depreciation is non-cash, so a rental often shows a tax loss while cash-flowing — sheltering income. Rental losses are passive: they offset passive income freely, and up to $25,000/yr can offset ordinary (W-2) income if you actively participate and your MAGI is under $100k (phasing out to $0 by $150k); unused losses carry forward. On sale, claimed depreciation is recaptured at up to 25%, and gains may owe capital-gains tax (a 1031 exchange can defer both). Figures are a year-1 estimate at your 24.0% rate — not tax advice; consult a CPA.
Condition & rehab AI · 12 photos
This home requires moderate renovations to improve its curb appeal and interior condition, with a focus on exterior siding, interior walls, and flooring. Updates will significantly increase its resale and rental value.
Repairs flagged
- Moderate exterior siding — Visible wear and tear
- Major interior walls — Paint peeling and worn condition
- Moderate kitchen cabinets — Older style, could be updated
Value-add opportunities
- Resale Paint exterior siding — Enhances curb appeal
- Rental Replace worn carpet — Improves comfort and appearance
- Both Paint interior walls — Enhances overall appearance and value
Renovation cost estimate screening
| Repair item | Severity | Est. cost |
|---|---|---|
| exterior siding · Visible wear and tear | Moderate | $3,000–15,000 |
| interior walls · Paint peeling and worn condition | Major | $15,000–50,000 |
| kitchen cabinets · Older style, could be updated | Moderate | $3,000–15,000 |
| Total estimated repair cost · 3 items | $21,000–80,000 |
Value-add ROI direction
- Resale Paint exterior siding — Enhances curb appeal ↑
- Rental Replace worn carpet — Improves comfort and appearance ↑
- Both Paint interior walls — Enhances overall appearance and value ↑
ⓘ Cost ranges are severity-bucket heuristics (US national rule-of-thumb). Get contractor quotes + a written scope before underwriting a rehab budget.
Schools (NCES district)
- District
- Brooks County ISD
- NCES district ID
- 4811580
- Math proficiency
- 19% ▼ -16.00%
- Reading proficiency
- 26% ▼ -6.00%
- Median HH income
- $23,562
- Composite
- 17.44/100
- National rank
- #9064
- State rank
- #776 of 826 in TX
Livability — Airport Road Addition
- Score
- 65/100
- State rank
- #669
- US rank
- #12564
Category grades
Schools grade is shown separately in the Schools card above.
Census & demographics
- Population (ZIP)
- 6,843
Population outlook (Brooks County) Hauer SSP2
- Today (2025)
- 7,122 people
- By 2030
- 7,090 · -0.4%
- By 2040
- 7,023 · -1.4%
- By 2050
- 6,954 · -2.4%
- By 2075
- 6,413 · -10.0%
- By 2100
- 5,296 · -25.6%
Race, ethnicity, and origin ACS 2023
- Neighborhood character
- Predominantly Hispanic (91%)
- Race & ethnicity
- Hispanic / Latino 91% Two or more races 38% White 8%
- Hispanic origin (detail)
- Mexican 82%
- Common ancestry
- Lithuanian 5% Iranian 1%
- Foreign-born
- 7% · Canada
- Languages at home
- 30% English-only · Spanish 70%
Political lean MEDSL · Brooks
- 2024 margin
- Lean D (+9.6) · D 54.5% · R 44.8%
- 2008→2024 swing
- -42.0pp toward R · 2008: 51.6pp · 2024: 9.6pp
- All cycles
- 2024: D+9.6 2020: D+19.0 2016: D+51.0 2012: D+57.4 2008: D+51.6
Not yet ingested
- Civics
- —
Market trends
- HPI YoY
- ▲ 0.49%
- Current HPI
- 78.6241
- Rent YoY
- —
- Metro
- —
- State GDP YoY
- ▲ 3.95%
- F500 in state
- 110
Industry mix (Fortune 500 HQ in TX)
| Industry | F500 HQs | Revenue |
|---|---|---|
| Energy | 16 | $1,198B |
|
||
| Technology | 5 | $198B |
|
||
| Engineering / Construction | 4 | $72B |
|
||
| Energy Services | 3 | $60B |
|
||
| Utilities | 3 | $41B |
|
||
| Healthcare | 2 | $330B |
|
||
Price history
+17.4% since first listed9 events — show timeline
- 2026-02-26 Listed $59,000 CBMLS
- 2026-01-17 Pending — CBMLS
- 2025-12-17 Price Changed $29,900 CBMLS
- 2025-12-04 Price Changed $39,900 CBMLS
- 2025-10-07 Price Changed $49,900 CBMLS
- 2025-08-29 Price Changed $59,900 CBMLS
- 2025-07-31 Price Changed $69,900 CBMLS
- 2025-06-30 Listed $74,900 CBMLS
- 2024-12-16 Sold (Public Records) $50,256 Public Records
Cash-flow waterfall
monthlySold comps — $/sqft
last 12 mo · ≤1 miLoading sold comps…