 🏗️ New Construction
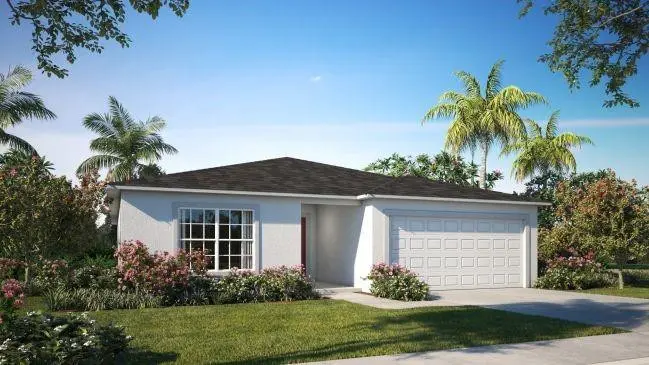
2505 SW Grotto Cir · Port St. Lucie, FL
Flood risk 1/10 · Minimal
- FEMA flood zone
- X (unshaded)
- Chance of flooding over 30 yrs
- 0.0%
- Est. flood insurance / yr
- $507 – $1,088
Fire risk 1/10 · Minimal
- Est. fire insurance / yr
- $947 – $1,759
Heat risk 10/10 · Severe
- Hot days now (above 106°F)
- 7 days/yr
- Hot days in 30 yrs
- 25 days/yr
Wind risk 10/10 · Severe
- Chance of severe wind over 30 yrs
- 99.0%
Air-quality risk 1/10 · Minimal
- Unhealthy air days now
- 0 days/yr
- Unhealthy air days in 30 yrs
- 0 days/yr
Risk factors via First Street. Map © Google.
Why this score? — see what drove the F grade
The composite is a weighted blend of 9 inputs, each scored 0–100. Each bar is that input's sub-score; the figure is the points it added to the 100-point composite (weight × sub-score).
- Cash flow +10.6/30.0
- ARV discount +7.5/15.0
- Schools +3.7/10.0
- DSCR +3.1/10.0
- Rent growth +2.6/5.0
- Livability +2.5/5.0
- Condition / age +2.5/5.0
- 1% rule +1.8/10.0
- Appreciation +0.0/10.0
$439,900
🖨 Deal sheet 📄 Offer letter ✓ Due diligence
Listing remarks
Pre-Construction. To be built. Set in the heart of Port St. Lucie, a growing city along Florida's Treasure Coast, this location is known for its residential charm, outdoor recreation, and access to the St. Lucie River, along with nearby PGA Village and New York Mets spring training at Clover Park. A warm, subtropical climate carries throughout the year, perfectly complementing the design of the Marigold. This thoughtfully crafted home captures that Florida lifestyle with a balance of style, comfort, and flexibility. The foyer opens into an expansive layout where the great room creates a natural gathering space suited for both entertaining and everyday living. At the center, the kitchen feat
Key facts
- Expansive layout
- Large island
- Great room
Tags
Property features AI
Exterior
- Parking: Attached 2-car garage; Driveway; 2 covered parking spaces
- Security: Smoke detector(s)
- Utilities: Public water; Private sewer; Cable available; Electric service
- Home design: Single family residence, one story; First-floor entry; Faces southeast; To be built
- Construction: Built with block and stucco; Composition/shingle roof; Slab foundation; Builder: Maronda Homes (Marigold A model); Living area approximately 1,876; Total building area approximately 2,358
- Exterior features: Open patio; Patio
Interior
- Kitchen: Dishwasher; Electric range; Microwave; Garbage disposal; Electric water heater
- Bedrooms: Four bedrooms on the main level
- Flooring: Carpet; Ceramic tile
- Bathrooms: Two full bathrooms on the main level
- Heating & cooling: Central electric heating; Central electric cooling (central air)
- Interior features: Entrance foyer; Kitchen island; Walk-in closets; Insulated windows; Smoke detector(s)
- Laundry & utility: Laundry room with washer and dryer hookups (electric dryer hookup)
Neighborhood map
What this means for you Summary
Snapshot
- This is a 4-bed/2.0-bath land listed at $440k.
Deal economics
- At list price, monthly cash flow is $-218 ($-3k/yr) — negative.
- To cash-flow at today's rent, offer at most $401k (8.8% below list).
- To meet the 1% rule (rent ≥ 1% of price), the offer needs to be $301k (31.6% below list).
- Recommended offer: $301k (31.6% below list) — sets the bar for 1% rule.
- Cap rate 5.7% vs local median 3.9% in Port St. Lucie — top-decile yield for the area; either an underpriced asset or a hidden risk that comps aren't pricing in. Stress-test before assuming the spread holds.
Location & tenants
- Location reads: area grade F — affects rentability + tenant quality, not the cash-flow math above.
- St. Lucie (urban): math 40% / reading 48% proficiency, ranked #51 of 73 in FL (top 70%) — families likely to look elsewhere, expect single-tenant / working-renter base with shorter leases.
- Zoned schools: Bayshore Elementary School (math 44% / reading 47%, grade D-, #1,247 of 2,144 statewide, top 59%, 835 students, 70% FRL); Treasure Coast High School (math 28% / reading 50%, grade F, #312 of 667 statewide, top 48%, 3,066 students, 60% FRL).
- Market conditions: Rents flat; 758 active listings in the ZIP; 37 comparable units currently listed for rent nearby; rentals at typical pace (median 24d on market — plan ~3-4 weeks tenant-placement turnaround); solid renter incomes; 4,868 units permitted in St. Lucie County in 2024 (268 in 5+ unit buildings).
- This rent runs 42% of the median local income ($86k/yr) — at the standard rent-burdened threshold; future hikes will face affordability resistance.
Forward outlook
- Local home prices are declining (-3.0%/yr); year-one equity from $3k of loan paydown is wiped out by about $13k of value loss. Plan a longer hold.
- St. Lucie County population projected at +20% by 2050 — long-run rental-demand tailwind backs the buy-and-hold thesis.
Negotiation context
- It's been on market 45 days — a 3% lower offer ($427k) is reasonable based on typical stale-listing flexibility.
- Current owner paid $125k; list at $440k implies a 252% gain — meaningful room to come down on a strong offer.
Risks & watch-outs
- Climate carrying-cost: severe wind risk, 99% chance of damaging wind over 30y; extreme-heat days projected 7→25/yr by 2055 (HVAC capex compounding) — expect insurance premiums to compound above CPI over the hold.
Questions for the listing agent
- What do current leases actually rent for vs. the listed asking? Can we see a recent rent roll and the last 12 months of T-12 income?
- It's been on market 45 days. Have you received any prior offers? Is the seller open to a 32% concession, seller financing, or rate buy-down credit?
- Is there a deadline driving the sale (1031 exchange, divorce, estate, relocation)? That informs how much negotiation room exists.
- The area grade is low — what's the realistic commute time and amenity access for the typical tenant pool here? Any planned neighborhood developments (good or bad) we should know about?
- What's the average days-on-market for RENTAL listings here right now (not sales)? A rising rental-DOM trend means longer vacancies and softer asking-rent achievability than the comps imply.
- What's the recent tenant-quality profile in this submarket — average credit score on applications, eviction rate, late-payment / NSF rate, and stable-employment percentage? A property-management company in the area should have these aggregated.
- How much new for-sale + rental construction is in the pipeline within 1–3 miles? Heavy new supply typically softens prices + rents 12–24 months out; constrained supply supports both.
Investment metrics
- 1% rule
- 0.68% ✗
- Cap rate
- 5.70%
- Cash-on-cash
- -2.13%
- DSCR
- 0.91
- GRM
- 12.2
CMA / ARV
No comps found within radius.
Projected returns pro-forma
-3.0% appreciation · 0.22% rent growth · sell at horizon
- IRR
- -22.5%
- Equity multiple
- 0.24×
- Total profit
- $-93,609
- Equity at exit
- $65,591
- IRR
- -24.3%
- Equity multiple
- -0.07×
- Total profit
- $-132,145
- Equity at exit
- $38,035
Cash invested: $123,172 (down + closing). Projections, not guarantees.
Landlord ↔ Tenant lean methodology
- Overall (STATE)
- 87 Strongly Landlord-Friendly
- State Florida
- 87 Strongly Landlord-Friendly · R+3
- County
- — inherits STATE
- City
- — inherits STATE
ZIP-level market 34953
- Home prices YoY
- -10.1%
- Rents YoY
- 0.2%
- Active inventory
- 758
- Price-to-rent
- 12.2×
Monthly cashflow live
- Estimated rent
- $3,011 high interval (Pro) →
- Mortgage (P&I)
- −$2,307
- Tax from tax record
- −$107 /mo · $1,280/yr
- Insurance
- −$183
- HOA
- −$0
- Vacancy / Maint / Mgmt
- −$632
- Net cashflow
- $-218
Break-even live
UW: 25.0% down · 7.5% · 30yr · 1.5% tax · 5.0% vac · 8.0% maint · 8.0% mgmt
Financing live
Cash to close
- Down payment
- $109,975
- Closing costs
- $13,197
- Reserves months
- —
- Total cash needed
- —
Loan-product check · same deal, 3 products live
Conventional
25% down · 7.5% · 30yr
- Down + closing
- —
- Monthly P&I
- —
- Monthly cashflow
- —
- DSCR
- —
- Eligible?
- —
Personal DTI + credit; lowest rate.
DSCR
20% down · 8.5% · 30yr
- Down + closing
- —
- Monthly P&I
- —
- Monthly cashflow
- —
- DSCR
- —
- Eligible?
- —
No personal income docs; deal must DSCR.
Hard money
10% down · 12.0% · 12mo
- Down + closing
- —
- Monthly P&I
- —
- Monthly cashflow
- —
- DSCR
- —
- Eligible?
- —
Short-term bridge; refi at stabilization.
Rent comps 37 comps
| Address | Beds | Baths | Sqft | Rent | $/sqft | DOM | Units | Dist |
|---|---|---|---|---|---|---|---|---|
| 2617 SW Chestnut Ln Port Saint Lucie, FL | 3.0 | 2.0 | 1457 | $2,675 | $1.84 | 23d | 1 | 0.17mi |
| 2617 SW Chestnut Ln Port Saint Lucie, FL | 3.0 | 2.0 | 2052 | $2,675 | $1.30 | 14d | 1 | 0.17mi |
| 2450 SW Cameo Blvd Unit A Port St. Lucie, FL | 3.0 | 2.0 | 2400 | $2,800 | $1.17 | 14d | 1 | 0.31mi |
| 481 SW Aster Rd Port Saint Lucie, FL | 3.0 | 2.0 | 1499 | $3,000 | $2.00 | 23d | 1 | 0.36mi |
| 332 SW Glenwood Dr Port Saint Lucie, FL | 4.0 | 2.0 | 2176 | $2,400 | $1.10 | 21d | 1 | 0.43mi |
| 518 SW Aster Rd Port Saint Lucie, FL | 4.0 | 2.0 | 1773 | $3,450 | $1.95 | 23d | 1 | 0.44mi |
| 279 SW Glenwood Dr Port Saint Lucie, FL | 3.0 | 2.0 | 1393 | $2,975 | $2.14 | 23d | 1 | 0.52mi |
| 2351 SW Chestnut Ln Unit N/A Port St. Lucie, FL | 3.0 | 2.0 | 1510 | $3,000 | $1.99 | 23d | 1 | 0.58mi |
| 242 SW Amesbury Ave Port Saint Lucie, FL | 3.0 | 2.0 | 2012 | $2,600 | $1.29 | 23d | 1 | 0.63mi |
| 662 SW Sandbar Ter Port Saint Lucie, FL | 4.0 | 2.0 | 1644 | $2,366 | $1.44 | 14d | 1 | 0.70mi |
| 311 SW Homeland Rd Port Saint Lucie, FL | 3.0 | 2.0 | 1395 | $2,200 | $1.58 | 14d | 1 | 0.72mi |
| 2141 SW Bayshore Blvd Port Saint Lucie, FL | 3.0 | 2.0 | 1918 | $3,300 | $1.72 | 14d | 1 | 0.77mi |
| 233 SW Chapman Ave Port Saint Lucie, FL | 3.0 | 2.0 | 1467 | $1,250 | $0.85 | 21d | 1 | 0.77mi |
| 262 SW Crescent Ave Port Saint Lucie, FL | 3.0 | 2.0 | 1482 | $2,600 | $1.75 | 23d | 1 | 0.78mi |
| 375 SW Tulip Blvd Port Saint Lucie, FL | 3.0 | 2.0 | 1365 | $2,100 | $1.54 | 14d | 1 | 0.78mi |
| 172 SW Langfield Ave Port Saint Lucie, FL | 4.0 | 2.0 | 1806 | $2,800 | $1.55 | 23d | 1 | 0.85mi |
| 619 SW Post Ter Port Saint Lucie, FL | 3.0 | 2.0 | 1827 | $2,600 | $1.42 | 23d | 1 | 0.86mi |
| 2174 SW Wayne St Port Saint Lucie, FL | 3.0 | 2.0 | 1463 | $2,370 | $1.62 | 23d | 1 | 0.91mi |
| 2180 SW Cameo Blvd Port Saint Lucie, FL | 4.0 | 2.0 | 1796 | $3,400 | $1.89 | 23d | 1 | 0.92mi |
| 992 SW College Park Rd Port Saint Lucie, FL | 4.0 | 3.0 | 2078 | $2,700 | $1.30 | 23d | 1 | 0.94mi |
| 2928 SE Bella Rd Port Saint Lucie, FL | 3.0 | 2.0 | 2133 | $2,950 | $1.38 | 23d | 1 | 1.10mi |
| 2720 SE Kern Rd Port Saint Lucie, FL | 3.0 | 2.0 | 2357 | $4,500 | $1.91 | 23d | 1 | 1.12mi |
| 1992 SW Brisbane St Port Saint Lucie, FL | 4.0 | 3.0 | 2478 | $4,995 | $2.02 | 23d | 1 | 1.15mi |
| 3183 SW Ann Arbor Rd Port Saint Lucie, FL | 3.0 | 2.0 | 1990 | $3,500 | $1.76 | 23d | 1 | 1.18mi |
| 1941 SW Hampshire Ln Port Saint Lucie, FL | 4.0 | 2.0 | 1908 | $2,600 | $1.36 | 23d | 1 | 1.20mi |
| 2881 SE Nance St Port Saint Lucie, FL | 3.0 | 2.0 | 1703 | $2,600 | $1.53 | 23d | 1 | 1.22mi |
| 2078 SW Idaho Ln Port Saint Lucie, FL | 3.0 | 2.0 | 1800 | $2,361 | $1.31 | 14d | 1 | 1.23mi |
| 426 SW Eastport Cir Port Saint Lucie, FL | 4.0 | 3.0 | 1512 | $2,810 | $1.86 | 14d | 1 | 1.25mi |
| 985 SW Eureka Ave Port Saint Lucie, FL | 5.0 | 2.0 | 1986 | $3,500 | $1.76 | 23d | 1 | 1.29mi |
| 997 SW Eureka Ave Port Saint Lucie, FL | 3.0 | 2.0 | 1986 | $2,600 | $1.31 | 23d | 1 | 1.31mi |
| 350 SW Belmont Cir Port Saint Lucie, FL | 3.0 | 2.0 | 1761 | $1,700 | $0.97 | 23d | 1 | 1.31mi |
| 928 SW John Maccormack Ter Port Saint Lucie, FL | 4.0 | 2.5 | 1802 | $2,800 | $1.55 | 14d | 1 | 1.39mi |
| 1086 SW Eureka Ave Port Saint Lucie, FL | 3.0 | 2.0 | 1508 | $2,600 | $1.72 | 14d | 1 | 1.42mi |
| 2249 SE Glover St Port Saint Lucie, FL | 3.0 | 2.0 | 1401 | $2,500 | $1.78 | 21d | 1 | 1.44mi |
| 2820 SE Pace Dr Port Saint Lucie, FL | 3.0 | 2.0 | 1755 | $2,750 | $1.57 | 14d | 1 | 1.45mi |
| 161 SW Grimaldo Ter Port Saint Lucie, FL | 3.0 | 2.0 | 1628 | $2,300 | $1.41 | 21d | 1 | 1.48mi |
| 1782 SW Bayshore Blvd Port Saint Lucie, FL | 4.0 | 3.0 | 2094 | $3,200 | $1.53 | 23d | 1 | 1.50mi |
Listing history 20 events
-
2026-06-18days on market $439,900 Active 45 DOM
-
2026-06-17days on market $439,900 Active 44 DOM
-
2026-06-16days on market $439,900 Active 43 DOM
-
2026-06-15days on market $439,900 Active 42 DOM
-
2026-06-14days on market $439,900 Active 40 DOM
-
2026-06-13days on market $439,900 Active 39 DOM
-
2026-06-10days on market $439,900 Active 37 DOM
-
2026-06-09days on market $439,900 Active 36 DOM
-
2026-06-08days on market $439,900 Active 35 DOM
-
2026-06-07days on market $439,900 Active 34 DOM
-
2026-06-05days on market $439,900 Active 31 DOM
-
2026-06-03days on market $439,900 Active 30 DOM
-
2026-06-02days on market $439,900 Active 29 DOM
-
2026-06-01days on market $439,900 Active 28 DOM
-
2026-05-31days on market $439,900 Active 27 DOM
-
2026-05-30days on market $439,900 Active 26 DOM
-
2026-05-04$439,900 Active
-
2001-08-21soldstatus $125,000
-
2000-04-25soldstatus $6,500
-
1981-05-01soldstatus $5,500
ⓘ Source: listings_history table (triggers on properties + properties_extension) + one-shot
backfill from property_details.listing_events for pre-trigger history.
Tax reassessment forecast FL · Resets to sale price
- Current annual tax
- $1,280 · $107/mo
- Projected year-2 tax
- $3,651 · $304/mo
- Expected delta
- +$2,371/yr (+$198/mo · 185.2%)
ⓘ Screening estimate from a state-policy table — verify with the county assessor before closing.
Climate risk First Street
- Flood 1/10 Low FEMA zone X (unshaded) · 0% chance over 30 yrs
- Wildfire 1/10 Low
- Heat 10/10 Extreme 7 d/yr ≥106°F today · 25 d/yr by 30 yrs out
- Wind 10/10 Extreme 99% chance of damaging wind over 30 yrs
- Air quality 1/10 Low 0 unhealthy d/yr today · 0 by 30 yrs out
Nearby sold comps map
Loading sold comps map…
Walkable amenities ~0.75 mi
Loading nearby amenities…
Taxation est. · year 1
- Rental income
- $36,129
- − Mortgage interest
- −$24,641
- − Property taxes
- −$1,280
- − Insurance
- −$2,200
- − Repairs & maintenance
- −$2,890
- − Management
- −$2,890
- − Depreciation
- −$12,797
- Taxable loss
- −$10,569
- Est. tax savings @ 24.0%
- +$2,537
- After-tax cash flow
- $-83/yr
For passive investors: Depreciation is non-cash, so a rental often shows a tax loss while cash-flowing — sheltering income. Rental losses are passive: they offset passive income freely, and up to $25,000/yr can offset ordinary (W-2) income if you actively participate and your MAGI is under $100k (phasing out to $0 by $150k); unused losses carry forward. On sale, claimed depreciation is recaptured at up to 25%, and gains may owe capital-gains tax (a 1031 exchange can defer both). Figures are a year-1 estimate at your 24.0% rate — not tax advice; consult a CPA.
Schools (NCES district)
- District
- St. Lucie
- NCES district ID
- 1201770
- Math proficiency
- 40% ▼ -11.00%
- Reading proficiency
- 48% ▼ -4.00%
- Median HH income
- $44,737
- Composite
- 37.28/100
- National rank
- #4449
- State rank
- #51 of 73 in FL
Livability — Port St. Lucie
No livability data for this city. (Only ~50 U.S. cities are tracked.)
Census & demographics
- Census place
- Port St. Lucie, FL
- County
- Saint Lucie County · 337,150 people
- City population
- 221,051
- Metro
- Port St. Lucie, FL
- Population (ZIP)
- 86,875
- Household income
- $85,667
- Rent vs Own
- Severe rent burden
- 857.0
Population outlook (St. Lucie County) Hauer SSP2
- Today (2025)
- 338,016 people
- By 2030
- 355,687 · +5.2%
- By 2040
- 385,521 · +14.1%
- By 2050
- 406,106 · +20.1%
- By 2075
- 441,054 · +30.5%
- By 2100
- 436,885 · +29.2%
Race, ethnicity, and origin ACS 2023
- Neighborhood character
- Diverse neighborhood (Simpson 0.69)
- Race & ethnicity
- White 42% Hispanic / Latino 28% Black 23% Two or more races 15% Asian 2%
- Hispanic origin (detail)
- Mexican 2% Puerto Rican 8% Cuban 4% Dominican 3%
- Common ancestry
- Hispanic 4% Romanian 2% Estonian 2%
- Foreign-born
- 24% · Canada, Jamaica, China
- Languages at home
- 69% English-only · Spanish 19% French/Haitian/Cajun 6% Other Indo-European 3%
Political lean MEDSL · St. Lucie
- 2024 margin
- Lean R (+9.1) · D 45.1% · R 54.2%
- 2008→2024 swing
- -21.2pp toward R · 2008: 12.1pp · 2024: -9.1pp
- All cycles
- 2024: R+9.1 2020: R+1.6 2016: R+2.5 2012: D+7.9 2008: D+12.1
Not yet ingested
- Civics
- —
Market trends
- HPI YoY
- ▼ -44.19%
- Current HPI
- 392.7681
- Rent YoY
- ▲ 0.22%
- Metro
- Port St. Lucie, FL
- State GDP YoY
- ▲ 3.28%
- F500 in state
- 36
Industry mix (Fortune 500 HQ in FL)
| Industry | F500 HQs | Revenue |
|---|---|---|
| Industrial Technology | 2 | $29B |
|
||
| Insurance | 2 | $17B |
|
||
| Retail | 1 | $60B |
|
||
| Technology Distribution | 1 | $58B |
|
||
| Homebuilding | 1 | $35B |
|
||
| Technology Manufacturing | 1 | $35B |
|
||
Price history
+7898.2% since first listed4 events — show timeline
- 2026-05-04 Listed $439,900 Beaches MLS
- 2001-08-21 Sold (Public Records) $125,000 Public Records
- 2000-04-25 Sold (Public Records) $6,500 Public Records
- 1981-05-01 Sold (Public Records) $5,500 Public Records
Property tax history
+13.1%/yrLatest (2025): $1,280 · +19.4% YoY. Source: county tax records.
Cash-flow waterfall
monthlySold comps — $/sqft
last 12 mo · ≤1 miLoading sold comps…