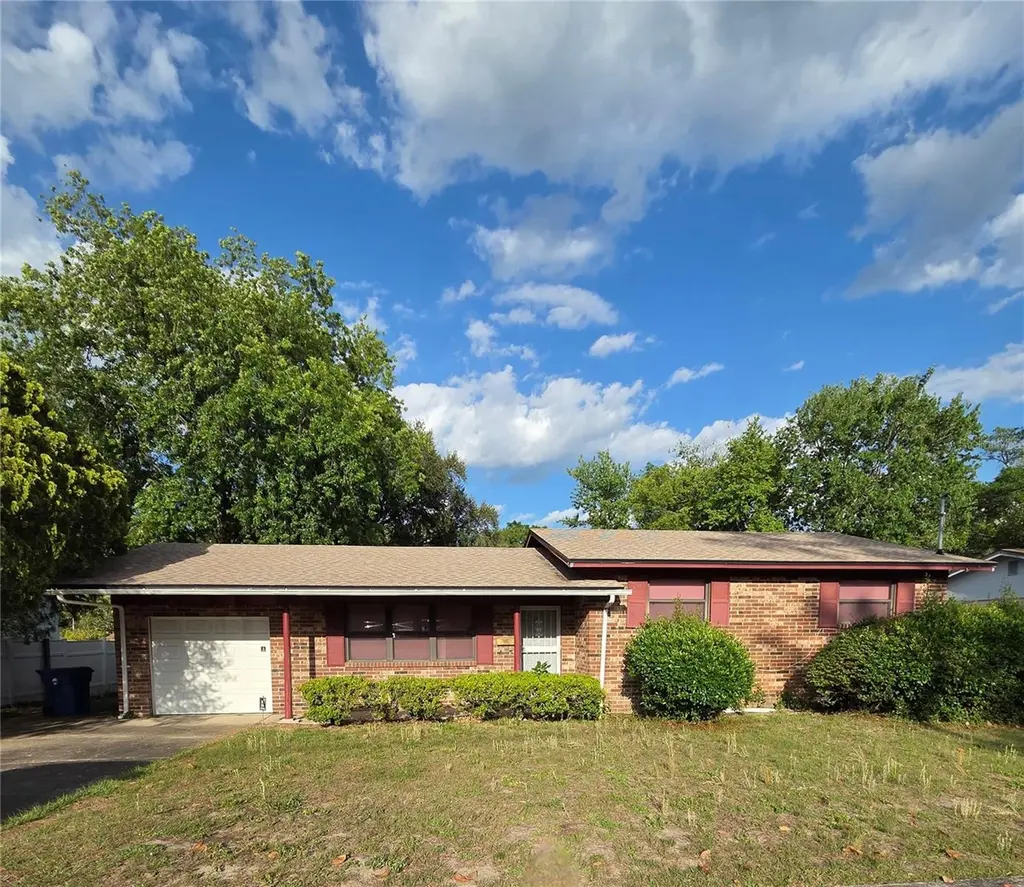
843 Brookview Dr N · Jacksonville, FL
Flood risk 1/10 · Minimal
- FEMA flood zone
- X (unshaded)
- Chance of flooding over 30 yrs
- 0.0%
- Est. flood insurance / yr
- $507 – $1,088
Fire risk 4/10 · Minor
- Est. fire insurance / yr
- $947 – $1,759
Heat risk 9/10 · Severe
- Hot days now (above 107°F)
- 7 days/yr
- Hot days in 30 yrs
- 20 days/yr
Wind risk 9/10 · Severe
- Chance of severe wind over 30 yrs
- 99.0%
Air-quality risk 4/10 · Minor
- Unhealthy air days now
- 4 days/yr
- Unhealthy air days in 30 yrs
- 7 days/yr
Risk factors via First Street. Map © Google.
Why this score? — see what drove the C- grade
The composite is a weighted blend of 9 inputs, each scored 0–100. Each bar is that input's sub-score; the figure is the points it added to the 100-point composite (weight × sub-score).
- Cash flow +15.0/30.0
- ARV discount +15.0/15.0
- DSCR +4.6/10.0
- Livability +4.2/5.0
- Schools +3.9/10.0
- 1% rule +3.0/10.0
- Condition / age +2.5/5.0
- Rent growth +2.1/5.0
- Appreciation +0.0/10.0
$240,000
🖨 Deal sheet (PDF) 📄 Offer letter ✓ Due diligence
Listing remarks
Under contract-accepting backup offers. Step into this solid "GREAT BONES" ranch-style 3-bedroom, 2-bath block home, complete with a garage and a fenced in backyard, perfect for the tiny humans or the four-legged overlords who run your life. Features a retro bathroom ready for a stylish refresh. This gem is ideally located near the St. Johns River, just 15–20 minutes from Jacksonville International Airport, Downtown Jacksonville, beaches and just a 40 minute drive to St. Augustine.
Key facts
- Fenced in backyard
- Retro bathroom
- Near st johns river
Tags
Property features AI
Finance
- Other: Property zoned RLD-60; Lot size about 0.19 acre
- Financial info: No lease restrictions
- HOA & community: No HOA/association
Exterior
- Parking: Attached garage with 1 parking space
- Utilities: Public water; Public sewer; Electricity connected
- Home design: Single-family residence; Single story; Multi/split levels; Faces west; Homestead exempt
- Construction: Block construction; Shingle roof; Crawlspace and slab foundation; Built with approximately 1,792 total building area
- Exterior features: Front porch; Rear porch; Sidewalk; Chain link fence; Mature landscaping; Paved road access; Lot dimensions approximately 80 x 100
Interior
- Kitchen: Refrigerator
- Bedrooms: 3 bedrooms
- Flooring: Carpet; Tile
- Bathrooms: 2 full bathrooms
- Heating & cooling: Central heating; Central air conditioning
- Interior features: Ceiling fans; Florida room
- Laundry & utility: Laundry area (other)
Neighborhood map
What this means for you Summary
Snapshot
- This is a 3-bed/2.0-bath single-family listed at $240k.
Deal economics
- At list price, monthly cash flow is $73 ($879/yr) — positive.
- The deal already cash-flows at list — no discount required.
- To meet the 1% rule (rent ≥ 1% of price), the offer needs to be $193k (19.6% below list).
- Recommended offer: $193k (19.6% below list) — sets the bar for 1% rule.
- Cap rate 6.7% vs local median 3.9% in Jacksonville — top-decile yield for the area; either an underpriced asset or a hidden risk that comps aren't pricing in. Stress-test before assuming the spread holds.
Location & tenants
- Location reads 83/100 on livability (#50 in FL, #911 nationally) — a professional / high-income tenant draw. Strengths: amenities A+, commute A+, housing A+.
- Duval (urban): math 46% / reading 45% proficiency, ranked #48 of 73 in FL (top 66%) — families likely to look elsewhere, expect single-tenant / working-renter base with shorter leases.
- Zoned schools: Lone Star Elementary School (math 62% / reading 52%, grade C+, #781 of 2,144 statewide, top 38%, 386 students, 59% FRL); Arlington Middle School (math 23% / reading 21%, grade F, #549 of 571 statewide, top 97%, 798 students, 74% FRL); Sandalwood High School (math 53% / reading 46%, grade D, #179 of 667 statewide, top 29%, 2,771 students, 42% FRL).
- Market conditions: Rents soft (-1.4%/yr); 227 active listings in the ZIP; 22 comparable units currently listed for rent nearby; rentals leasing fast (median 13d on market — plan ~1-2 weeks tenant-placement turnaround); solid renter incomes; 6,503 units permitted in Duval County in 2024 (1,131 in 5+ unit buildings).
Forward outlook
- Local home prices are declining (-3.0%/yr); year-one equity from $2k of loan paydown is wiped out by about $7k of value loss. Plan a longer hold.
- Duval County population projected at +19% by 2050 — long-run rental-demand tailwind backs the buy-and-hold thesis.
Negotiation context
- Only 7 days on market — expect competitive offers; lowballing is unlikely to land.
- Current owner paid $36k; list at $240k implies a 558% gain — meaningful room to come down on a strong offer.
Risks & watch-outs
- Climate carrying-cost: severe wind risk, 99% chance of damaging wind over 30y; extreme-heat days projected 7→20/yr by 2055 (HVAC capex compounding) — expect insurance premiums to compound above CPI over the hold.
Questions for the listing agent
- Built in 1968 — when were the roof, HVAC, electrical panel, plumbing, and water heater last replaced?
- Is there a deadline driving the sale (1031 exchange, divorce, estate, relocation)? That informs how much negotiation room exists.
- Schools are B-rated — typically a magnet for longer-tenancy family renters. What's the average tenant stay here, and is there a school-zone premium baked into asking?
- What's the average days-on-market for RENTAL listings here right now (not sales)? A rising rental-DOM trend means longer vacancies and softer asking-rent achievability than the comps imply.
- What's the recent tenant-quality profile in this submarket — average credit score on applications, eviction rate, late-payment / NSF rate, and stable-employment percentage? A property-management company in the area should have these aggregated.
- How much new for-sale + rental construction is in the pipeline within 1–3 miles? Heavy new supply typically softens prices + rents 12–24 months out; constrained supply supports both.
Investment metrics
- 1% rule
- 0.80% ✗
- Cap rate
- 6.66%
- Cash-on-cash
- 1.31%
- DSCR
- 1.06
- GRM
- 10.4
CMA / ARV
- ARV (on-the-fly)
- $317,552
- Comps found
- 12
Show comp detail 12 sales within ~0.75 mi
| Address | Dist | Beds/Ba | Sqft | Sold | Price | $/sf | Match |
|---|---|---|---|---|---|---|---|
| 849 Jackson Rd | 0.14mi | 4/2.0 (+1) | 1,456 (+2%) | 3mo | $349,900 | $240 | 82 |
| 845 Jackson Rd | 0.14mi | 4/2.0 (+1) | 1,470 (+3%) | 2mo | $349,900 | $238 | 81 |
| 10148 Geni Hill Cir N | 0.26mi | 3/2.0 | 1,344 (-6%) | 0mo | $265,000 | $197 | 78 |
| 10389 Homard Blvd N | 0.40mi | 3/2.0 | 1,442 (+1%) | 3mo | $275,000 | $191 | 77 |
| 1145 Creeks Ridge Rd | 0.32mi | 3/2.0 | 1,370 (-4%) | 3mo | $305,000 | $223 | 76 |
| 10204 Lone Star Rd | 0.23mi | 2/2.0 (-1) | 1,342 (-6%) | 1mo | $266,325 | $198 | 74 |
| 1132 Creeks Ridge Rd | 0.29mi | 3/2.0 | 1,278 (-10%) | 1mo | $330,000 | $258 | 68 |
| 1159 Radis Pl | 0.30mi | 3/2.0 | 1,264 (-11%) | 1mo | $263,000 | $208 | 67 |
| 10256 Classic Oak Rd N | 0.67mi | 3/2.0 | 1,440 (+1%) | 4mo | $338,000 | $235 | 64 |
| 245 Jackson Rd | 0.57mi | 3/1.0 | 1,305 (-8%) | 1mo | $175,000 | $134 | 54 |
| 10692 Abbot Cove Dr E | 0.72mi | 3/2.0 | 1,537 (+8%) | 4mo | $360,000 | $234 | 50 |
| 10653 Prim Dr | 0.66mi | 3/2.0 | 1,261 (-11%) | 0mo | $250,000 | $198 | 50 |
Match score weights: distance 35% · size 25% · config 20% · recency 20%. Top-matched comps best support the ARV.
Projected returns pro-forma
-3.0% appreciation · 0.0% rent growth · sell at horizon
- IRR
- -17.3%
- Equity multiple
- 0.41×
- Total profit
- $-39,978
- Equity at exit
- $35,785
- IRR
- -15.2%
- Equity multiple
- 0.24×
- Total profit
- $-51,066
- Equity at exit
- $20,751
Cash invested: $67,200 (down + closing). Projections, not guarantees.
Landlord ↔ Tenant lean methodology
- Overall (STATE)
- 87 Strongly Landlord-Friendly
- State Florida
- 87 Strongly Landlord-Friendly · R+3
- County
- — inherits STATE
- City
- — inherits STATE
ZIP-level market 32225
- Rents YoY
- -1.4%
- Active inventory
- 227
- Price-to-rent
- 10.4×
Monthly cashflow live
- Estimated rent
- $1,931 high interval (Pro) →
- Mortgage (P&I)
- −$1,259
- Tax from tax record
- −$93 /mo · $1,120/yr
- Insurance
- −$100
- HOA
- −$0
- Vacancy / Maint / Mgmt
- −$405
- Net cashflow
- $73
Break-even live
Sensitivity live
| Price | -10% $209 | -5% $141 | +0% $73 | +5% $5 | +10% $-63 |
|---|---|---|---|---|---|
| Rent | -10% $-79 | -5% $-3 | +0% $73 | +5% $150 | +10% $226 |
| Rate | -1.0pp $194 | -0.5pp $134 | base $73 | +0.5pp $11 | +1.0pp $-52 |
UW: 25.0% down · 7.5% · 30yr · 1.5% tax · 5.0% vac · 8.0% maint · 8.0% mgmt
Financing live
Cash to close
- Down payment
- $60,000
- Closing costs
- $7,200
- Reserves months
- —
- Total cash needed
- —
Loan-product check · same deal, 3 products live
Conventional
25% down · 7.5% · 30yr
- Down + closing
- —
- Monthly P&I
- —
- Monthly cashflow
- —
- DSCR
- —
- Eligible?
- —
Personal DTI + credit; lowest rate.
DSCR
20% down · 8.5% · 30yr
- Down + closing
- —
- Monthly P&I
- —
- Monthly cashflow
- —
- DSCR
- —
- Eligible?
- —
No personal income docs; deal must DSCR.
Hard money
10% down · 12.0% · 12mo
- Down + closing
- —
- Monthly P&I
- —
- Monthly cashflow
- —
- DSCR
- —
- Eligible?
- —
Short-term bridge; refi at stabilization.
Rent comps 22 comps
| Address | Beds | Baths | Sqft | Rent | $/sqft | DOM | Units | Dist |
|---|---|---|---|---|---|---|---|---|
| 881 Jackson Rd Jacksonville, FL | 3.0 | 2.0 | 1336 | $1,960 | $1.47 | 14d | 1 | 0.14mi |
| 10178 Geni Hill Cir N Jacksonville, FL | 3.0 | 2.0 | 1155 | $1,850 | $1.60 | 9d | 1 | 0.19mi |
| 1120 Creeks Ridge Rd Jacksonville, FL | 3.0 | 2.0 | 1434 | $2,090 | $1.46 | 23d | 1 | 0.24mi |
| 10434 Seal Rd Jacksonville, FL | 4.0 | 2.0 | 1761 | $2,095 | $1.19 | 23d | 1 | 0.31mi |
| 1132 Brookwood Bluff Rd E Jacksonville, FL | 3.0 | 2.0 | 1415 | $1,800 | $1.27 | 23d | 1 | 0.32mi |
| 10120 Pontiac Dr Jacksonville, FL | 3.0 | 2.0 | 1209 | $1,775 | $1.47 | 23d | 1 | 0.35mi |
| 1114 Romaine Cir W Jacksonville, FL | 3.0 | 2.5 | 1392 | $1,575 | $1.13 | 25d | 1 | 0.36mi |
| 1385 Brookwood Forest Blvd Jacksonville, FL | 1.0–2.0 | 1.0–2.0 | 825 | $1,480 | $1.79 | 3d | 37 | 0.51mi |
| 653 Monument Rd Jacksonville, FL | 1.0–3.0 | 1.0–2.0 | 983 | $1,924 | $1.96 | 3d | 19 | 0.75mi |
| 401 Monument Rd Jacksonville, FL | 3.0 | 1.0–2.0 | 753 | $1,600 | $2.12 | 12d | 8 | 0.81mi |
| 396 Regency Wood Dr #17 Jacksonville, FL | 3.0 | 2.5 | 1800 | $2,010 | $1.12 | 16d | 1 | 0.86mi |
| 1141 Kendall Town Blvd Jacksonville, FL | 1.0–3.0 | 1.0–2.0 | 1137 | $1,989 | $1.75 | 25d | 1 | 1.05mi |
| 1290 Kendall Town Blvd Jacksonville, FL | 1.0–3.0 | 1.0–2.0 | 1002 | $2,028 | $2.02 | 3d | 34 | 1.11mi |
| 1721 Anniston Rd Jacksonville, FL | 1.0–3.0 | 1.0–2.0 | 850 | $1,595 | $1.88 | 9d | 1 | 1.22mi |
| 1458 Landau Rd Jacksonville, FL | 2.0 | 2.5 | 1076 | $1,465 | $1.36 | 25d | 1 | 1.23mi |
| 1700 Mindanao Dr Jacksonville, FL | 2.0 | 1.0 | 1075 | $1,446 | $1.35 | 3d | 6 | 1.25mi |
| 1521 Fieldview Dr Jacksonville, FL | 2.0 | 2.5 | 1072 | $1,495 | $1.39 | 25d | 1 | 1.27mi |
| 1496 Fieldview Dr Jacksonville, FL | 2.0 | 2.5 | 1008 | $1,400 | $1.39 | 9d | 1 | 1.29mi |
| 1468 Pitney Cir Jacksonville, FL | 2.0 | 2.5 | 1076 | $1,650 | $1.53 | 9d | 1 | 1.29mi |
| 1573 Landau Rd Jacksonville, FL | 3.0 | 2.5 | 1480 | $1,700 | $1.15 | 9d | 1 | 1.30mi |
| 9105 Tredinick Pkwy Jacksonville, FL | 1.0–3.0 | 1.0–2.5 | 1018 | $2,200 | $2.16 | 3d | 26 | 1.37mi |
| 1462 Solera Ter Jacksonville, FL | 1.0–3.0 | 1.0–2.0 | 1096 | $2,000 | $1.82 | 4d | 1 | 1.41mi |
Listing history 4 events
-
2026-05-16status Pending
-
2026-05-09$240,000 Active
-
1979-04-30soldstatus $36,500
-
1974-08-01soldstatus $32,900
ⓘ Source: listings_history table (triggers on properties + properties_extension) + one-shot
backfill from property_details.listing_events for pre-trigger history.
Tax reassessment forecast FL · Resets to sale price
- Current annual tax
- $1,120 · $93/mo
- Projected year-2 tax
- $1,992 · $166/mo
- Expected delta
- +$872/yr (+$73/mo · 77.8%)
ⓘ Screening estimate from a state-policy table — verify with the county assessor before closing.
Climate risk First Street
- Flood 1/10 Low FEMA zone X (unshaded) · 0% chance over 30 yrs
- Wildfire 4/10 Moderate
- Heat 9/10 Extreme 7 d/yr ≥107°F today · 20 d/yr by 30 yrs out
- Wind 9/10 Extreme 99% chance of damaging wind over 30 yrs
- Air quality 4/10 Moderate 4 unhealthy d/yr today · 7 by 30 yrs out
Nearby sold comps map
Loading sold comps map…
Walkable amenities ~0.75 mi
Loading nearby amenities…
Taxation est. · year 1
- Rental income
- $23,168
- − Mortgage interest
- −$13,444
- − Property taxes
- −$1,120
- − Insurance
- −$1,200
- − Repairs & maintenance
- −$1,853
- − Management
- −$1,853
- − Depreciation
- −$6,982
- Taxable loss
- −$3,285
- Est. tax savings @ 24.0%
- +$788
- After-tax cash flow
- $1,668/yr
For passive investors: Depreciation is non-cash, so a rental often shows a tax loss while cash-flowing — sheltering income. Rental losses are passive: they offset passive income freely, and up to $25,000/yr can offset ordinary (W-2) income if you actively participate and your MAGI is under $100k (phasing out to $0 by $150k); unused losses carry forward. On sale, claimed depreciation is recaptured at up to 25%, and gains may owe capital-gains tax (a 1031 exchange can defer both). Figures are a year-1 estimate at your 24.0% rate — not tax advice; consult a CPA.
Schools (NCES district)
- District
- Duval
- NCES district ID
- 1200480
- Math proficiency
- 46% ▼ -11.00%
- Reading proficiency
- 45% ▼ -4.00%
- Median HH income
- $48,987
- Composite
- 38.97/100
- National rank
- #4076
- State rank
- #48 of 73 in FL
Livability — Jacksonville
- Score
- 83/100
- State rank
- #50
- US rank
- #911
Category grades
Schools grade is shown separately in the Schools card above.
Census & demographics
- Census place
- Jacksonville, FL
- County
- Duval County · 1,015,274 people
- City population
- 979,034
- Metro
- Jacksonville, FL
- Population (ZIP)
- 55,905
- Household income
- $90,559
- Rent vs Own
- Severe rent burden
- 1670.0
Population outlook (Duval County) Hauer SSP2
- Today (2025)
- 1,013,010 people
- By 2030
- 1,059,228 · +4.6%
- By 2040
- 1,141,439 · +12.7%
- By 2050
- 1,205,258 · +19.0%
- By 2075
- 1,324,282 · +30.7%
- By 2100
- 1,319,620 · +30.3%
Race, ethnicity, and origin ACS 2023
- Neighborhood character
- Diverse neighborhood (Simpson 0.61)
- Race & ethnicity
- White 59% Hispanic / Latino 14% Two or more races 14% Black 14% Asian 6%
- Hispanic origin (detail)
- Mexican 1% Puerto Rican 5% Cuban 1%
- Common ancestry
- Serbian 3% Slovak 2% Romanian 2%
- Foreign-born
- 13% · Canada, Jamaica, South Korea
- Languages at home
- 82% English-only · Spanish 9% Tagalog/Filipino 2% Other Indo-European 2%
Political lean MEDSL · Duval
- 2024 margin
- Toss-up / Even · D 48.7% · R 50.1% · Other 1.2%
- 2008→2024 swing
- +0.4pp no change · 2008: -1.9pp · 2024: -1.5pp
- All cycles
- 2024: R+1.5 2020: D+3.8 2016: R+1.5 2012: R+3.6 2008: R+1.9
Not yet ingested
- Civics
- —
Market trends
- HPI YoY
- ▼ -191.73%
- Current HPI
- 307.1292
- Rent YoY
- ▼ -1.45%
- Metro
- Jacksonville, FL
- State GDP YoY
- ▲ 3.28%
- F500 in state
- 36
Industry mix (Fortune 500 HQ in FL)
| Industry | F500 HQs | Revenue |
|---|---|---|
| Industrial Technology | 2 | $29B |
|
||
| Insurance | 2 | $17B |
|
||
| Retail | 1 | $60B |
|
||
| Technology Distribution | 1 | $58B |
|
||
| Homebuilding | 1 | $35B |
|
||
| Technology Manufacturing | 1 | $35B |
|
||
Price history
+629.5% since first listed4 events — show timeline
- 2026-05-16 Pending — Stellar MLS as Distributed by MLS Grid
- 2026-05-09 Listed $240,000 Stellar MLS as Distributed by MLS Grid
- 1979-04-30 Sold (Public Records) $36,500 Public Records
- 1974-08-01 Sold (Public Records) $32,900 Public Records
Property tax history
+3.0%/yrLatest (2025): $1,120 · +22.0% YoY. Source: county tax records.
Cash-flow waterfall
monthlySold comps — $/sqft
last 12 mo · ≤1 miLoading sold comps…