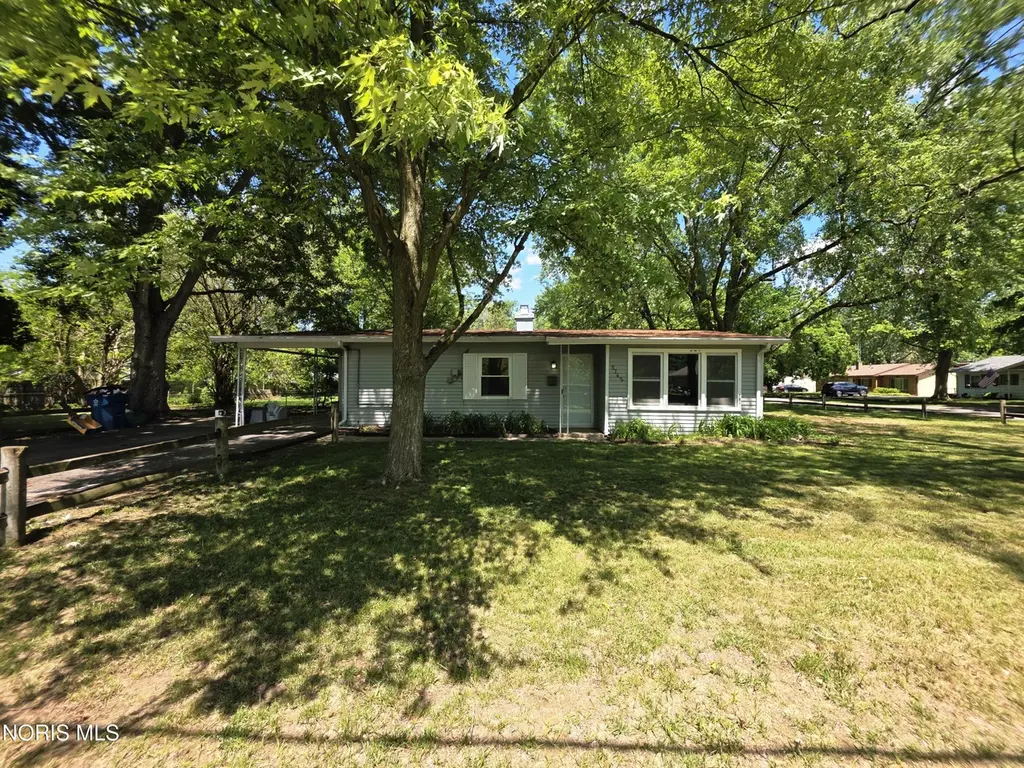
5742 Marshall Rd · Sylvania, OH
Flood risk 1/10 · Minimal
- FEMA flood zone
- X (unshaded)
- Chance of flooding over 30 yrs
- 0.0%
- Est. flood insurance / yr
- $507 – $1,088
Fire risk 1/10 · Minimal
- Est. fire insurance / yr
- $713 – $1,323
Heat risk 3/10 · Minor
- Hot days now (above 100°F)
- 7 days/yr
- Hot days in 30 yrs
- 16 days/yr
Wind risk 2/10 · Minimal
- Chance of severe wind over 30 yrs
- —
Air-quality risk 2/10 · Minimal
- Unhealthy air days now
- 1 days/yr
- Unhealthy air days in 30 yrs
- 1 days/yr
Risk factors via First Street. Map © Google.
Why this score? — see what drove the D grade
The composite is a weighted blend of 9 inputs, each scored 0–100. Each bar is that input's sub-score; the figure is the points it added to the 100-point composite (weight × sub-score).
- Cash flow +10.9/30.0
- ARV discount +7.8/15.0
- Schools +5.9/10.0
- Livability +4.4/5.0
- 1% rule +3.6/10.0
- DSCR +3.2/10.0
- Rent growth +2.5/5.0
- Condition / age +2.5/5.0
- Appreciation +0.0/10.0
$169,000
🖨 Deal sheet (PDF) 📄 Offer letter ✓ Due diligence
Listing remarks MLS
SHARP SIX ROOM HOME. UPDATED KITCHEN. NEWER WINDOWS, CARPET, FURNACE, ROOF. GREAT FENCED YARD WITH SPLIT RAIL FENCE IN FRONT YARD. ALL APPLIANCES STAY.
Key facts
- New drywall
- Great location
- Fenced in corner lot
Tags
Property features AI
Exterior
- Parking: Carport; Asphalt driveway
- Security: Smoke detectors
- Utilities: Cable connected; Circuit breaker electrical; Public sewer; Public water
- Home design: Single-family house; One story
- Construction: Vinyl siding; Slab foundation; Built per public records
- Exterior features: Shingle roof; Split rail fencing; Corner lot; City street frontage
Interior
- Kitchen: Dishwasher; Gas range; Refrigerator; Water heater
- Bedrooms: All bedrooms on main level; Bedroom 2 (main level); Bedroom 3 (main level)
- Flooring: Carpet; Ceramic tile
- Bathrooms: 1 full bathroom
- Heating & cooling: Forced air heating; Central air conditioning
- Interior features: Vaulted ceilings; Screens on windows; Door screens
- Laundry & utility: Laundry on main level
Neighborhood map
What this means for you Summary
Snapshot
- This is a 3-bed/1.0-bath single-family listed at $169k.
Deal economics
- At list price, monthly cash flow is $-74 ($-890/yr) — negative.
- To cash-flow at today's rent, offer at most $156k (7.8% below list).
- To meet the 1% rule (rent ≥ 1% of price), the offer needs to be $145k (14.2% below list).
- Recommended offer: $145k (14.2% below list) — sets the bar for 1% rule.
- Cap rate 5.8% vs local median 2.8% in Sylvania — top-decile yield for the area; either an underpriced asset or a hidden risk that comps aren't pricing in. Stress-test before assuming the spread holds.
Location & tenants
- Location reads 88/100 on livability (#18 in OH, #191 nationally) — a professional / high-income tenant draw. Strengths: crime A+, employment A+, cost of living A+; Watch: amenities C-, commute F.
- Sylvania Schools (suburban): math 63% / reading 71% proficiency, ranked #157 of 656 in OH (top 24%) — acceptable for families but not a draw, mixed tenant base, ~2y average lease; only 18% free/reduced lunch — higher-income household profile.
- Zoned schools: Maplewood Elementary School (math 76% / reading 79%, grade A, #213 of 1,584 statewide, top 14%, 535 students, 16% FRL); Sylvania Arbor Hills Junior High School (math 56% / reading 58%, grade B, #305 of 654 statewide, top 48%, 502 students, 34% FRL); Sylvania Northview High School (math 59% / reading 78%, grade B, #130 of 781 statewide, top 17%, 1,352 students, 20% FRL).
- Market conditions: 196 active listings in the ZIP; 6 comparable units currently listed for rent nearby; rentals at typical pace (median 16d on market — plan ~3-4 weeks tenant-placement turnaround); solid renter incomes; 415 units permitted in Lucas County in 2024 (122 in 5+ unit buildings).
- This rent is only 16% of the median local income ($109k/yr) — well below the 30% rent-burden line; pricing power to push rent on renewal without tenant pushback.
Forward outlook
- Local home prices are declining (-3.0%/yr); year-one equity from $1k of loan paydown is wiped out by about $5k of value loss. Plan a longer hold.
- Lucas County population projected at -16% by 2050 — secular population decline; favor cash flow + early exit over multi-decade hold.
Negotiation context
- It's been on market 27 days — a 2% lower offer ($166k) is reasonable based on typical stale-listing flexibility.
- 6 sale attempts since 26y ago with the ask held roughly flat each time — persistent listings suggest the price (not the market) is what's stuck; bring a comps-based counter.
- Current owner paid $135k; 25% above their basis — modest negotiation headroom, anchor on the comps not their cost.
Risks & watch-outs
- Watch-outs: built in 1955 — expect roof / HVAC / electrical / plumbing capex.
Questions for the listing agent
- What do current leases actually rent for vs. the listed asking? Can we see a recent rent roll and the last 12 months of T-12 income?
- Built in 1955 — when were the roof, HVAC, electrical panel, plumbing, and water heater last replaced?
- Is there a deadline driving the sale (1031 exchange, divorce, estate, relocation)? That informs how much negotiation room exists.
- Schools are A-rated — typically a magnet for longer-tenancy family renters. What's the average tenant stay here, and is there a school-zone premium baked into asking?
- The area grade is low — what's the realistic commute time and amenity access for the typical tenant pool here? Any planned neighborhood developments (good or bad) we should know about?
- What's the average days-on-market for RENTAL listings here right now (not sales)? A rising rental-DOM trend means longer vacancies and softer asking-rent achievability than the comps imply.
- What's the recent tenant-quality profile in this submarket — average credit score on applications, eviction rate, late-payment / NSF rate, and stable-employment percentage? A property-management company in the area should have these aggregated.
- How much new for-sale + rental construction is in the pipeline within 1–3 miles? Heavy new supply typically softens prices + rents 12–24 months out; constrained supply supports both.
Investment metrics
- 1% rule
- 0.86% ✗
- Cap rate
- 5.77%
- Cash-on-cash
- -1.88%
- DSCR
- 0.92
- GRM
- 9.7
CMA / ARV
- ARV (on-the-fly)
- $169,998
- Comps found
- 12
Show comp detail 12 sales within ~0.75 mi
| Address | Dist | Beds/Ba | Sqft | Sold | Price | $/sf | Match |
|---|---|---|---|---|---|---|---|
| 5729 Elliott Dr | 0.09mi | 3/1.0 | 1,006 (+3%) | 10mo | $182,500 | $181 | 83 |
| 5747 Dellbrook Dr | 0.12mi | 3/1.0 | 875 (-10%) | 2mo | $159,000 | $182 | 76 |
| 5910 Balfour Rd | 0.24mi | 3/2.0 | 1,000 (+2%) | 12mo | $248,500 | $249 | 71 |
| 6024 Acres Rd | 0.32mi | 3/1.0 | 1,045 (+7%) | 5mo | $182,000 | $174 | 69 |
| 5618 Balfour Rd | 0.36mi | 3/2.0 | 1,032 (+6%) | 1mo | $198,000 | $192 | 69 |
| 5646 Acres Rd | 0.24mi | 3/1.0 | 875 (-10%) | 3mo | $200,000 | $229 | 69 |
| 5664 Stewart Rd | 0.62mi | 3/1.0 | 976 (-0%) | 3mo | $154,000 | $158 | 68 |
| 5915 Rudyard Rd | 0.30mi | 3/2.0 | 946 (-3%) | 12mo | $134,000 | $142 | 67 |
| 5831 Meade Rd | 0.14mi | 2/1.0 (-1) | 840 (-14%) | 4mo | $61,600 | $73 | 62 |
| 5438 Grey Dr | 0.60mi | 3/1.0 | 960 (-2%) | 9mo | $162,000 | $169 | 62 |
| 6028 Stewart Rd | 0.61mi | 2/1.0 (-1) | 1,000 (+2%) | 7mo | $160,000 | $160 | 56 |
| 5228 Estess Ave | 0.67mi | 3/1.0 | 996 (+2%) | 11mo | $164,900 | $166 | 56 |
Match score weights: distance 35% · size 25% · config 20% · recency 20%. Top-matched comps best support the ARV.
Projected returns pro-forma
-3.0% appreciation · 3.0% rent growth · sell at horizon
- IRR
- -19.4%
- Equity multiple
- 0.32×
- Total profit
- $-32,056
- Equity at exit
- $25,198
- IRR
- -12.0%
- Equity multiple
- 0.29×
- Total profit
- $-33,780
- Equity at exit
- $14,612
Cash invested: $47,320 (down + closing). Projections, not guarantees.
Landlord ↔ Tenant lean methodology
- Overall (STATE)
- 73 Landlord-Friendly
- State Ohio
- 73 Landlord-Friendly · R+6
- County
- — inherits STATE
- City
- — inherits STATE
ZIP-level market 43560
- Home prices YoY
- -31.7%
- Active inventory
- 196
- Price-to-rent
- 9.7×
Monthly cashflow live
- Estimated rent
- $1,450 high interval (Pro) →
- Mortgage (P&I)
- −$886
- Tax from tax record
- −$263 /mo · $3,153/yr
- Insurance
- −$70
- HOA
- −$0
- Vacancy / Maint / Mgmt
- −$304
- Net cashflow
- $-74
Break-even live
Sensitivity live
| Price | -10% $21 | -5% $-26 | +0% $-74 | +5% $-122 | +10% $-170 |
|---|---|---|---|---|---|
| Rent | -10% $-189 | -5% $-131 | +0% $-74 | +5% $-17 | +10% $40 |
| Rate | -1.0pp $11 | -0.5pp $-31 | base $-74 | +0.5pp $-118 | +1.0pp $-163 |
UW: 25.0% down · 7.5% · 30yr · 1.5% tax · 5.0% vac · 8.0% maint · 8.0% mgmt
Financing live
Cash to close
- Down payment
- $42,250
- Closing costs
- $5,070
- Reserves months
- —
- Total cash needed
- —
Loan-product check · same deal, 3 products live
Conventional
25% down · 7.5% · 30yr
- Down + closing
- —
- Monthly P&I
- —
- Monthly cashflow
- —
- DSCR
- —
- Eligible?
- —
Personal DTI + credit; lowest rate.
DSCR
20% down · 8.5% · 30yr
- Down + closing
- —
- Monthly P&I
- —
- Monthly cashflow
- —
- DSCR
- —
- Eligible?
- —
No personal income docs; deal must DSCR.
Hard money
10% down · 12.0% · 12mo
- Down + closing
- —
- Monthly P&I
- —
- Monthly cashflow
- —
- DSCR
- —
- Eligible?
- —
Short-term bridge; refi at stabilization.
Rent comps 6 comps
| Address | Beds | Baths | Sqft | Rent | $/sqft | DOM | Units | Dist |
|---|---|---|---|---|---|---|---|---|
| 5600 Alexis Rd Sylvania, OH | 1.0–2.0 | 1.0 | 590 | $925 | $1.57 | 15d | 1 | 0.28mi |
| 5301 Alexis Rd Sylvania, OH | 1.0–2.0 | 1.0 | 685 | $875 | $1.28 | 15d | 1 | 0.61mi |
| 6455 Monroe St Sylvania, OH | 1.0–2.0 | 1.0–2.5 | 744 | $2,567 | $3.45 | 15d | 16 | 1.02mi |
| 6632 Maplewood Ave Sylvania, OH | 2.0 | 1.0 | 875 | $1,068 | $1.22 | 15d | 7 | 1.17mi |
| 4994 Main St Sylvania, OH | 2.0 | 1.0 | 1110 | $1,150 | $1.04 | 25d | 1 | 1.25mi |
| 5716 Phillips Ave Unit 4 Sylvania, OH | 2.0 | 1.0 | 900 | $1,100 | $1.22 | 15d | 1 | 1.32mi |
Listing history 32 events
-
2026-06-17status $169,000 Pending 27 DOM
-
2026-06-17days on market $169,000 Active 27 DOM
-
2026-06-16days on market $169,000 Active 26 DOM
-
2026-06-15days on market $169,000 Active 25 DOM
-
2026-06-14days on market $169,000 Active 23 DOM
-
2026-06-13days on market $169,000 Active 22 DOM
-
2026-06-10days on market $169,000 Active 20 DOM
-
2026-06-09days on market $169,000 Active 19 DOM
-
2026-06-08days on market $169,000 Active 18 DOM
-
2026-06-07days on market $169,000 Active 17 DOM
-
2026-06-03days on market $169,000 Active 13 DOM
-
2026-06-02days on market $169,000 Active 12 DOM
-
2026-06-01days on market $169,000 Active 11 DOM
-
2026-05-31days on market $169,000 Active 10 DOM
-
2026-05-30days on market $169,000 Active 9 DOM
-
2026-05-21$169,000 Active
-
2025-12-13status Active
-
2025-12-11status Pending
-
2025-12-11historical
-
2025-10-20$169,000 Active
-
2025-10-09price $83,200 151-char remark
Show marketing remark (151 chars)
SHARP SIX ROOM HOME. UPDATED KITCHEN. NEWER WINDOWS, CARPET, FURNACE, ROOF. GREAT FENCED YARD WITH SPLIT RAIL FENCE IN FRONT YARD. ALL APPLIANCES STAY.
-
2025-09-29historical
-
2022-04-29soldstatus $135,000 Closed
-
2022-03-15status Pending
-
2022-03-15price $135,000
-
2022-03-14$129,900 Active
-
2004-10-04historical
-
2004-04-06$89,900
-
2000-11-21soldstatus $83,200
-
2000-11-20soldstatus $83,200 151-char remark
Show marketing remark (151 chars)
SHARP SIX ROOM HOME. UPDATED KITCHEN. NEWER WINDOWS, CARPET, FURNACE, ROOF. GREAT FENCED YARD WITH SPLIT RAIL FENCE IN FRONT YARD. ALL APPLIANCES STAY.
-
2000-11-13price $88,500 151-char remark
Show marketing remark (151 chars)
SHARP SIX ROOM HOME. UPDATED KITCHEN. NEWER WINDOWS, CARPET, FURNACE, ROOF. GREAT FENCED YARD WITH SPLIT RAIL FENCE IN FRONT YARD. ALL APPLIANCES STAY.
-
2000-08-02$88,500 151-char remark
Show marketing remark (151 chars)
SHARP SIX ROOM HOME. UPDATED KITCHEN. NEWER WINDOWS, CARPET, FURNACE, ROOF. GREAT FENCED YARD WITH SPLIT RAIL FENCE IN FRONT YARD. ALL APPLIANCES STAY.
ⓘ Source: listings_history table (triggers on properties + properties_extension) + one-shot
backfill from property_details.listing_events for pre-trigger history.
Tax reassessment forecast OH · Partial reset (capped growth)
- Current annual tax
- $3,153 · $263/mo
- Projected year-2 tax
- $3,153 · $263/mo
- Expected delta
- $0/yr ($0/mo · 0.0%)
ⓘ Screening estimate from a state-policy table — verify with the county assessor before closing.
Climate risk First Street
- Flood 1/10 Low FEMA zone X (unshaded) · 0% chance over 30 yrs
- Wildfire 1/10 Low
- Heat 3/10 Moderate 7 d/yr ≥100°F today · 16 d/yr by 30 yrs out
- Wind 2/10 Low
- Air quality 2/10 Low 1 unhealthy d/yr today · 1 by 30 yrs out
Nearby sold comps map
Loading sold comps map…
Walkable amenities ~0.75 mi
Loading nearby amenities…
Taxation est. · year 1
- Rental income
- $17,396
- − Mortgage interest
- −$9,467
- − Property taxes
- −$3,153
- − Insurance
- −$845
- − Repairs & maintenance
- −$1,392
- − Management
- −$1,392
- − Depreciation
- −$4,916
- Taxable loss
- −$3,768
- Est. tax savings @ 24.0%
- +$904
- After-tax cash flow
- $14/yr
For passive investors: Depreciation is non-cash, so a rental often shows a tax loss while cash-flowing — sheltering income. Rental losses are passive: they offset passive income freely, and up to $25,000/yr can offset ordinary (W-2) income if you actively participate and your MAGI is under $100k (phasing out to $0 by $150k); unused losses carry forward. On sale, claimed depreciation is recaptured at up to 25%, and gains may owe capital-gains tax (a 1031 exchange can defer both). Figures are a year-1 estimate at your 24.0% rate — not tax advice; consult a CPA.
Schools (NCES district)
- District
- Sylvania Schools
- NCES district ID
- 3904487
- Math proficiency
- 63% ▼ -12.00%
- Reading proficiency
- 71% ▼ -6.00%
- Median HH income
- $71,949
- Composite
- 58.95/100
- National rank
- #967
- State rank
- #157 of 656 in OH
Livability — Sylvania
- Score
- 88/100
- State rank
- #18
- US rank
- #191
Category grades
Schools grade is shown separately in the Schools card above.
Census & demographics
- Census place
- Sylvania, OH
- County
- Lucas County · 380,724 people
- City population
- 33,286
- Metro
- Toledo, OH
- Population (ZIP)
- 33,286
- Household income
- $109,486
- Rent vs Own
- Severe rent burden
- 355.0
Population outlook (Lucas County) Hauer SSP2
- Today (2025)
- 420,751 people
- By 2030
- 410,187 · -2.5%
- By 2040
- 384,019 · -8.7%
- By 2050
- 355,125 · -15.6%
- By 2075
- 291,683 · -30.7%
- By 2100
- 233,670 · -44.5%
Race, ethnicity, and origin ACS 2023
- Neighborhood character
- Predominantly White (86%)
- Race & ethnicity
- White 86% Two or more races 4% Asian 4% Hispanic / Latino 3% Black 3%
- Common ancestry
- Romanian 10% Lithuanian 4% Slovak 2%
- Foreign-born
- 6% · China, Canada
- Languages at home
- 92% English-only · Other Indo-European 2% Arabic 2% Spanish 1%
Political lean MEDSL · Lucas
- 2024 margin
- D (+12.6) · D 55.8% · R 43.2%
- 2008→2024 swing
- -18.9pp toward R · 2008: 31.4pp · 2024: 12.6pp
- All cycles
- 2024: D+12.6 2020: D+16.8 2016: D+17.4 2012: D+30.4 2008: D+31.4
Not yet ingested
- Civics
- —
Market trends
- HPI YoY
- ▼ -99.73%
- Current HPI
- 215.2986
- Rent YoY
- —
- Metro
- Toledo, OH
- State GDP YoY
- ▲ 1.98%
- F500 in state
- 48
Industry mix (Fortune 500 HQ in OH)
| Industry | F500 HQs | Revenue |
|---|---|---|
| Insurance | 3 | $145B |
|
||
| Industrial Machinery | 3 | $49B |
|
||
| Financial Services | 3 | $24B |
|
||
| Consumer Goods | 2 | $93B |
|
||
| Aerospace / Defense | 2 | $47B |
|
||
| Utilities | 2 | $33B |
|
||
Price history
+91.0% since first listed17 events — show timeline
- 2026-05-21 Listed $169,000 NORIS
- 2025-12-13 Relisted — NORIS
- 2025-12-11 Pending — NORIS
- 2025-12-11 Listing Removed — NORIS
- 2025-10-20 Listed $169,000 NORIS
- 2025-10-09 Price Changed $83,200 NORIS
- 2025-09-29 Coming Soon — NORIS
- 2022-04-29 Sold (MLS) $135,000 NORIS
- 2022-03-15 Pending — NORIS
- 2022-03-15 Price Changed $135,000 NORIS
- 2022-03-14 Listed $129,900 NORIS
- 2004-10-04 Listing Removed — NORIS
- 2004-04-06 Listed $89,900 NORIS
- 2000-11-21 Sold (Public Records) $83,200 Public Records
- 2000-11-20 Sold (MLS) $83,200 NORIS
- 2000-11-13 Price Changed $88,500 NORIS
- 2000-08-02 Listed $88,500 NORIS
Property tax history
+4.1%/yrLatest (2025): $3,153 · +3.1% YoY. Source: county tax records.
Cash-flow waterfall
monthlySold comps — $/sqft
last 12 mo · ≤1 miLoading sold comps…