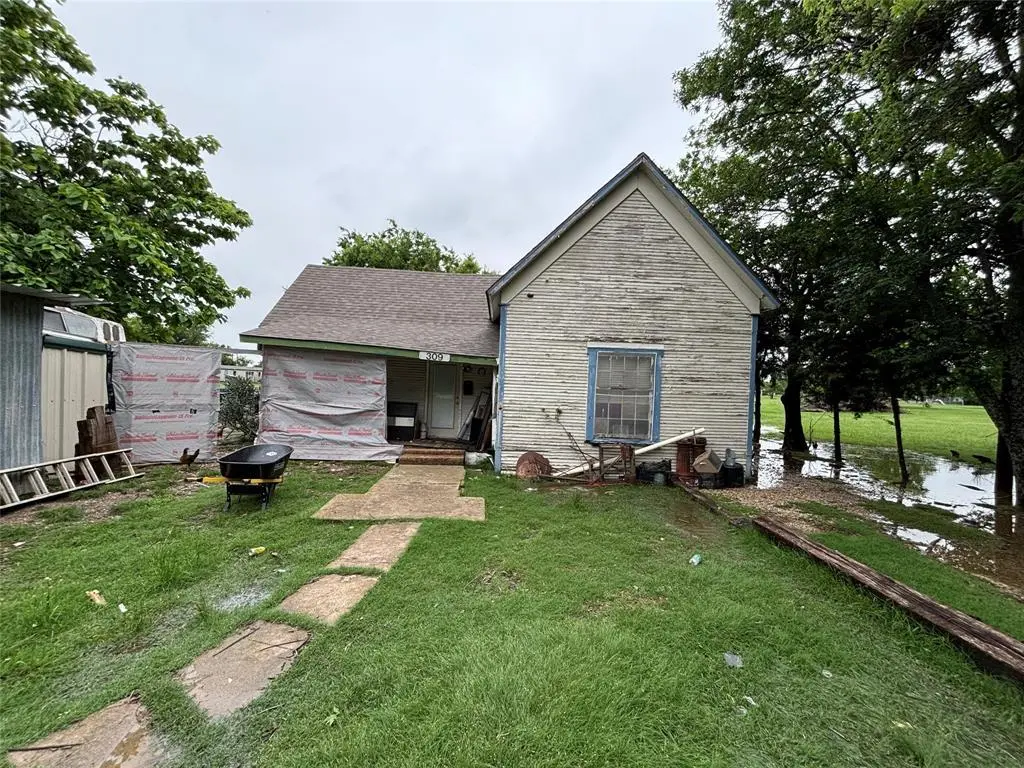
309 S Barry St · Mertens, TX
Flood risk 1/10 · Minimal
- FEMA flood zone
- X (unshaded)
- Chance of flooding over 30 yrs
- 0.0%
- Est. flood insurance / yr
- $507 – $1,088
Fire risk 5/10 · Moderate
- Est. fire insurance / yr
- $1,222 – $2,270
Heat risk 7/10 · Major
- Hot days now (above 109°F)
- 7 days/yr
- Hot days in 30 yrs
- 24 days/yr
Wind risk 6/10 · Moderate
- Chance of severe wind over 30 yrs
- 56.0%
Air-quality risk 2/10 · Minimal
- Unhealthy air days now
- 1 days/yr
- Unhealthy air days in 30 yrs
- 1 days/yr
Risk factors via First Street. Map © Google.
Why this score? — see what drove the B grade
The composite is a weighted blend of 9 inputs, each scored 0–100. Each bar is that input's sub-score; the figure is the points it added to the 100-point composite (weight × sub-score).
- Cash flow +30.0/30.0
- DSCR +10.0/10.0
- 1% rule +9.3/10.0
- ARV discount +7.5/15.0
- Appreciation +6.8/10.0
- Schools +3.0/10.0
- Livability +2.9/5.0
- Rent growth +2.5/5.0
- Condition / age +2.5/5.0
$60,000
🖨 Deal sheet 📄 Offer letter ✓ Due diligence
Listing remarks
Investor Special. Needing a new project to take on?? This home is ready for a completely new change, it already has a new roof replaced in 2023. Come take a look, the possibilities are endless.
Key facts
- New roof
- 0.36 acre lot
- Built 1945
Tags
Property features AI
Finance
- Other: Parcel number 125217; Property zoned/identified for residential single-family use
- Financial info: Listing treated as clear for loan purposes; No second mortgage indicated
- HOA & community: No homeowners association
Exterior
- Parking: No covered or carport spaces reported; Other parking features
- Security: No security details provided
- Utilities: City water; City sewer; Not in a municipal utility district
- Home design: Single-family residence, one story; Built in 1945; Residential property, not attached
- Construction: Built in 1945; No construction material or roof details provided
- Exterior features: Lot under 0.5 acre (approx. 0.365 acre); Located in the Hollingsworth subdivision; Directions: From FM 308 turn left onto Buie St, turn left on Barry St; property will be on the right
Interior
- Kitchen: Other appliances
- Bedrooms: Primary bedroom on the main level
- Flooring: No flooring details provided
- Bathrooms: 1 full bathroom
- Heating & cooling: No heating or cooling details provided
- Interior features: Two-room layout with one living area and one dining area; Room count includes 2 rooms; Other interior features
- Laundry & utility: No specific laundry details provided
Neighborhood map
What this means for you Summary
Snapshot
- This is a 2-bed/1.0-bath single-family listed at $60k.
Deal economics
- At list price, monthly cash flow is $291 ($3k/yr) — positive.
- The deal already cash-flows at list — no discount required.
- Meets the 1% rule at list price ($856 rent vs $60k).
- Recommended offer: $58k (3.0% below list) — sets the bar for market timing.
Location & tenants
- Location reads 57/100 on livability (#1,282 in TX) — a working-class tenant base; expect higher turnover. Strengths: cost of living A+, housing A+; Watch: employment D, crime F, amenities F.
- Frost ISD (rural): math 30% / reading 42% proficiency, ranked #517 of 826 in TX (top 63%) — families likely to look elsewhere, expect single-tenant / working-renter base with shorter leases.
- Zoned schools: Frost El (math 37% / reading 37%, grade F, #1,769 of 4,322 statewide, top 44%, 215 students, 66% FRL).
- Market conditions: 3 active listings in the ZIP; 65 units permitted in Hill County in 2024 (0 in 5+ unit buildings).
Forward outlook
- In year one you build about $3k of equity ($415 loan paydown + $2k appreciation (3.6% local appreciation)).
- Hill County population projected at -12% by 2050 — secular population decline; favor cash flow + early exit over multi-decade hold.
- At projected returns (3.6% appreciation + 3.0% rent growth), your $17k cash investment doubles in ~3 years — after that, you're playing with house money.
Negotiation context
- It's been on market 44 days — a 3% lower offer ($58k) is reasonable based on typical stale-listing flexibility.
Risks & watch-outs
- Watch-outs: built in 1945 — expect roof / HVAC / electrical / plumbing capex.
- Climate carrying-cost: major wind risk, 56% chance of damaging wind over 30y; moderate wildfire risk; extreme-heat days projected 7→24/yr by 2055 (HVAC capex compounding) — expect insurance premiums to compound above CPI over the hold.
Questions for the listing agent
- It's been on market 44 days. Have you received any prior offers? Is the seller open to a 3% concession, seller financing, or rate buy-down credit?
- Built in 1945 — when were the roof, HVAC, electrical panel, plumbing, and water heater last replaced?
- Is there a deadline driving the sale (1031 exchange, divorce, estate, relocation)? That informs how much negotiation room exists.
- Schools are D-rated, which usually means shorter tenancies and higher turnover. Who's the typical renter profile here, and what's been the actual vacancy rate?
- Crime grade is F in this area — have there been break-ins, vandalism, or insurance claims at this property in the last 3 years? What carrier currently insures it and at what premium?
- What's the average days-on-market for RENTAL listings here right now (not sales)? A rising rental-DOM trend means longer vacancies and softer asking-rent achievability than the comps imply.
- What's the recent tenant-quality profile in this submarket — average credit score on applications, eviction rate, late-payment / NSF rate, and stable-employment percentage? A property-management company in the area should have these aggregated.
- How much new for-sale + rental construction is in the pipeline within 1–3 miles? Heavy new supply typically softens prices + rents 12–24 months out; constrained supply supports both.
Investment metrics
- 1% rule
- 1.43% ✓
- Cap rate
- 12.11%
- Cash-on-cash
- 20.79%
- DSCR
- 1.92
- GRM
- 5.8
CMA / ARV
No comps found within radius.
Projected returns pro-forma
3.61% appreciation · 3.0% rent growth · sell at horizon
- IRR
- 28.3%
- Equity multiple
- 2.65×
- Total profit
- $27,709
- Equity at exit
- $29,055
- IRR
- 28.2%
- Equity multiple
- 5.19×
- Total profit
- $70,312
- Equity at exit
- $46,462
Cash invested: $16,800 (down + closing). Projections, not guarantees.
Landlord ↔ Tenant lean methodology
- Overall (STATE)
- 87 Strongly Landlord-Friendly
- State Texas
- 87 Strongly Landlord-Friendly · R+5
- County
- — inherits STATE
- City
- — inherits STATE
ZIP-level market 76666
- Home prices YoY
- 3.6%
- Active inventory
- 3
- Price-to-rent
- 5.8×
Monthly cashflow live
- Estimated rent
- $856 medium interval (Pro) →
- Mortgage (P&I)
- −$315
- Tax from tax record
- −$45 /mo · $544/yr
- Insurance
- −$25
- HOA
- −$0
- Vacancy / Maint / Mgmt
- −$180
- Net cashflow
- $291
Break-even live
UW: 25.0% down · 7.5% · 30yr · 1.5% tax · 5.0% vac · 8.0% maint · 8.0% mgmt
Financing live
Cash to close
- Down payment
- $15,000
- Closing costs
- $1,800
- Reserves months
- —
- Total cash needed
- —
Loan-product check · same deal, 3 products live
Conventional
25% down · 7.5% · 30yr
- Down + closing
- —
- Monthly P&I
- —
- Monthly cashflow
- —
- DSCR
- —
- Eligible?
- —
Personal DTI + credit; lowest rate.
DSCR
20% down · 8.5% · 30yr
- Down + closing
- —
- Monthly P&I
- —
- Monthly cashflow
- —
- DSCR
- —
- Eligible?
- —
No personal income docs; deal must DSCR.
Hard money
10% down · 12.0% · 12mo
- Down + closing
- —
- Monthly P&I
- —
- Monthly cashflow
- —
- DSCR
- —
- Eligible?
- —
Short-term bridge; refi at stabilization.
Listing history 15 events
-
2026-06-18days on market $60,000 Active 44 DOM
-
2026-06-17days on market $60,000 Active 43 DOM
-
2026-06-16days on market $60,000 Active 42 DOM
-
2026-06-15days on market $60,000 Active 41 DOM
-
2026-06-13days on market $60,000 Active 39 DOM
-
2026-06-12days on market $60,000 Active 38 DOM
-
2026-06-09days on market $60,000 Active 35 DOM
-
2026-06-08days on market $60,000 Active 34 DOM
-
2026-06-08days on market $60,000 Active 33 DOM
-
2026-06-07days on market $60,000 Active 32 DOM
-
2026-06-03days on market $60,000 Active 29 DOM
-
2026-06-02days on market $60,000 Active 28 DOM
-
2026-06-01days on market $60,000 Active 27 DOM
-
2026-05-31days on market $60,000 Active 26 DOM
-
2026-04-27$60,000 Active 193-char remark
ⓘ Source: listings_history table (triggers on properties + properties_extension) + one-shot
backfill from property_details.listing_events for pre-trigger history.
Tax reassessment forecast TX · Resets to sale price
- Current annual tax
- $544 · $45/mo
- Projected year-2 tax
- $1,098 · $92/mo
- Expected delta
- +$554/yr (+$46/mo · 102.0%)
ⓘ Screening estimate from a state-policy table — verify with the county assessor before closing.
Climate risk First Street
- Flood 1/10 Low FEMA zone X (unshaded) · 0% chance over 30 yrs
- Wildfire 5/10 Major
- Heat 7/10 Severe 7 d/yr ≥109°F today · 24 d/yr by 30 yrs out
- Wind 6/10 Major 56% chance of damaging wind over 30 yrs
- Air quality 2/10 Low 1 unhealthy d/yr today · 1 by 30 yrs out
Nearby sold comps map
Loading sold comps map…
Walkable amenities ~0.75 mi
Loading nearby amenities…
Taxation est. · year 1
- Rental income
- $10,268
- − Mortgage interest
- −$3,361
- − Property taxes
- −$544
- − Insurance
- −$300
- − Repairs & maintenance
- −$821
- − Management
- −$821
- − Depreciation
- −$1,745
- Taxable income
- $2,675
- Est. tax owed @ 24.0%
- −$642
- After-tax cash flow
- $2,850/yr
For passive investors: Depreciation is non-cash, so a rental often shows a tax loss while cash-flowing — sheltering income. Rental losses are passive: they offset passive income freely, and up to $25,000/yr can offset ordinary (W-2) income if you actively participate and your MAGI is under $100k (phasing out to $0 by $150k); unused losses carry forward. On sale, claimed depreciation is recaptured at up to 25%, and gains may owe capital-gains tax (a 1031 exchange can defer both). Figures are a year-1 estimate at your 24.0% rate — not tax advice; consult a CPA.
Schools (NCES district)
- District
- Frost ISD
- NCES district ID
- 4820040
- Math proficiency
- 30% ▼ -13.00%
- Reading proficiency
- 42% ▬ 0.00%
- Median HH income
- $39,062
- Composite
- 30.09/100
- National rank
- #6344
- State rank
- #517 of 826 in TX
Livability — Mertens
- Score
- 57/100
- State rank
- #1282
- US rank
- #22343
Category grades
Schools grade is shown separately in the Schools card above.
Census & demographics
- Census place
- Mertens, TX
- Population (ZIP)
- 245
Population outlook (Hill County) Hauer SSP2
- Today (2025)
- 34,013 people
- By 2030
- 33,289 · -2.1%
- By 2040
- 31,688 · -6.8%
- By 2050
- 30,100 · -11.5%
- By 2075
- 26,818 · -21.2%
- By 2100
- 22,918 · -32.6%
Race, ethnicity, and origin ACS 2023
- Neighborhood character
- Predominantly White (78%)
- Race & ethnicity
- White 78% Hispanic / Latino 21% Two or more races 4%
- Hispanic origin (detail)
- Mexican 21%
- Foreign-born
- 7% · Canada
- Languages at home
- 85% English-only · Spanish 12% Tagalog/Filipino 1%
Political lean MEDSL · Hill
- 2024 margin
- Solid R (+64.4) · D 17.5% · R 81.8%
- 2008→2024 swing
- -23.0pp toward R · 2008: -41.4pp · 2024: -64.4pp
- All cycles
- 2024: R+64.4 2020: R+60.7 2016: R+58.4 2012: R+53.0 2008: R+41.4
Not yet ingested
- Civics
- —
Market trends
- HPI YoY
- ▲ 3.61%
- Current HPI
- 104.701
- Rent YoY
- —
- Metro
- —
- State GDP YoY
- ▲ 3.95%
- F500 in state
- 110
Industry mix (Fortune 500 HQ in TX)
| Industry | F500 HQs | Revenue |
|---|---|---|
| Energy | 16 | $1,198B |
|
||
| Technology | 5 | $198B |
|
||
| Engineering / Construction | 4 | $72B |
|
||
| Energy Services | 3 | $60B |
|
||
| Utilities | 3 | $41B |
|
||
| Healthcare | 2 | $330B |
|
||
Price history
1 event — show timeline
- 2026-04-27 Listed $60,000 NTREIS
Property tax history
+3.7%/yrLatest (2025): $544 · +17.2% YoY. Source: county tax records.
Cash-flow waterfall
monthlySold comps — $/sqft
last 12 mo · ≤1 miLoading sold comps…