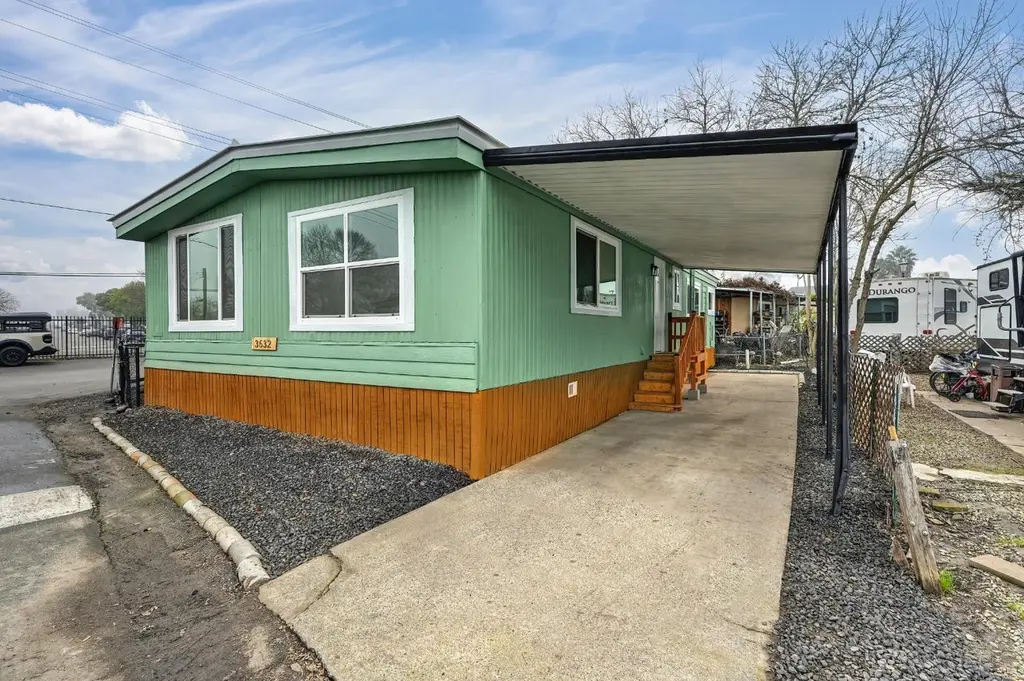
3632 Ohio Ln #67 · North Highlands, CA
Flood risk 6/10 · Moderate
- FEMA flood zone
- AE
- Chance of flooding over 30 yrs
- 0.74%
- Est. flood insurance / yr
- $1,737 – $8,500
Fire risk 1/10 · Minimal
- Est. fire insurance / yr
- $659 – $1,223
Heat risk 7/10 · Major
- Hot days now (above 102°F)
- 7 days/yr
- Hot days in 30 yrs
- 15 days/yr
Wind risk 1/10 · Minimal
- Chance of severe wind over 30 yrs
- —
Air-quality risk 10/10 · Severe
- Unhealthy air days now
- 34 days/yr
- Unhealthy air days in 30 yrs
- 38 days/yr
Risk factors via First Street. Map © Google.
Why this score? — see what drove the B grade
The composite is a weighted blend of 9 inputs, each scored 0–100. Each bar is that input's sub-score; the figure is the points it added to the 100-point composite (weight × sub-score).
- Cash flow +30.0/30.0
- 1% rule +10.0/10.0
- DSCR +10.0/10.0
- ARV discount +7.5/15.0
- Rent growth +3.9/5.0
- Schools +3.1/10.0
- Livability +3.1/5.0
- Condition / age +2.5/5.0
- Appreciation +0.0/10.0
$150,870
🖨 Deal sheet 📄 Offer letter ✓ Due diligence
Listing remarks
Turn-key remodeled Mobile home in Eleven Oaks Mobile Home & RV Park. Fresh interior paint, new flooring, and updated drywall texture gives the home a clean, modern feel. The kitchen has been refreshed with a new sink, island, and cabinetry, plus new range/stove, dishwasher, and refrigerator. Updated bathrooms include a stylish tile shower with modern finishes. Recent improvements also include updated electrical work, new interior doors, a repaired deck with new wood, fence repairs, trimmed trees, and low-maintenance landscaping. Enjoy covered carport parking plus extra parking.
Key facts
- New flooring
- New sink
- Fresh interior paint
Tags
Neighborhood map
What this means for you Summary
Snapshot
- This is a 4-bed/2.0-bath manufactured listed at $151k.
Deal economics
- At list price, monthly cash flow is $429 ($5k/yr) — positive.
- The deal already cash-flows at list — no discount required.
- Meets the 1% rule at list price ($2k rent vs $151k).
- Recommended offer: $137k (9.0% below list) — sets the bar for market timing.
- Cap rate 13.1% vs local median 4.1% in North Highlands — top-decile yield for the area; either an underpriced asset or a hidden risk that comps aren't pricing in. Stress-test before assuming the spread holds.
Location & tenants
- Location reads 61/100 on livability (#523 in CA) — a middle-class / working-renter tenant base. Strengths: housing A+; Watch: employment C-, schools D, crime F.
- Twin Rivers Unified (suburban): math 29% / reading 37% proficiency, ranked #970 of 1,400 in CA (top 69%) — families likely to look elsewhere, expect single-tenant / working-renter base with shorter leases; 76% free/reduced lunch — lower-income household profile, screen leases tightly.
- Market conditions: Rents rising fast (+5.7%/yr); 108 active listings in the ZIP; 9 comparable units currently listed for rent nearby; rentals leasing fast (median 2d on market — plan ~1-2 weeks tenant-placement turnaround); 6,825 units permitted in Sacramento County in 2024 (1,752 in 5+ unit buildings).
- This rent runs 42% of the median local income ($68k/yr) — at the standard rent-burdened threshold; future hikes will face affordability resistance.
Forward outlook
- Local home prices are declining (-3.0%/yr); year-one equity from $1k of loan paydown is wiped out by about $5k of value loss. Plan a longer hold.
- Sacramento County population projected at +17% by 2050 — long-run rental-demand tailwind backs the buy-and-hold thesis.
- At projected returns (-3.0% appreciation + 5.7% rent growth), your $42k cash investment doubles in ~8 years — after that, you're playing with house money.
Negotiation context
- It's been on market 115 days — a 9% lower offer ($137k) is reasonable based on typical stale-listing flexibility.
Risks & watch-outs
- Watch-outs: flood insurance adds $427/mo.
- Climate carrying-cost: in FEMA flood zone AE (mandatory federal flood insurance); extreme-heat days projected 7→15/yr by 2055 (HVAC capex compounding) — expect insurance premiums to compound above CPI over the hold.
Questions for the listing agent
- It's been on market 115 days. Have you received any prior offers? Is the seller open to a 9% concession, seller financing, or rate buy-down credit?
- What's the actual annual flood-insurance premium (NFIP or private), and is the property in a SFHA with mandatory coverage?
- Why hasn't it sold? Are there any deal-killer items the seller is aware of (foundation, flood, title, zoning, code violations)?
- Is there a deadline driving the sale (1031 exchange, divorce, estate, relocation)? That informs how much negotiation room exists.
- Schools are D-rated, which usually means shorter tenancies and higher turnover. Who's the typical renter profile here, and what's been the actual vacancy rate?
- Crime grade is F in this area — have there been break-ins, vandalism, or insurance claims at this property in the last 3 years? What carrier currently insures it and at what premium?
- What's the average days-on-market for RENTAL listings here right now (not sales)? A rising rental-DOM trend means longer vacancies and softer asking-rent achievability than the comps imply.
- What's the recent tenant-quality profile in this submarket — average credit score on applications, eviction rate, late-payment / NSF rate, and stable-employment percentage? A property-management company in the area should have these aggregated.
- How much new for-sale + rental construction is in the pipeline within 1–3 miles? Heavy new supply typically softens prices + rents 12–24 months out; constrained supply supports both.
Investment metrics
- 1% rule
- 1.59% ✓
- Cap rate
- 13.10%
- Cash-on-cash
- 24.31%
- DSCR
- 2.08
- GRM
- 5.2
CMA / ARV
- ARV (median comp)
- $83,743
- List price
- $150,870
- Delta
- 80.16%
- Verdict
- OVERPRICED
- Comps
- 13 within 1.0 mi
Show comp detail 12 sales within ~0.75 mi
| Address | Dist | Beds/Ba | Sqft | Sold | Price | $/sf | Match |
|---|---|---|---|---|---|---|---|
| 4963 Eleven Oaks Ln | 0.09mi | 3/2.0 (-1) | 1,536 (+10%) | 6mo | $140,000 | $91 | 70 |
| 5040 Jackson St #110 | 0.38mi | 3/2.0 (-1) | 1,440 (+3%) | 12mo | $81,500 | $57 | 63 |
| 5040 Jackson St #78 | 0.41mi | 5/2.0 (+1) | 1,440 (+3%) | 20mo | $90,000 | $63 | 54 |
| 5040 Jackson St #54 | 0.52mi | 3/2.0 (-1) | 1,512 (+8%) | 10mo | $75,000 | $50 | 49 |
| 5040 Jackson St #76 | 0.41mi | 3/2.0 (-1) | 1,584 (+13%) | 9mo | $85,000 | $54 | 47 |
| 4133 Potomac Ln | 0.61mi | 3/2.0 (-1) | 1,298 (-7%) | 10mo | $100,000 | $77 | 46 |
| 5040 Jackson St #40 | 0.52mi | 3/2.0 (-1) | 1,475 (+5%) | 20mo | $107,000 | $73 | 45 |
| 5040 Jackson St #23 | 0.41mi | 3/2.0 (-1) | 1,213 (-13%) | 12mo | $119,500 | $99 | 43 |
| 4137 Annapolis Ln #172 | 0.63mi | 3/2.0 (-1) | 1,344 (-4%) | 19mo | $100,000 | $74 | 43 |
| 4139 Minute Man Ln | 0.64mi | 3/2.0 (-1) | 1,283 (-8%) | 11mo | $92,000 | $72 | 42 |
| 4130 Annapolis Ln #159 | 0.60mi | 3/2.0 (-1) | 1,225 (-12%) | 9mo | $107,500 | $88 | 39 |
| 4125 Potomac Ln #129 | 0.58mi | 3/2.0 (-1) | 1,200 (-14%) | 8mo | $58,000 | $48 | 37 |
Match score weights: distance 35% · size 25% · config 20% · recency 20%. Top-matched comps best support the ARV.
Projected returns pro-forma
-3.0% appreciation · 5.69% rent growth · sell at horizon
- IRR
- 5.8%
- Equity multiple
- 1.23×
- Total profit
- $9,863
- Equity at exit
- $22,495
- IRR
- 18.1%
- Equity multiple
- 2.75×
- Total profit
- $73,957
- Equity at exit
- $13,044
Cash invested: $42,244 (down + closing). Projections, not guarantees.
Landlord ↔ Tenant lean methodology
- Overall (STATE)
- 18 Strongly Tenant-Friendly
- State California
- 18 Strongly Tenant-Friendly · D+13
- County
- — inherits STATE
- City
- — inherits STATE
ZIP-level market 95660
- Rents YoY
- 5.7%
- Active inventory
- 108
- Price-to-rent
- 5.2×
Monthly cashflow live
- Estimated rent
- $2,403 high interval (Pro) →
- Mortgage (P&I)
- −$791
- Tax est. 1.5%
- −$189 /mo · $2,263/yr
- Insurance
- −$63
- Flood insurance flood zone
- −$427 /mo · $5,118/yr
- HOA
- −$0
- Vacancy / Maint / Mgmt
- −$505
- Net cashflow
- $429
Break-even live
UW: 25.0% down · 7.5% · 30yr · 1.5% tax · 5.0% vac · 8.0% maint · 8.0% mgmt
Financing live
Cash to close
- Down payment
- $37,718
- Closing costs
- $4,526
- Reserves months
- —
- Total cash needed
- —
Loan-product check · same deal, 3 products live
Conventional
25% down · 7.5% · 30yr
- Down + closing
- —
- Monthly P&I
- —
- Monthly cashflow
- —
- DSCR
- —
- Eligible?
- —
Personal DTI + credit; lowest rate.
DSCR
20% down · 8.5% · 30yr
- Down + closing
- —
- Monthly P&I
- —
- Monthly cashflow
- —
- DSCR
- —
- Eligible?
- —
No personal income docs; deal must DSCR.
Hard money
10% down · 12.0% · 12mo
- Down + closing
- —
- Monthly P&I
- —
- Monthly cashflow
- —
- DSCR
- —
- Eligible?
- —
Short-term bridge; refi at stabilization.
Rent comps 9 comps
| Address | Beds | Baths | Sqft | Rent | $/sqft | DOM | Units | Dist |
|---|---|---|---|---|---|---|---|---|
| 4930 Polk St North Highlands, CA | 2.0–3.0 | 1.0–2.0 | 938 | $1,795 | $1.91 | 1d | 3 | 0.12mi |
| 5625 San Vincente Way North Highlands, CA | 3.0 | 1.0 | 875 | $2,150 | $2.46 | 1d | 1 | 0.98mi |
| 5516 Palmdale Way Sacramento, CA | 3.0 | 2.0 | 1115 | $2,250 | $2.02 | 20d | 1 | 1.05mi |
| 5728 Luce Ave McClellan Park, CA | 2.0–3.0 | 1.0 | 1058 | $2,190 | $2.07 | 1d | 3 | 1.13mi |
| 5733 San Vincente Way North Highlands, CA | 3.0 | 1.0 | 925 | $2,195 | $2.37 | 2d | 1 | 1.16mi |
| 3610 Auburn Blvd Sacramento, CA | 3.0 | 2.0 | 1140 | $2,395 | $2.10 | 7d | 1 | 1.27mi |
| 5001 Date Ave Sacramento, CA | 3.0 | 2.0 | 1106 | $2,400 | $2.17 | 1d | 1 | 1.27mi |
| 4716 Tulane Ct Sacramento, CA | 3.0 | 2.0 | 1303 | $2,450 | $1.88 | 23d | 1 | 1.37mi |
| 6037 N Haven Dr North Highlands, CA | 3.0 | 1.0 | 884 | $2,150 | $2.43 | 1d | 1 | 1.41mi |
Listing history 10 events
-
2026-06-15days on market $150,870 Active 115 DOM
-
2026-06-13days on market $150,870 Active 113 DOM
-
2026-06-13days on market $150,870 Active 112 DOM
-
2026-06-09days on market $150,870 Active 109 DOM
-
2026-06-08days on market $150,870 Active 108 DOM
-
2026-06-07days on market $150,870 Active 107 DOM
-
2026-06-03days on market $150,870 Active 103 DOM
-
2026-06-02days on market $150,870 Active 102 DOM
-
2026-06-01days on market $150,870 Active 101 DOM
-
2026-05-31days on market $150,870 Active 100 DOM
ⓘ Source: listings_history table (triggers on properties + properties_extension) + one-shot
backfill from property_details.listing_events for pre-trigger history.
Climate risk First Street
- Flood 6/10 Major FEMA zone AE · 74% chance over 30 yrs
- Wildfire 1/10 Low
- Heat 7/10 Severe 7 d/yr ≥102°F today · 15 d/yr by 30 yrs out
- Wind 1/10 Low
- Air quality 10/10 Extreme 34 unhealthy d/yr today · 38 by 30 yrs out
Nearby sold comps map
Loading sold comps map…
Walkable amenities ~0.75 mi
Loading nearby amenities…
Taxation est. · year 1
- Rental income
- $28,835
- − Mortgage interest
- −$8,451
- − Property taxes
- −$2,263
- − Insurance
- −$5,873
- − Repairs & maintenance
- −$2,307
- − Management
- −$2,307
- − Depreciation
- −$4,389
- Taxable income
- $3,246
- Est. tax owed @ 24.0%
- −$779
- After-tax cash flow
- $4,371/yr
For passive investors: Depreciation is non-cash, so a rental often shows a tax loss while cash-flowing — sheltering income. Rental losses are passive: they offset passive income freely, and up to $25,000/yr can offset ordinary (W-2) income if you actively participate and your MAGI is under $100k (phasing out to $0 by $150k); unused losses carry forward. On sale, claimed depreciation is recaptured at up to 25%, and gains may owe capital-gains tax (a 1031 exchange can defer both). Figures are a year-1 estimate at your 24.0% rate — not tax advice; consult a CPA.
Schools (NCES district)
- District
- Twin Rivers Unified
- NCES district ID
- 0601332
- Math proficiency
- 29% ▲ 2.00%
- Reading proficiency
- 37% ▲ 2.00%
- Median HH income
- $42,481
- Composite
- 30.67/100
- National rank
- #11437
- State rank
- #970 of 1400 in CA
Livability — North Highlands
- Score
- 61/100
- State rank
- #523
- US rank
- #17613
Category grades
Schools grade is shown separately in the Schools card above.
Census & demographics
- Census place
- North Highlands, CA
- County
- Sacramento County · 1,539,646 people
- City population
- 56,900
- Metro
- Sacramento-Roseville-Folsom, CA
- Population (ZIP)
- 35,451
- Household income
- $68,235
- Rent vs Own
- Severe rent burden
- 1300.0
Population outlook (Sacramento County) Hauer SSP2
- Today (2025)
- 1,660,763 people
- By 2030
- 1,732,990 · +4.3%
- By 2040
- 1,855,755 · +11.7%
- By 2050
- 1,941,335 · +16.9%
- By 2075
- 2,046,162 · +23.2%
- By 2100
- 1,961,444 · +18.1%
Race, ethnicity, and origin ACS 2023
- Neighborhood character
- Diverse neighborhood (Simpson 0.69)
- Race & ethnicity
- White 41% Hispanic / Latino 37% Two or more races 16% Black 9% Asian 7%
- Hispanic origin (detail)
- Mexican 29%
- Common ancestry
- Subsaharan African 5% Scotch-Irish 2% Scandinavian 2%
- Foreign-born
- 28% · Canada, Vietnam
- Languages at home
- 56% English-only · Spanish 25% Russian/Polish/Slavic 9% Other Indo-European 5%
Political lean MEDSL · Sacramento
- 2024 margin
- D (+19.7) · D 58.1% · R 38.4% · Other 3.5%
- 2008→2024 swing
- +0.7pp no change · 2008: 19.0pp · 2024: 19.7pp
- All cycles
- 2024: D+19.7 2020: D+25.3 2016: D+23.7 2012: D+16.3 2008: D+19.0
Not yet ingested
- Civics
- —
Market trends
- HPI YoY
- ▼ -273.83%
- Current HPI
- 438.1022
- Rent YoY
- ▲ 5.69%
- Metro
- Sacramento-Roseville-Folsom, CA
- State GDP YoY
- ▲ 3.21%
- F500 in state
- 116
Industry mix (Fortune 500 HQ in CA)
| Industry | F500 HQs | Revenue |
|---|---|---|
| Technology | 27 | $1,492B |
|
||
| Financial Services | 3 | $174B |
|
||
| Retail | 3 | $44B |
|
||
| Insurance | 3 | $26B |
|
||
| Media / Entertainment | 2 | $115B |
|
||
| Pharmaceuticals / Biotech | 2 | $62B |
|
||
Property tax history
-0.6%/yrLatest (2025): $103 · +0.5% YoY. Source: county tax records.
Cash-flow waterfall
monthlySold comps — $/sqft
last 12 mo · ≤1 miLoading sold comps…