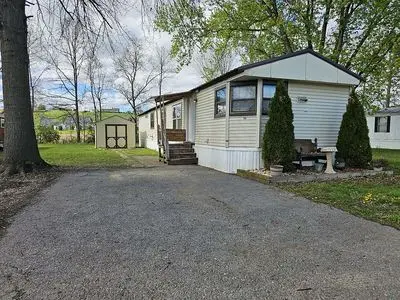
24 Lynn St · Mifflinburg, PA
Flood risk No data
- FEMA flood zone
- —
- Chance of flooding over 30 yrs
- —
- Est. flood insurance / yr
- —
Fire risk No data
- Est. fire insurance / yr
- —
Heat risk No data
- Hot days now (above threshold)
- —
- Hot days in 30 yrs
- —
Wind risk No data
- Chance of severe wind over 30 yrs
- —
Air-quality risk No data
- Unhealthy air days now
- —
- Unhealthy air days in 30 yrs
- —
Risk factors via First Street. Map © Google.
Why this score? — see what drove the B grade
The composite is a weighted blend of 9 inputs, each scored 0–100. Each bar is that input's sub-score; the figure is the points it added to the 100-point composite (weight × sub-score).
- Cash flow +30.0/30.0
- 1% rule +10.0/10.0
- DSCR +10.0/10.0
- ARV discount +7.5/15.0
- Schools +4.4/10.0
- Livability +3.5/5.0
- Rent growth +2.5/5.0
- Condition / age +2.2/5.0
- Appreciation +0.0/10.0
$33,000
🖨 Deal sheet 📄 Offer letter ✓ Due diligence
Listing remarks
3 bedroom 1 bath mobile home on a rented lot. Rent is $550 a month, sewage and water included. Water heater and furnace are newer (approx. 3 years) as well as the flooring being new within the last 3 years. Kitchen floor was just redone April 2026. Propane heat and stove. Shed included, as well as all appliances in photos (stove, fridge, washer and dryer). Large closet in master bedroom and good size closets in the two other bedrooms. $40,000 open to offers and partial trades. Close to town but still quiet and close to 2 playgrounds and the rail trail. Move in ready.
Key facts
- Newer furnace
- Included shed
- New flooring
Tags
Neighborhood map
What this means for you Summary
Snapshot
- This is a 3-bed/1.0-bath other listed at $33k. Condition is rated fair.
Deal economics
- At list price, monthly cash flow is $562 ($7k/yr) — positive.
- The deal already cash-flows at list — no discount required.
- Meets the 1% rule at list price ($1k rent vs $33k).
- Recommended offer: $32k (3.0% below list) — sets the bar for market timing.
- Cap rate 26.7% vs local median 2.7% in Mifflinburg — top-decile yield for the area; either an underpriced asset or a hidden risk that comps aren't pricing in. Stress-test before assuming the spread holds.
Location & tenants
- Location reads 70/100 on livability (#755 in PA) — a middle-class / working-renter tenant base. Strengths: crime A+, cost of living A+, housing A+; Watch: health & safety D, amenities F, commute F.
- Mifflinburg Area SD (town): math 41% / reading 62% proficiency, ranked #163 of 539 in PA (top 30%) — acceptable for families but not a draw, mixed tenant base, ~2y average lease.
- Market conditions: 31 active listings in the ZIP; 1 comparable units currently listed for rent nearby; 49 units permitted in Union County in 2024 (0 in 5+ unit buildings).
Forward outlook
- Local home prices are declining (-3.0%/yr); year-one equity from $228 of loan paydown is wiped out by about $990 of value loss. Plan a longer hold.
- Union County population projected at +5% by 2050 — modest demand growth; plan on rents tracking national, not racing it.
- At projected returns (-3.0% appreciation + 3.0% rent growth), your $9k cash investment doubles in ~2 years — after that, you're playing with house money.
Negotiation context
- It's been on market 38 days — a 3% lower offer ($32k) is reasonable based on typical stale-listing flexibility.
Questions for the listing agent
- It's been on market 38 days. Have you received any prior offers? Is the seller open to a 3% concession, seller financing, or rate buy-down credit?
- Have any recent inspections been done? Can we get a copy of the seller's disclosures and any deferred-maintenance estimates?
- Is there a deadline driving the sale (1031 exchange, divorce, estate, relocation)? That informs how much negotiation room exists.
- Schools are B-rated — typically a magnet for longer-tenancy family renters. What's the average tenant stay here, and is there a school-zone premium baked into asking?
- What's the average days-on-market for RENTAL listings here right now (not sales)? A rising rental-DOM trend means longer vacancies and softer asking-rent achievability than the comps imply.
- What's the recent tenant-quality profile in this submarket — average credit score on applications, eviction rate, late-payment / NSF rate, and stable-employment percentage? A property-management company in the area should have these aggregated.
- How much new for-sale + rental construction is in the pipeline within 1–3 miles? Heavy new supply typically softens prices + rents 12–24 months out; constrained supply supports both.
Investment metrics
- 1% rule
- 3.03% ✓
- Cap rate
- 26.73%
- Cash-on-cash
- 72.98%
- DSCR
- 4.25
- GRM
- 2.8
CMA / ARV
No comps found within radius.
Projected returns pro-forma
-3.0% appreciation · 3.0% rent growth · sell at horizon
- IRR
- 72.7%
- Equity multiple
- 4.30×
- Total profit
- $30,458
- Equity at exit
- $4,920
- IRR
- 76.6%
- Equity multiple
- 8.86×
- Total profit
- $72,670
- Equity at exit
- $2,853
Cash invested: $9,240 (down + closing). Projections, not guarantees.
Landlord ↔ Tenant lean methodology
- Overall (STATE)
- 62 Landlord-Friendly
- State Pennsylvania
- 62 Landlord-Friendly · EVEN
- County
- — inherits STATE
- City
- — inherits STATE
ZIP-level market 17844
- Home prices YoY
- -18.4%
- Active inventory
- 31
- Price-to-rent
- 2.8×
Monthly cashflow live
- Estimated rent
- $1,000 medium interval (Pro) →
- Mortgage (P&I)
- −$173
- Tax est. 1.5%
- −$41 /mo · $495/yr
- Insurance
- −$14
- HOA
- −$0
- Vacancy / Maint / Mgmt
- −$210
- Net cashflow
- $562
Break-even live
UW: 25.0% down · 7.5% · 30yr · 1.5% tax · 5.0% vac · 8.0% maint · 8.0% mgmt
Financing live
Cash to close
- Down payment
- $8,250
- Closing costs
- $990
- Reserves months
- —
- Total cash needed
- —
Loan-product check · same deal, 3 products live
Conventional
25% down · 7.5% · 30yr
- Down + closing
- —
- Monthly P&I
- —
- Monthly cashflow
- —
- DSCR
- —
- Eligible?
- —
Personal DTI + credit; lowest rate.
DSCR
20% down · 8.5% · 30yr
- Down + closing
- —
- Monthly P&I
- —
- Monthly cashflow
- —
- DSCR
- —
- Eligible?
- —
No personal income docs; deal must DSCR.
Hard money
10% down · 12.0% · 12mo
- Down + closing
- —
- Monthly P&I
- —
- Monthly cashflow
- —
- DSCR
- —
- Eligible?
- —
Short-term bridge; refi at stabilization.
Rent comps 1 comps
| Address | Beds | Baths | Sqft | Rent | $/sqft | DOM | Units | Dist |
|---|---|---|---|---|---|---|---|---|
| 607 Chestnut St Unit 607 Mifflinburg, PA | 2.0 | 1.0 | 1100 | $1,000 | $0.91 | 44d | 1 | 0.74mi |
Listing history 18 events
-
2026-06-19days on market $33,000 Active 38 DOM
-
2026-06-18days on market $33,000 Active 37 DOM
-
2026-06-17days on market $33,000 Active 36 DOM
-
2026-06-17price $33,000 Active 35 DOM
-
2026-06-16days on market $40,000 Active 35 DOM
-
2026-06-15days on market $40,000 Active 34 DOM
-
2026-06-14days on market $40,000 Active 32 DOM
-
2026-06-12days on market $40,000 Active 31 DOM
-
2026-06-09days on market $40,000 Active 28 DOM
-
2026-06-08days on market $40,000 Active 27 DOM
-
2026-06-07days on market $40,000 Active 26 DOM
-
2026-06-07days on market $40,000 Active 25 DOM
-
2026-06-04days on market $40,000 Active 22 DOM
-
2026-06-02days on market $40,000 Active 21 DOM
-
2026-06-01days on market $40,000 Active 20 DOM
-
2026-05-31days on market $40,000 Active 19 DOM
-
2026-05-31days on market $40,000 Active 18 DOM
-
2026-05-12$40,000 Active 573-char remark
ⓘ Source: listings_history table (triggers on properties + properties_extension) + one-shot
backfill from property_details.listing_events for pre-trigger history.
Nearby sold comps map
Loading sold comps map…
Walkable amenities ~0.75 mi
Loading nearby amenities…
Taxation est. · year 1
- Rental income
- $12,000
- − Mortgage interest
- −$1,849
- − Property taxes
- −$495
- − Insurance
- −$165
- − Repairs & maintenance
- −$960
- − Management
- −$960
- − Depreciation
- −$960
- Taxable income
- $6,611
- Est. tax owed @ 24.0%
- −$1,587
- After-tax cash flow
- $5,157/yr
For passive investors: Depreciation is non-cash, so a rental often shows a tax loss while cash-flowing — sheltering income. Rental losses are passive: they offset passive income freely, and up to $25,000/yr can offset ordinary (W-2) income if you actively participate and your MAGI is under $100k (phasing out to $0 by $150k); unused losses carry forward. On sale, claimed depreciation is recaptured at up to 25%, and gains may owe capital-gains tax (a 1031 exchange can defer both). Figures are a year-1 estimate at your 24.0% rate — not tax advice; consult a CPA.
Condition & rehab AI · 1 photo
This mobile home is in fair condition with good systems and recent updates. It is move-in ready with some minor landscaping and curb appeal improvements needed to maximize its value.
Value-add opportunities
- Both Landscaping and curb appeal improvements — Enhances curb appeal and could attract more renters or buyers.
- Both Painting exterior and interior walls — Fresh paint can make the home look more inviting and maintain its value.
- Both Landscaping and curb appeal improvements — Enhances curb appeal and could attract more renters or buyers.
Renovation cost estimate screening
Value-add ROI direction
- Both Landscaping and curb appeal improvements — Enhances curb appeal and could attract more renters or buyers. ↑
- Both Painting exterior and interior walls — Fresh paint can make the home look more inviting and maintain its value. ↑
- Both Landscaping and curb appeal improvements — Enhances curb appeal and could attract more renters or buyers. ↑
ⓘ Cost ranges are severity-bucket heuristics (US national rule-of-thumb). Get contractor quotes + a written scope before underwriting a rehab budget.
Schools (NCES district)
- District
- Mifflinburg Area SD
- NCES district ID
- 4226010
- Math proficiency
- 41% ▼ -10.00%
- Reading proficiency
- 62% ▼ -2.00%
- Median HH income
- $47,753
- Composite
- 43.73/100
- National rank
- #2949
- State rank
- #163 of 539 in PA
Livability — Mifflinburg
- Score
- 70/100
- State rank
- #755
- US rank
- #7547
Category grades
Schools grade is shown separately in the Schools card above.
Census & demographics
- Census place
- Mifflinburg, PA
- Population (ZIP)
- 10,374
Population outlook (Union County) Hauer SSP2
- Today (2025)
- 46,664 people
- By 2030
- 47,704 · +2.2%
- By 2040
- 48,798 · +4.6%
- By 2050
- 49,048 · +5.1%
- By 2075
- 47,491 · +1.8%
- By 2100
- 41,817 · -10.4%
Race, ethnicity, and origin ACS 2023
- Neighborhood character
- Predominantly White (95%)
- Race & ethnicity
- White 95% Hispanic / Latino 3% Two or more races 2%
- Common ancestry
- Romanian 2% Polish 2% Scotch-Irish 2%
- Foreign-born
- 0%
- Languages at home
- 88% English-only · German/W. Germanic 10% Russian/Polish/Slavic 1%
Political lean MEDSL · Union
- 2024 margin
- Strong R (+23.4) · D 37.8% · R 61.2%
- 2008→2024 swing
- -8.9pp toward R · 2008: -14.5pp · 2024: -23.4pp
- All cycles
- 2024: R+23.4 2020: R+24.3 2016: R+25.7 2012: R+23.5 2008: R+14.5
Not yet ingested
- Civics
- —
Market trends
- HPI YoY
- ▼ -42.70%
- Current HPI
- 189.7833
- Rent YoY
- —
- Metro
- —
- State GDP YoY
- ▲ 1.68%
- F500 in state
- 34
Industry mix (Fortune 500 HQ in PA)
| Industry | F500 HQs | Revenue |
|---|---|---|
| Healthcare | 2 | $309B |
|
||
| Insurance | 2 | $27B |
|
||
| Telecommunications / Media | 1 | $124B |
|
||
| Industrial Distribution | 1 | $22B |
|
||
| Financial Services | 1 | $20B |
|
||
| Chemicals / Materials | 1 | $18B |
|
||
Price history
-17.5% since first listed2 events — show timeline
- 2026-06-16 Price Changed $33,000 FSBO.com
- 2026-05-12 Listed $40,000 FSBO.com
Cash-flow waterfall
monthlySold comps — $/sqft
last 12 mo · ≤1 miLoading sold comps…