12860 Aldrich Settlement Rd · Natural Bridge, NY
Flood risk 1/10 · Minimal
- FEMA flood zone
- X
- Chance of flooding over 30 yrs
- 0.0%
- Est. flood insurance / yr
- $507 – $1,088
Fire risk 1/10 · Minimal
- Est. fire insurance / yr
- $691 – $1,283
Heat risk 1/10 · Minimal
- Hot days now (above 90°F)
- 7 days/yr
- Hot days in 30 yrs
- 16 days/yr
Wind risk 1/10 · Minimal
- Chance of severe wind over 30 yrs
- —
Air-quality risk 1/10 · Minimal
- Unhealthy air days now
- 0 days/yr
- Unhealthy air days in 30 yrs
- 0 days/yr
Risk factors via First Street. Map © Google.
Why this score? — see what drove the C grade
The composite is a weighted blend of 9 inputs, each scored 0–100. Each bar is that input's sub-score; the figure is the points it added to the 100-point composite (weight × sub-score).
- Cash flow +22.0/30.0
- ARV discount +7.5/15.0
- DSCR +7.0/10.0
- 1% rule +5.8/10.0
- Appreciation +5.4/10.0
- Schools +3.4/10.0
- Livability +2.9/5.0
- Rent growth +2.5/5.0
- Condition / age +2.5/5.0
$74,900
🖨 Deal sheet 📄 Offer letter ✓ Due diligence
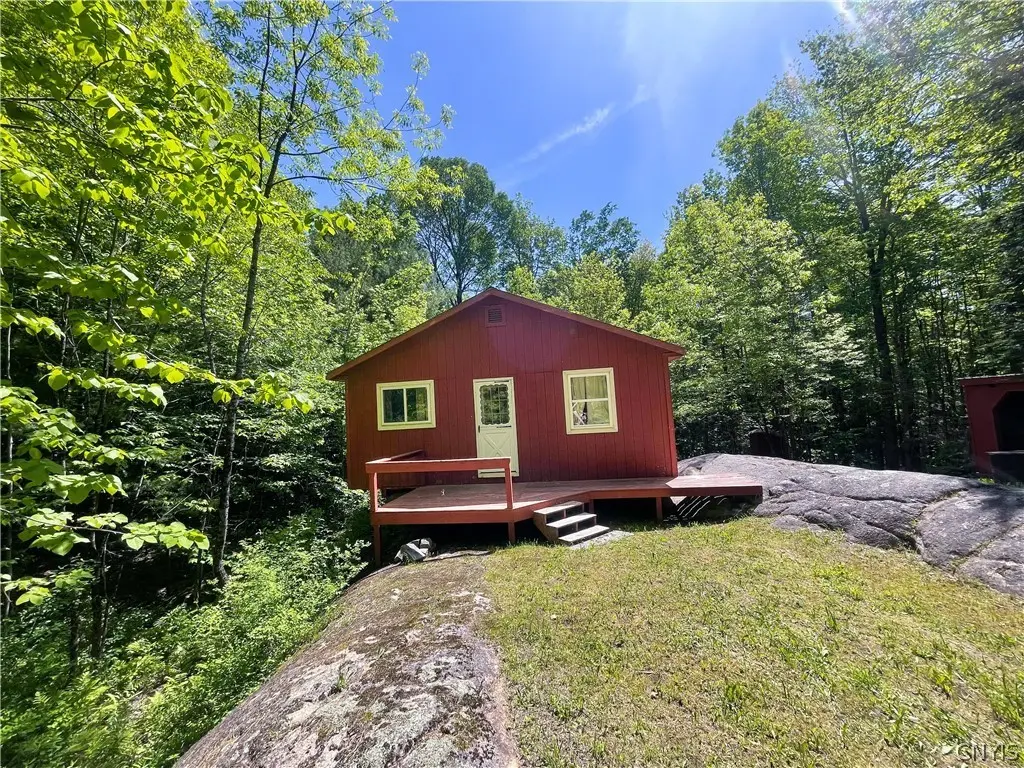
Listing remarks
Escape to the peace and quiet of the North Country with this cozy 2-bedroom cabin situated on 1.2 acres and bordering State land on three sides. Rebuilt in 2004, the cabin features insulation in the floors, walls, and ceilings, along with a wood stove that efficiently heats the space. Being sold being sold AS-IS and fully furnished, this property is ready for immediate enjoyment as a hunting camp, recreational getaway, or weekend retreat. One bedroom offers fresh drywall ready for paint, while the second is prepped for new flooring, allowing you to add your own finishing touches. Property includes a woodshed and outhouse. No indoor bathroom. Conveniently located in the Harrisville School Di
Key facts
- Fresh drywall
- Wood stove
- 1.2 acres
Tags
Property features AI
Exterior
- Parking: No garage
- Utilities: No municipal water available; No municipal sewer available
- Home design: Single-story; Metal roof; Wood siding; Block foundation; Finished lot
- Construction: Wood siding construction; Metal roof; Block foundation; Built as a single-story structure
- Exterior features: Dirt driveway; Open porch; Outhouse; Partially wooded grounds; Adjacent to public land; Irregular, rural wooded lot; Recreational potential
Interior
- Kitchen: Freezer; Gas oven; Gas range; Refrigerator
- Bedrooms: 2 main-level bedrooms
- Heating & cooling: Heating: see remarks
- Interior features: Furnished; See remarks for additional interior details; One fireplace
Neighborhood map
What this means for you Summary
Snapshot
- This is a 1-bed/?-bath single-family listed at $75k.
Deal economics
- At list price, monthly cash flow is $119 ($1k/yr) — positive.
- The deal already cash-flows at list — no discount required.
- Meets the 1% rule at list price ($806 rent vs $75k).
Location & tenants
- Location reads 58/100 on livability (#1,057 in NY) — a working-class tenant base; expect higher turnover. Strengths: cost of living A+; Watch: housing D+, schools D, health & safety D.
- Harrisville Central School District (rural): math 35% / reading 40% proficiency, ranked #673 of 755 in NY (top 89%) — families likely to look elsewhere, expect single-tenant / working-renter base with shorter leases.
- Market conditions: 6 active listings in the ZIP; 110 units permitted in Lewis County in 2024 (0 in 5+ unit buildings).
Forward outlook
- In year one you build about $1k of equity ($518 loan paydown + $657 appreciation (0.9% local appreciation)).
- Lewis County population projected at -20% by 2050 — secular population decline; favor cash flow + early exit over multi-decade hold.
- At projected returns (0.9% appreciation + 3.0% rent growth), your $21k cash investment doubles in ~7 years — after that, you're playing with house money.
Negotiation context
- Only 13 days on market — expect competitive offers; lowballing is unlikely to land.
Questions for the listing agent
- Is there a deadline driving the sale (1031 exchange, divorce, estate, relocation)? That informs how much negotiation room exists.
- Schools are D-rated, which usually means shorter tenancies and higher turnover. Who's the typical renter profile here, and what's been the actual vacancy rate?
- Crime grade is F in this area — have there been break-ins, vandalism, or insurance claims at this property in the last 3 years? What carrier currently insures it and at what premium?
- What's the average days-on-market for RENTAL listings here right now (not sales)? A rising rental-DOM trend means longer vacancies and softer asking-rent achievability than the comps imply.
- What's the recent tenant-quality profile in this submarket — average credit score on applications, eviction rate, late-payment / NSF rate, and stable-employment percentage? A property-management company in the area should have these aggregated.
- How much new for-sale + rental construction is in the pipeline within 1–3 miles? Heavy new supply typically softens prices + rents 12–24 months out; constrained supply supports both.
Investment metrics
- 1% rule
- 1.08% ✓
- Cap rate
- 8.21%
- Cash-on-cash
- 6.83%
- DSCR
- 1.30
- GRM
- 7.7
CMA / ARV
No comps found within radius.
Projected returns pro-forma
0.88% appreciation · 3.0% rent growth · sell at horizon
- IRR
- 8.1%
- Equity multiple
- 1.41×
- Total profit
- $8,569
- Equity at exit
- $25,091
- IRR
- 12.3%
- Equity multiple
- 2.47×
- Total profit
- $30,819
- Equity at exit
- $32,977
Cash invested: $20,972 (down + closing). Projections, not guarantees.
Landlord ↔ Tenant lean methodology
- Overall (STATE)
- 15 Strongly Tenant-Friendly
- State New York
- 15 Strongly Tenant-Friendly · D+10
- County
- — inherits STATE
- City
- — inherits STATE
ZIP-level market 13665
- Home prices YoY
- 0.2%
- Active inventory
- 6
- Price-to-rent
- 7.7×
Monthly cashflow live
- Estimated rent
- $806 medium interval (Pro) →
- Mortgage (P&I)
- −$393
- Tax from tax record
- −$93 /mo · $1,122/yr
- Insurance
- −$31
- HOA
- −$0
- Vacancy / Maint / Mgmt
- −$169
- Net cashflow
- $119
Break-even live
UW: 25.0% down · 7.5% · 30yr · 1.5% tax · 5.0% vac · 8.0% maint · 8.0% mgmt
Financing live
Cash to close
- Down payment
- $18,725
- Closing costs
- $2,247
- Reserves months
- —
- Total cash needed
- —
Loan-product check · same deal, 3 products live
Conventional
25% down · 7.5% · 30yr
- Down + closing
- —
- Monthly P&I
- —
- Monthly cashflow
- —
- DSCR
- —
- Eligible?
- —
Personal DTI + credit; lowest rate.
DSCR
20% down · 8.5% · 30yr
- Down + closing
- —
- Monthly P&I
- —
- Monthly cashflow
- —
- DSCR
- —
- Eligible?
- —
No personal income docs; deal must DSCR.
Hard money
10% down · 12.0% · 12mo
- Down + closing
- —
- Monthly P&I
- —
- Monthly cashflow
- —
- DSCR
- —
- Eligible?
- —
Short-term bridge; refi at stabilization.
Listing history 10 events
-
2026-06-18days on market $74,900 Active 13 DOM
-
2026-06-17days on market $74,900 Active 12 DOM
-
2026-06-16days on market $74,900 Active 11 DOM
-
2026-06-15days on market $74,900 Active 10 DOM
-
2026-06-13days on market $74,900 Active 8 DOM
-
2026-06-12days on market $74,900 Active 7 DOM
-
2026-06-09days on market $74,900 Active 4 DOM
-
2026-06-08days on market $74,900 Active 3 DOM
-
2026-06-07remarks 699-char remark
-
2026-06-07$74,900 Active 2 DOM
ⓘ Source: listings_history table (triggers on properties + properties_extension) + one-shot
backfill from property_details.listing_events for pre-trigger history.
Tax reassessment forecast NY · Partial reset (capped growth)
- Current annual tax
- $1,122 · $93/mo
- Projected year-2 tax
- $1,194 · $99/mo
- Expected delta
- +$72/yr (+$6/mo · 6.4%)
ⓘ Screening estimate from a state-policy table — verify with the county assessor before closing.
Climate risk First Street
- Flood 1/10 Low FEMA zone X · 0% chance over 30 yrs
- Wildfire 1/10 Low
- Heat 1/10 Low 7 d/yr ≥90°F today · 16 d/yr by 30 yrs out
- Wind 1/10 Low
- Air quality 1/10 Low 0 unhealthy d/yr today · 0 by 30 yrs out
Nearby sold comps map
Loading sold comps map…
Walkable amenities ~0.75 mi
Loading nearby amenities…
Taxation est. · year 1
- Rental income
- $9,674
- − Mortgage interest
- −$4,196
- − Property taxes
- −$1,122
- − Insurance
- −$374
- − Repairs & maintenance
- −$774
- − Management
- −$774
- − Depreciation
- −$2,179
- Taxable income
- $256
- Est. tax owed @ 24.0%
- −$61
- After-tax cash flow
- $1,372/yr
For passive investors: Depreciation is non-cash, so a rental often shows a tax loss while cash-flowing — sheltering income. Rental losses are passive: they offset passive income freely, and up to $25,000/yr can offset ordinary (W-2) income if you actively participate and your MAGI is under $100k (phasing out to $0 by $150k); unused losses carry forward. On sale, claimed depreciation is recaptured at up to 25%, and gains may owe capital-gains tax (a 1031 exchange can defer both). Figures are a year-1 estimate at your 24.0% rate — not tax advice; consult a CPA.
Schools (NCES district)
- District
- Harrisville Central School District
- NCES district ID
- 3613770
- Math proficiency
- 35% ▬ 0.00%
- Reading proficiency
- 40% ▲ 5.00%
- Median HH income
- $43,727
- Composite
- 34.34/100
- National rank
- #10205
- State rank
- #673 of 755 in NY
Livability — Natural Bridge
- Score
- 58/100
- State rank
- #1057
- US rank
- #21119
Category grades
Schools grade is shown separately in the Schools card above.
Census & demographics
- Population (ZIP)
- 686
Population outlook (Lewis County) Hauer SSP2
- Today (2025)
- 26,126 people
- By 2030
- 25,354 · -3.0%
- By 2040
- 23,359 · -10.6%
- By 2050
- 20,927 · -19.9%
- By 2075
- 15,533 · -40.5%
- By 2100
- 10,215 · -60.9%
Race, ethnicity, and origin ACS 2023
- Neighborhood character
- Predominantly White (97%)
- Race & ethnicity
- White 97% Black 2%
- Common ancestry
- Romanian 3% Lithuanian 2% German 1%
- Languages at home
- 98% English-only · Other Indo-European 2%
Political lean MEDSL · Lewis
- 2024 margin
- Solid R (+44.4) · D 27.8% · R 72.2%
- 2008→2024 swing
- -35.6pp toward R · 2008: -8.8pp · 2024: -44.4pp
- All cycles
- 2024: R+44.4 2020: R+39.2 2016: R+39.6 2012: R+8.7 2008: R+8.8
Not yet ingested
- Civics
- —
Market trends
- HPI YoY
- ▲ 0.88%
- Current HPI
- 379.8545
- Rent YoY
- —
- Metro
- —
- State GDP YoY
- ▲ 2.60%
- F500 in state
- 92
Industry mix (Fortune 500 HQ in NY)
| Industry | F500 HQs | Revenue |
|---|---|---|
| Financial Services | 10 | $950B |
|
||
| Consumer Goods | 9 | $162B |
|
||
| Insurance | 4 | $225B |
|
||
| Telecommunications | 2 | $144B |
|
||
| Pharmaceuticals | 2 | $112B |
|
||
| Media / Entertainment | 2 | $69B |
|
||
Price history
1 event — show timeline
- 2026-06-05 Listed $74,900 CNYIS
Property tax history
-3.9%/yrLatest (2025): $1,122 · +1.2% YoY. Source: county tax records.
Cash-flow waterfall
monthlySold comps — $/sqft
last 12 mo · ≤1 miLoading sold comps…