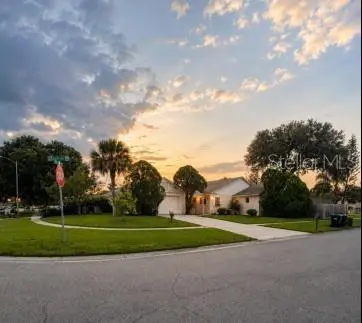
20669 Mallard Pkwy · Wedgefield, FL
Flood risk 3/10 · Minor
- FEMA flood zone
- X (unshaded)
- Chance of flooding over 30 yrs
- 0.2%
- Est. flood insurance / yr
- $507 – $1,088
Fire risk 7/10 · Major
- Est. fire insurance / yr
- $947 – $1,759
Heat risk 9/10 · Severe
- Hot days now (above 107°F)
- 7 days/yr
- Hot days in 30 yrs
- 23 days/yr
Wind risk 10/10 · Severe
- Chance of severe wind over 30 yrs
- 99.0%
Air-quality risk 2/10 · Minimal
- Unhealthy air days now
- 0 days/yr
- Unhealthy air days in 30 yrs
- 1 days/yr
Risk factors via First Street. Map © Google.
Why this score? — see what drove the D grade
The composite is a weighted blend of 9 inputs, each scored 0–100. Each bar is that input's sub-score; the figure is the points it added to the 100-point composite (weight × sub-score).
- Cash flow +14.5/30.0
- ARV discount +7.5/15.0
- DSCR +4.4/10.0
- Schools +4.1/10.0
- Livability +3.4/5.0
- 1% rule +2.8/10.0
- Rent growth +2.5/5.0
- Condition / age +2.5/5.0
- Appreciation +0.0/10.0
$299,000
🖨 Deal sheet (PDF) 📄 Offer letter ✓ Due diligence
Listing remarks
Under contract-accepting backup offers. Welcome home to this well-maintained 3-bedroom, 2-bath home situated on a desirable corner lot in the heart of Wedgefield. Offering a spacious split-bedroom floor plan, this home features tile flooring throughout the main living areas and brand-new carpet in the primary bedroom for added comfort. The light-filled living and dining area boasts soaring vaulted ceilings and skylights, creating an open and airy atmosphere. The kitchen offers ample cabinet and counter space and is equipped with a stainless steel oversized refrigerator, making meal prep and entertaining a breeze. The spacious primary suite features a large walk-in closet and private bath, w
Key facts
- Community park
- Vaulted ceilings
- Skylights
Tags
Property features AI
Finance
- Other: Homestead exemption; No lease restrictions; Located on the corner of Mallard Pkwy across from a large vacant lot
- HOA & community: Has HOA (association name TBD) — optional fees; Cats and dogs allowed
Exterior
- Parking: Attached 2-car garage
- Utilities: Public water; Public sewer; Cable connected; Electricity connected; Water connected
- Home design: Residential half duplex; Single-story (one level); Faces north
- Construction: Block and stucco construction; Shingle roof; Slab foundation; Built on 0.16-acre lot
- Exterior features: Private mailbox; Sliding doors; Wood fencing; Asphalt road access
Interior
- Kitchen: Cooktop; Range; Refrigerator
- Bedrooms: 3 bedrooms
- Flooring: Carpet; Tile
- Bathrooms: 2 full bathrooms
- Heating & cooling: Central heating; Central air conditioning
- Interior features: Thermostat; Skylight(s)
- Laundry & utility: Laundry room
Neighborhood map
What this means for you Summary
Snapshot
- This is a 3-bed/2.0-bath townhouse listed at $299k.
Deal economics
- At list price, monthly cash flow is $68 ($814/yr) — positive.
- The deal already cash-flows at list — no discount required.
- To meet the 1% rule (rent ≥ 1% of price), the offer needs to be $233k (22.1% below list).
- Recommended offer: $233k (22.1% below list) — sets the bar for 1% rule.
- Cap rate 6.6% vs local median 2.1% in Wedgefield — top-decile yield for the area; either an underpriced asset or a hidden risk that comps aren't pricing in. Stress-test before assuming the spread holds.
Location & tenants
- Location reads 68/100 on livability (#523 in FL) — a middle-class / working-renter tenant base. Strengths: crime A+, employment A+, housing A+; Watch: cost of living C-, amenities F, commute F.
- Orange (suburban): math 46% / reading 51% proficiency, ranked #43 of 73 in FL (top 59%) — families likely to look elsewhere, expect single-tenant / working-renter base with shorter leases.
- Zoned schools: Columbia Elementary (math 62% / reading 67%, grade B, #525 of 2,144 statewide, top 26%, 509 students, 50% FRL); Corner Lake Middle (math 42% / reading 47%, grade D, #320 of 571 statewide, top 57%, 841 students, 54% FRL); East River High (math 27% / reading 47%, grade F, #340 of 667 statewide, top 52%, 2,050 students, 45% FRL).
- Market conditions: 194 active listings in the ZIP; 1 comparable units currently listed for rent nearby; solid renter incomes; 8,053 units permitted in Orange County in 2024 (3,133 in 5+ unit buildings).
Forward outlook
- Local home prices are declining (-3.0%/yr); year-one equity from $2k of loan paydown is wiped out by about $9k of value loss. Plan a longer hold.
- Orange County population projected at +52% by 2050 — long-run rental-demand tailwind backs the buy-and-hold thesis.
Negotiation context
- It's been on market 15 days — a 2% lower offer ($295k) is reasonable based on typical stale-listing flexibility.
- Current owner paid $102k; list at $299k implies a 194% gain — meaningful room to come down on a strong offer.
Risks & watch-outs
- Climate carrying-cost: severe wind risk, 99% chance of damaging wind over 30y; major wildfire risk; extreme-heat days projected 7→23/yr by 2055 (HVAC capex compounding) — expect insurance premiums to compound above CPI over the hold.
Questions for the listing agent
- Is there a deadline driving the sale (1031 exchange, divorce, estate, relocation)? That informs how much negotiation room exists.
- Schools are D-rated, which usually means shorter tenancies and higher turnover. Who's the typical renter profile here, and what's been the actual vacancy rate?
- The area grade is low — what's the realistic commute time and amenity access for the typical tenant pool here? Any planned neighborhood developments (good or bad) we should know about?
- What's the average days-on-market for RENTAL listings here right now (not sales)? A rising rental-DOM trend means longer vacancies and softer asking-rent achievability than the comps imply.
- What's the recent tenant-quality profile in this submarket — average credit score on applications, eviction rate, late-payment / NSF rate, and stable-employment percentage? A property-management company in the area should have these aggregated.
- How much new for-sale + rental construction is in the pipeline within 1–3 miles? Heavy new supply typically softens prices + rents 12–24 months out; constrained supply supports both.
Investment metrics
- 1% rule
- 0.78% ✗
- Cap rate
- 6.57%
- Cash-on-cash
- 0.97%
- DSCR
- 1.04
- GRM
- 10.7
CMA / ARV
No comps found within radius.
Projected returns pro-forma
-3.0% appreciation · 3.0% rent growth · sell at horizon
- IRR
- -14.8%
- Equity multiple
- 0.47×
- Total profit
- $-44,278
- Equity at exit
- $44,582
- IRR
- -6.3%
- Equity multiple
- 0.60×
- Total profit
- $-33,588
- Equity at exit
- $25,852
Cash invested: $83,720 (down + closing). Projections, not guarantees.
Landlord ↔ Tenant lean methodology
- Overall (STATE)
- 87 Strongly Landlord-Friendly
- State Florida
- 87 Strongly Landlord-Friendly · R+3
- County
- — inherits STATE
- City
- — inherits STATE
ZIP-level market 32833
- Home prices YoY
- -12.9%
- Active inventory
- 194
- Price-to-rent
- 10.7×
Monthly cashflow live
- Estimated rent
- $2,328 medium interval (Pro) →
- Mortgage (P&I)
- −$1,568
- Tax from tax record
- −$79 /mo · $945/yr
- Insurance
- −$125
- HOA
- −$0
- Vacancy / Maint / Mgmt
- −$489
- Net cashflow
- $68
Break-even live
Sensitivity live
| Price | -10% $237 | -5% $152 | +0% $68 | +5% $-17 | +10% $-101 |
|---|---|---|---|---|---|
| Rent | -10% $-116 | -5% $-24 | +0% $68 | +5% $160 | +10% $252 |
| Rate | -1.0pp $218 | -0.5pp $144 | base $68 | +0.5pp $-10 | +1.0pp $-88 |
UW: 25.0% down · 7.5% · 30yr · 1.5% tax · 5.0% vac · 8.0% maint · 8.0% mgmt
Financing live
Cash to close
- Down payment
- $74,750
- Closing costs
- $8,970
- Reserves months
- —
- Total cash needed
- —
Loan-product check · same deal, 3 products live
Conventional
25% down · 7.5% · 30yr
- Down + closing
- —
- Monthly P&I
- —
- Monthly cashflow
- —
- DSCR
- —
- Eligible?
- —
Personal DTI + credit; lowest rate.
DSCR
20% down · 8.5% · 30yr
- Down + closing
- —
- Monthly P&I
- —
- Monthly cashflow
- —
- DSCR
- —
- Eligible?
- —
No personal income docs; deal must DSCR.
Hard money
10% down · 12.0% · 12mo
- Down + closing
- —
- Monthly P&I
- —
- Monthly cashflow
- —
- DSCR
- —
- Eligible?
- —
Short-term bridge; refi at stabilization.
Rent comps 1 comps
| Address | Beds | Baths | Sqft | Rent | $/sqft | DOM | Units | Dist |
|---|---|---|---|---|---|---|---|---|
| 20515 Macon Pkwy Orlando, FL | 3.0 | 2.0 | 1468 | $2,100 | $1.43 | 26d | 1 | 0.21mi |
Listing history 12 events
-
2026-06-21status $299,000 Pending 15 DOM
-
2026-06-18days on market $299,000 Active 15 DOM
-
2026-06-17days on market $299,000 Active 14 DOM
-
2026-06-16days on market $299,000 Active 13 DOM
-
2026-06-15days on market $299,000 Active 12 DOM
-
2026-06-13days on market $299,000 Active 10 DOM
-
2026-06-13days on market $299,000 Active 9 DOM
-
2026-06-09days on market $299,000 Active 6 DOM
-
2026-06-08days on market $299,000 Active 5 DOM
-
2026-06-07days on market $299,000 Active 4 DOM
-
2026-06-04remarks 699-char remark
-
2026-06-04$299,000 Active 1 DOM
ⓘ Source: listings_history table (triggers on properties + properties_extension) + one-shot
backfill from property_details.listing_events for pre-trigger history.
Tax reassessment forecast FL · Resets to sale price
- Current annual tax
- $945 · $79/mo
- Projected year-2 tax
- $2,482 · $207/mo
- Expected delta
- +$1,537/yr (+$128/mo · 162.7%)
ⓘ Screening estimate from a state-policy table — verify with the county assessor before closing.
Climate risk First Street
- Flood 3/10 Moderate FEMA zone X (unshaded) · 20% chance over 30 yrs
- Wildfire 7/10 Severe
- Heat 9/10 Extreme 7 d/yr ≥107°F today · 23 d/yr by 30 yrs out
- Wind 10/10 Extreme 99% chance of damaging wind over 30 yrs
- Air quality 2/10 Low 0 unhealthy d/yr today · 1 by 30 yrs out
Nearby sold comps map
Loading sold comps map…
Walkable amenities ~0.75 mi
Loading nearby amenities…
Taxation est. · year 1
- Rental income
- $27,936
- − Mortgage interest
- −$16,749
- − Property taxes
- −$945
- − Insurance
- −$1,495
- − Repairs & maintenance
- −$2,235
- − Management
- −$2,235
- − Depreciation
- −$8,698
- Taxable loss
- −$4,420
- Est. tax savings @ 24.0%
- +$1,061
- After-tax cash flow
- $1,875/yr
For passive investors: Depreciation is non-cash, so a rental often shows a tax loss while cash-flowing — sheltering income. Rental losses are passive: they offset passive income freely, and up to $25,000/yr can offset ordinary (W-2) income if you actively participate and your MAGI is under $100k (phasing out to $0 by $150k); unused losses carry forward. On sale, claimed depreciation is recaptured at up to 25%, and gains may owe capital-gains tax (a 1031 exchange can defer both). Figures are a year-1 estimate at your 24.0% rate — not tax advice; consult a CPA.
Schools (NCES district)
- District
- Orange
- NCES district ID
- 1201440
- Math proficiency
- 46% ▼ -9.00%
- Reading proficiency
- 51% ▼ -2.00%
- Median HH income
- $49,350
- Composite
- 41.47/100
- National rank
- #3461
- State rank
- #43 of 73 in FL
Livability — Wedgefield
- Score
- 68/100
- State rank
- #523
- US rank
- #9669
Category grades
Schools grade is shown separately in the Schools card above.
Census & demographics
- Census place
- Wedgefield, FL
- County
- Orange County · 1,471,359 people
- City population
- 11,389
- Metro
- Orlando-Kissimmee-Sanford, FL
- Population (ZIP)
- 11,389
- Household income
- $98,733
- Rent vs Own
- Severe rent burden
- 206.0
Population outlook (Orange County) Hauer SSP2
- Today (2025)
- 1,618,226 people
- By 2030
- 1,787,404 · +10.5%
- By 2040
- 2,125,621 · +31.4%
- By 2050
- 2,454,016 · +51.6%
- By 2075
- 3,173,711 · +96.1%
- By 2100
- 3,607,781 · +122.9%
Race, ethnicity, and origin ACS 2023
- Neighborhood character
- Diverse neighborhood (Simpson 0.65)
- Race & ethnicity
- White 51% Hispanic / Latino 26% Black 11% Two or more races 10% Asian 6%
- Hispanic origin (detail)
- Mexican 2% Puerto Rican 16% Cuban 4%
- Common ancestry
- Italian 2% Hispanic 2% Lithuanian 2%
- Foreign-born
- 15% · Canada, Vietnam, Jamaica
- Languages at home
- 75% English-only · Spanish 20% Vietnamese 2% Tagalog/Filipino 2%
Political lean MEDSL · Orange
- 2024 margin
- D (+13.6) · D 56.1% · R 42.5% · Other 1.3%
- 2008→2024 swing
- -5.0pp toward R · 2008: 18.6pp · 2024: 13.6pp
- All cycles
- 2024: D+13.6 2020: D+23.1 2016: D+24.6 2012: D+18.2 2008: D+18.6
Not yet ingested
- Civics
- —
Market trends
- HPI YoY
- ▼ -47.65%
- Current HPI
- 321.412
- Rent YoY
- —
- Metro
- Orlando-Kissimmee-Sanford, FL
- State GDP YoY
- ▲ 3.28%
- F500 in state
- 36
Industry mix (Fortune 500 HQ in FL)
| Industry | F500 HQs | Revenue |
|---|---|---|
| Industrial Technology | 2 | $29B |
|
||
| Insurance | 2 | $17B |
|
||
| Retail | 1 | $60B |
|
||
| Technology Distribution | 1 | $58B |
|
||
| Homebuilding | 1 | $35B |
|
||
| Technology Manufacturing | 1 | $35B |
|
||
Price history
+349.6% since first listed3 events — show timeline
- 2026-06-03 Listed $299,000 Stellar MLS as Distributed by MLS Grid
- 1998-12-02 Sold (Public Records) $101,800 Public Records
- 1987-07-01 Sold (Public Records) $66,500 Public Records
Property tax history
+2.6%/yrLatest (2025): $945 · +12.9% YoY. Source: county tax records.
Cash-flow waterfall
monthlySold comps — $/sqft
last 12 mo · ≤1 miLoading sold comps…