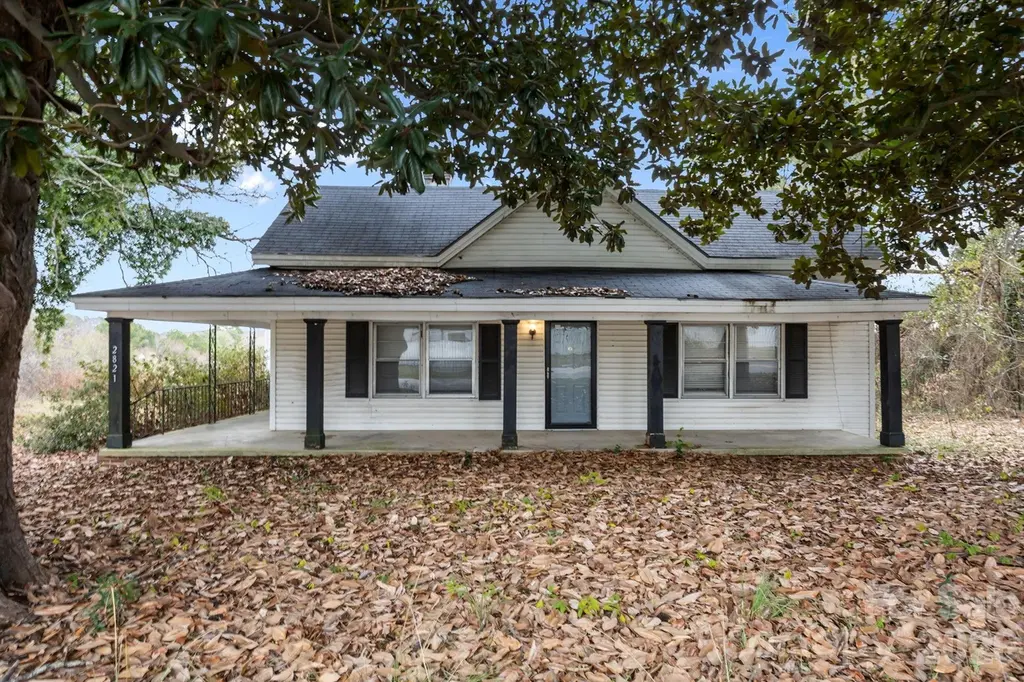
2821 Old Fairground Rd · Angier, NC
Flood risk 1/10 · Minimal
- FEMA flood zone
- X (unshaded)
- Chance of flooding over 30 yrs
- 0.0%
- Est. flood insurance / yr
- $507 – $1,088
Fire risk 4/10 · Minor
- Est. fire insurance / yr
- $906 – $1,684
Heat risk 7/10 · Major
- Hot days now (above 106°F)
- 7 days/yr
- Hot days in 30 yrs
- 17 days/yr
Wind risk 8/10 · Major
- Chance of severe wind over 30 yrs
- 80.0%
Air-quality risk 2/10 · Minimal
- Unhealthy air days now
- 1 days/yr
- Unhealthy air days in 30 yrs
- 1 days/yr
Risk factors via First Street. Map © Google.
Why this score? — see what drove the B grade
The composite is a weighted blend of 9 inputs, each scored 0–100. Each bar is that input's sub-score; the figure is the points it added to the 100-point composite (weight × sub-score).
- Cash flow +30.0/30.0
- 1% rule +10.0/10.0
- DSCR +10.0/10.0
- ARV discount +7.5/15.0
- Livability +3.7/5.0
- Schools +3.5/10.0
- Rent growth +2.9/5.0
- Condition / age +2.5/5.0
- Appreciation +0.0/10.0
$155,000
🖨 Deal sheet 📄 Offer letter ✓ Due diligence
Listing remarks
Handyman special in a promising location - Maximize you ROI!! Welcome to 2821 Old Fairground Rd in Angier, North Carolina — a charming property that offers the perfect blend of quiet country living and convenient access to nearby amenities. Set in a peaceful setting, this home provides a welcoming atmosphere with comfortable living spaces, abundant natural light, and a layout well suited for everyday living and entertaining. The property offers room to enjoy the outdoors, whether relaxing, gardening, or hosting gatherings, while still feeling connected to the community. Located just minutes from downtown Angier, residents can enjoy local shops, dining, and community events, with easy
Key facts
- Quiet country living
- Proximity to parks
- Promising location
Tags
Property features AI
Finance
- Other: Zoning: RAG; Located on the Cape Fear River (water body name listed)
- HOA & community: No HOA
Exterior
- Parking: Driveway; 1 assigned parking space
- Utilities: Public water; Septic system installed; Electricity connected
- Home design: Single-family residence; One story; Site-built construction
- Construction: Vinyl exterior; Composition roof; Crawl space foundation
- Exterior features: Covered, wrap-around porch; Corner lot; Asphalt/paved roads; publicly maintained
Interior
- Kitchen: Microwave; Oven; Refrigerator
- Bedrooms: 3 bedrooms (all on the main level)
- Flooring: Wood flooring
- Bathrooms: 1 full bathroom (on the main level)
- Heating & cooling: Central heating (heat pump); Central air conditioning (electric)
- Interior features: Open floorplan; Storm windows; Has fireplace with electric and wood-burning options
- Laundry & utility: Laundry room; Washer and dryer included
Neighborhood map
What this means for you Summary
Snapshot
- This is a 3-bed/1.0-bath single-family listed at $155k.
Deal economics
- At list price, monthly cash flow is $930 ($11k/yr) — positive.
- The deal already cash-flows at list — no discount required.
- Meets the 1% rule at list price ($2k rent vs $155k).
- Recommended offer: $150k (3.0% below list) — sets the bar for market timing.
- Cap rate 13.5% vs local median 3.9% in Angier — top-decile yield for the area; either an underpriced asset or a hidden risk that comps aren't pricing in. Stress-test before assuming the spread holds.
Location & tenants
- Location reads 73/100 on livability (#69 in NC) — a middle-class / working-renter tenant base. Strengths: cost of living A+, housing A+, health & safety A+; Watch: employment C-, amenities D, commute F.
- Johnston County Public Schools (rural): math 39% / reading 42% proficiency, ranked #105 of 178 in NC (top 59%) — families likely to look elsewhere, expect single-tenant / working-renter base with shorter leases.
- Zoned schools: Mcgee'S Crossroads Elem (math 38% / reading 41%, grade F, #694 of 1,410 statewide, top 53%, 890 students, 56% FRL); West Johnston High (math 44% / reading 47%, grade D-, #347 of 535 statewide, top 65%, 1,469 students, 38% FRL).
- Market conditions: Rents rising (+1.5%/yr); 657 active listings in the ZIP; 2 comparable units currently listed for rent nearby; 2,783 units permitted in Johnston County in 2024 (6 in 5+ unit buildings).
- This rent runs 38% of the median local income ($73k/yr) — at the standard rent-burdened threshold; future hikes will face affordability resistance.
Forward outlook
- Local home prices are declining (-3.0%/yr); year-one equity from $1k of loan paydown is wiped out by about $5k of value loss. Plan a longer hold.
- Johnston County population projected at +37% by 2050 — long-run rental-demand tailwind backs the buy-and-hold thesis.
- At projected returns (-3.0% appreciation + 1.5% rent growth), your $43k cash investment doubles in ~6 years — after that, you're playing with house money.
Negotiation context
- It's been on market 55 days — a 3% lower offer ($150k) is reasonable based on typical stale-listing flexibility.
- 3 sale attempts; this cycle's ask has dropped $14k (8%) from the opening price — seller is motivated, your offer sets the floor, not the list.
Risks & watch-outs
- Watch-outs: built in 1900 — expect roof / HVAC / electrical / plumbing capex.
- Climate carrying-cost: severe wind risk, 80% chance of damaging wind over 30y; extreme-heat days projected 7→17/yr by 2055 (HVAC capex compounding) — expect insurance premiums to compound above CPI over the hold.
Questions for the listing agent
- It's been on market 55 days. Have you received any prior offers? Is the seller open to a 3% concession, seller financing, or rate buy-down credit?
- Built in 1900 — when were the roof, HVAC, electrical panel, plumbing, and water heater last replaced?
- Is there a deadline driving the sale (1031 exchange, divorce, estate, relocation)? That informs how much negotiation room exists.
- Schools are F-rated, which usually means shorter tenancies and higher turnover. Who's the typical renter profile here, and what's been the actual vacancy rate?
- What's the average days-on-market for RENTAL listings here right now (not sales)? A rising rental-DOM trend means longer vacancies and softer asking-rent achievability than the comps imply.
- What's the recent tenant-quality profile in this submarket — average credit score on applications, eviction rate, late-payment / NSF rate, and stable-employment percentage? A property-management company in the area should have these aggregated.
- How much new for-sale + rental construction is in the pipeline within 1–3 miles? Heavy new supply typically softens prices + rents 12–24 months out; constrained supply supports both.
Investment metrics
- 1% rule
- 1.51% ✓
- Cap rate
- 13.49%
- Cash-on-cash
- 25.71%
- DSCR
- 2.14
- GRM
- 5.5
CMA / ARV
- ARV (on-the-fly)
- $341,250
- Comps found
- 3
Show comp detail 3 sales within ~0.75 mi
| Address | Dist | Beds/Ba | Sqft | Sold | Price | $/sf | Match |
|---|---|---|---|---|---|---|---|
| 25 Mannford Ln | 0.71mi | 3/2.0 | 1,684 (+4%) | 12mo | $354,000 | $210 | 47 |
| 200 Teresa Ct | 0.33mi | 3/2.5 | 1,809 (+11%) | 21mo | $375,000 | $207 | 43 |
| 12 Macara Ct | 0.68mi | 3/2.0 | 1,501 (-8%) | 18mo | $335,000 | $223 | 36 |
Match score weights: distance 35% · size 25% · config 20% · recency 20%. Top-matched comps best support the ARV.
Projected returns pro-forma
-3.0% appreciation · 1.47% rent growth · sell at horizon
- IRR
- 17.7%
- Equity multiple
- 1.70×
- Total profit
- $30,509
- Equity at exit
- $23,111
- IRR
- 25.1%
- Equity multiple
- 3.04×
- Total profit
- $88,499
- Equity at exit
- $13,402
Cash invested: $43,400 (down + closing). Projections, not guarantees.
Landlord ↔ Tenant lean methodology
- Overall (STATE)
- 85 Strongly Landlord-Friendly
- State North Carolina
- 85 Strongly Landlord-Friendly · R+3
- County
- — inherits STATE
- City
- — inherits STATE
ZIP-level market 27501
- Home prices YoY
- -11.4%
- Rents YoY
- 1.5%
- Active inventory
- 657
- Price-to-rent
- 5.5×
Monthly cashflow live
- Estimated rent
- $2,334 medium interval (Pro) →
- Mortgage (P&I)
- −$813
- Tax from tax record
- −$36 /mo · $435/yr
- Insurance
- −$65
- HOA
- −$0
- Vacancy / Maint / Mgmt
- −$490
- Net cashflow
- $930
Break-even live
UW: 25.0% down · 7.5% · 30yr · 1.5% tax · 5.0% vac · 8.0% maint · 8.0% mgmt
Financing live
Cash to close
- Down payment
- $38,750
- Closing costs
- $4,650
- Reserves months
- —
- Total cash needed
- —
Loan-product check · same deal, 3 products live
Conventional
25% down · 7.5% · 30yr
- Down + closing
- —
- Monthly P&I
- —
- Monthly cashflow
- —
- DSCR
- —
- Eligible?
- —
Personal DTI + credit; lowest rate.
DSCR
20% down · 8.5% · 30yr
- Down + closing
- —
- Monthly P&I
- —
- Monthly cashflow
- —
- DSCR
- —
- Eligible?
- —
No personal income docs; deal must DSCR.
Hard money
10% down · 12.0% · 12mo
- Down + closing
- —
- Monthly P&I
- —
- Monthly cashflow
- —
- DSCR
- —
- Eligible?
- —
Short-term bridge; refi at stabilization.
Rent comps 2 comps
| Address | Beds | Baths | Sqft | Rent | $/sqft | DOM | Units | Dist |
|---|---|---|---|---|---|---|---|---|
| 113 Prosperity Ct Angier, NC | 3.0 | 2.5 | 2122 | $2,230 | $1.05 | 23d | 1 | 0.87mi |
| 147 Langston Ridge Dr Angier, NC | 3.0 | 2.5 | 1801 | $2,120 | $1.18 | 23d | 1 | 1.19mi |
Listing history 24 events
-
2026-06-18price $155,000 Active 55 DOM
-
2026-06-18days on market $159,000 Active 55 DOM
-
2026-06-17days on market $159,000 Active 54 DOM
-
2026-06-16days on market $159,000 Active 53 DOM
-
2026-06-15days on market $159,000 Active 52 DOM
-
2026-06-13days on market $159,000 Active 50 DOM
-
2026-06-13days on market $159,000 Active 49 DOM
-
2026-06-09pricedays on market $159,000 Active 46 DOM
-
2026-06-08days on market $169,000 Active 45 DOM
-
2026-06-07days on market $169,000 Active 44 DOM
-
2026-06-05days on market $169,000 Active 41 DOM
-
2026-06-03days on market $169,000 Active 40 DOM
-
2026-06-02days on market $169,000 Active 39 DOM
-
2026-06-01days on market $169,000 Active 38 DOM
-
2026-05-31days on market $169,000 Active 37 DOM
-
2026-05-20status Active
-
2026-05-06status Pending
-
2026-04-10$169,000 Active
-
2026-02-09historical
-
2026-01-30price $169,000
-
2026-01-22price $175,000
-
2026-01-12price $179,000
-
2025-12-30price $189,000
-
2025-12-17$199,000 Active
ⓘ Source: listings_history table (triggers on properties + properties_extension) + one-shot
backfill from property_details.listing_events for pre-trigger history.
Tax reassessment forecast NC · Resets to sale price
- Current annual tax
- $435 · $36/mo
- Projected year-2 tax
- $1,271 · $106/mo
- Expected delta
- +$836/yr (+$70/mo · 191.9%)
ⓘ Screening estimate from a state-policy table — verify with the county assessor before closing.
Climate risk First Street
- Flood 1/10 Low FEMA zone X (unshaded) · 0% chance over 30 yrs
- Wildfire 4/10 Moderate
- Heat 7/10 Severe 7 d/yr ≥106°F today · 17 d/yr by 30 yrs out
- Wind 8/10 Severe 80% chance of damaging wind over 30 yrs
- Air quality 2/10 Low 1 unhealthy d/yr today · 1 by 30 yrs out
Nearby sold comps map
Loading sold comps map…
Walkable amenities ~0.75 mi
Loading nearby amenities…
Taxation est. · year 1
- Rental income
- $28,004
- − Mortgage interest
- −$8,682
- − Property taxes
- −$435
- − Insurance
- −$775
- − Repairs & maintenance
- −$2,240
- − Management
- −$2,240
- − Depreciation
- −$4,509
- Taxable income
- $9,122
- Est. tax owed @ 24.0%
- −$2,189
- After-tax cash flow
- $8,970/yr
For passive investors: Depreciation is non-cash, so a rental often shows a tax loss while cash-flowing — sheltering income. Rental losses are passive: they offset passive income freely, and up to $25,000/yr can offset ordinary (W-2) income if you actively participate and your MAGI is under $100k (phasing out to $0 by $150k); unused losses carry forward. On sale, claimed depreciation is recaptured at up to 25%, and gains may owe capital-gains tax (a 1031 exchange can defer both). Figures are a year-1 estimate at your 24.0% rate — not tax advice; consult a CPA.
Schools (NCES district)
- District
- Johnston County Public Schools
- NCES district ID
- 3702370
- Math proficiency
- 39% ▲ 4.00%
- Reading proficiency
- 42% ▲ 2.00%
- Median HH income
- $50,912
- Composite
- 34.99/100
- National rank
- #5052
- State rank
- #105 of 178 in NC
Livability — Angier
- Score
- 73/100
- State rank
- #69
- US rank
- #5182
Category grades
Schools grade is shown separately in the Schools card above.
Census & demographics
- County
- Harnett County · 125,715 people
- City population
- 24,806
- Metro
- Fayetteville, NC
- Population (ZIP)
- 24,806
- Household income
- $73,336
- Rent vs Own
- Severe rent burden
- 339.0
Population outlook (Johnston County) Hauer SSP2
- Today (2025)
- 222,440 people
- By 2030
- 240,227 · +8.0%
- By 2040
- 274,616 · +23.5%
- By 2050
- 304,915 · +37.1%
- By 2075
- 369,507 · +66.1%
- By 2100
- 406,280 · +82.6%
Race, ethnicity, and origin ACS 2023
- Neighborhood character
- Majority White (65%)
- Race & ethnicity
- White 65% Hispanic / Latino 20% Black 10% Two or more races 7% Asian 1%
- Hispanic origin (detail)
- Mexican 13%
- Common ancestry
- Slovak 2% Romanian 2% Lithuanian 1%
- Foreign-born
- 11% · Canada, China
- Languages at home
- 81% English-only · Spanish 16% Other Indo-European 1%
Political lean MEDSL · Johnston
- 2024 margin
- Strong R (+21.5) · D 38.7% · R 60.2% · Other 1.1%
- 2008→2024 swing
- +2.2pp toward D · 2008: -23.7pp · 2024: -21.5pp
- All cycles
- 2024: R+21.5 2020: R+24.3 2016: R+30.7 2012: R+27.8 2008: R+23.7
Not yet ingested
- Civics
- —
Market trends
- HPI YoY
- ▼ -31.84%
- Current HPI
- 248.5302
- Rent YoY
- ▲ 1.47%
- Metro
- Fayetteville, NC
- State GDP YoY
- ▲ 3.28%
- F500 in state
- 26
Industry mix (Fortune 500 HQ in NC)
| Industry | F500 HQs | Revenue |
|---|---|---|
| Financial Services | 2 | $213B |
|
||
| Retail | 2 | $95B |
|
||
| Industrial Conglomerate | 1 | $38B |
|
||
| Metals / Steel | 1 | $35B |
|
||
| Utilities | 1 | $30B |
|
||
| Industrial Machinery | 1 | $19B |
|
||
Price history
-15.1% since first listed9 events — show timeline
- 2026-05-20 Relisted — CANOPYMLS as Distributed by MLS Grid
- 2026-05-06 Pending — CANOPYMLS as Distributed by MLS Grid
- 2026-04-10 Listed $169,000 CANOPYMLS as Distributed by MLS Grid
- 2026-02-09 Listing Removed — TMLS
- 2026-01-30 Price Changed $169,000 TMLS
- 2026-01-22 Price Changed $175,000 TMLS
- 2026-01-12 Price Changed $179,000 TMLS
- 2025-12-30 Price Changed $189,000 TMLS
- 2025-12-17 Listed $199,000 TMLS
Property tax history
-1.9%/yrLatest (2025): $435 · +23.7% YoY. Source: county tax records.
Cash-flow waterfall
monthlySold comps — $/sqft
last 12 mo · ≤1 miLoading sold comps…