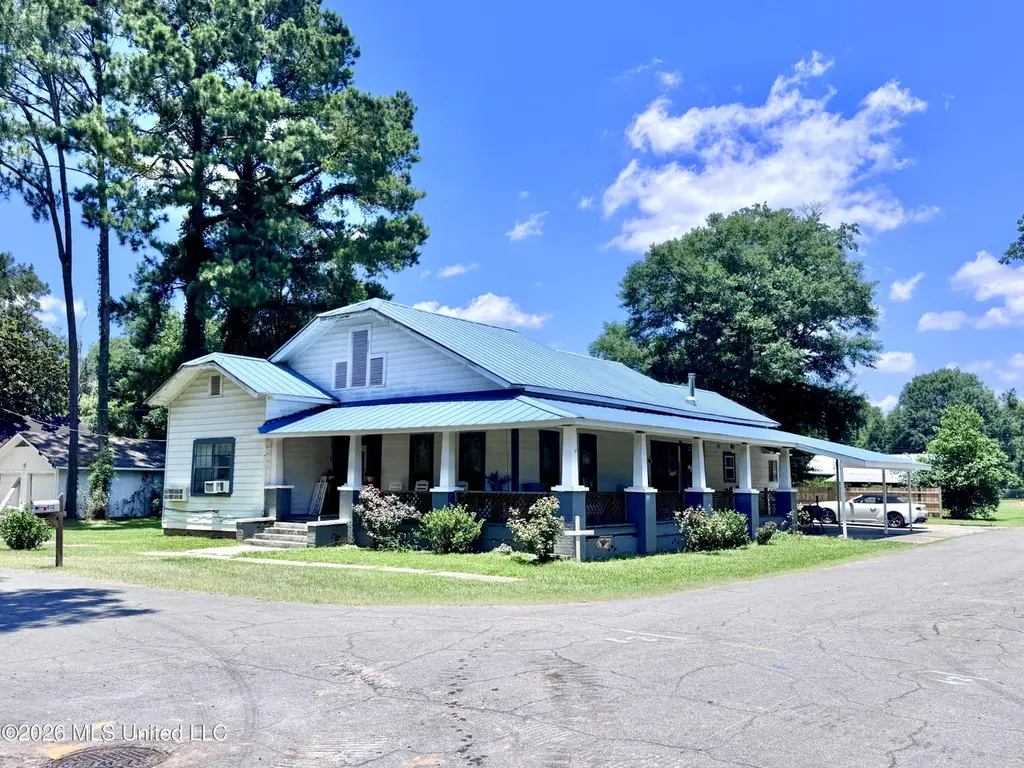
812 Watts St · Monticello, MS
Flood risk 1/10 · Minimal
- FEMA flood zone
- X (unshaded)
- Chance of flooding over 30 yrs
- 0.0%
- Est. flood insurance / yr
- $507 – $1,088
Fire risk 4/10 · Minor
- Est. fire insurance / yr
- $1,241 – $2,305
Heat risk 8/10 · Major
- Hot days now (above 109°F)
- 7 days/yr
- Hot days in 30 yrs
- 21 days/yr
Wind risk 8/10 · Major
- Chance of severe wind over 30 yrs
- 98.0%
Air-quality risk 1/10 · Minimal
- Unhealthy air days now
- 0 days/yr
- Unhealthy air days in 30 yrs
- 0 days/yr
Risk factors via First Street. Map © Google.
Why this score? — see what drove the D grade
The composite is a weighted blend of 9 inputs, each scored 0–100. Each bar is that input's sub-score; the figure is the points it added to the 100-point composite (weight × sub-score).
- Cash flow +11.7/30.0
- ARV discount +7.5/15.0
- Appreciation +6.3/10.0
- Livability +3.6/5.0
- 1% rule +3.4/10.0
- DSCR +3.4/10.0
- Rent growth +2.5/5.0
- Condition / age +2.5/5.0
- Schools +1.9/10.0
$140,000
🖨 Deal sheet (PDF) 📄 Offer letter ✓ Due diligence
Listing remarks MLS
This 3 bedroom, 2 bath house sits on a large corner lot in the historic downtown area within close proximity to eating and shopping. Originally constructed in 1940, this home certainly requires some TLC but has had several of the costly upgrades already: Metal Roof, Porch Decking & Piers, Electric Heating & Cooling Wall Inserts, and new double paned vinyl windows throughout. The house hosts two separate living spaces, a generous kitchen and a mud room. Please don't be alarmed by the boarded-up windows as this was done solely to protect the integrity of the property.
Key facts
- Functional kitchen
- Tall lifted ceilings
- Attached carport
Tags
Property features AI
Finance
- Other: Lot about 0.24 acre
Exterior
- Parking: Attached carport (2 spaces); Concrete driveway
- Utilities: Public water; Public sewer; Electricity connected; Natural gas connected; Sewer connected; Water connected
- Home design: Single Family Residence (house); One level
- Construction: Wood siding construction; Metal roof; Raised foundation; Built (year source: assessor)
- Exterior features: Metal roof; Raised foundation; Accessible approach with ramp; Wood siding
Interior
- Kitchen: Dishwasher; Microwave
- Bathrooms: 2 full bathrooms
- Heating & cooling: Electric heating; Ceiling fan(s); Wall/window unit(s) for cooling
- Interior features: Dishwasher; Microwave
Neighborhood map
What this means for you Summary
Snapshot
- This is a 3-bed/1.0-bath single-family listed at $140k.
Deal economics
- At list price, monthly cash flow is $-41 ($-487/yr) — negative.
- To cash-flow at today's rent, offer at most $133k (5.1% below list).
- To meet the 1% rule (rent ≥ 1% of price), the offer needs to be $117k (16.4% below list).
- Recommended offer: $117k (16.4% below list) — sets the bar for 1% rule.
Location & tenants
- Location reads 72/100 on livability (#24 in MS) — a middle-class / working-renter tenant base. Strengths: crime A+, cost of living A+, health & safety A+; Watch: amenities F, commute F, employment F.
- Lawrence County School District (rural): math 20% / reading 26% proficiency, ranked #85 of 130 in MS (top 65%) — low school quality limits family demand, transient renter base, plan for 1-2y turnover; 67% free/reduced lunch — lower-income household profile, screen leases tightly.
- Zoned schools: Monticello Elementary School (math 27% / reading 27%, grade F, #203 of 375 statewide, top 56%, 335 students, 99% FRL); Rod Paige Middle School (math 17% / reading 26%, grade F, #109 of 179 statewide, top 62%, 259 students, 99% FRL); Lawrence County High School (math 17% / reading 22%, grade F, #130 of 197 statewide, top 68%, 535 students, 99% FRL) — zoned schools average 99% FRL vs 67% district-wide (32 pts higher); higher-poverty schools than district average — tighter screening recommended.
- Market conditions: 22 active listings in the ZIP.
Forward outlook
- In year one you build about $5k of equity ($968 loan paydown + $4k appreciation (2.6% local appreciation)).
- Lawrence County population projected at -16% by 2050 — secular population decline; favor cash flow + early exit over multi-decade hold.
- At projected returns (2.6% appreciation + 3.0% rent growth), your $39k cash investment doubles in ~8 years — after that, you're playing with house money.
- By year 8, paydown + projected appreciation supports a ~$34k cash-out refi (75% LTV) — recoverable capital for the next deal without selling this one.
Negotiation context
- Only 10 days on market — expect competitive offers; lowballing is unlikely to land.
- 4 sale attempts since 8y ago with the ask held roughly flat each time — persistent listings suggest the price (not the market) is what's stuck; bring a comps-based counter.
- Current owner paid $59k; list at $140k implies a 137% gain — meaningful room to come down on a strong offer.
Risks & watch-outs
- Watch-outs: built in 1940 — expect roof / HVAC / electrical / plumbing capex.
- Climate carrying-cost: severe wind risk, 98% chance of damaging wind over 30y; extreme-heat days projected 7→21/yr by 2055 (HVAC capex compounding) — expect insurance premiums to compound above CPI over the hold.
Questions for the listing agent
- What do current leases actually rent for vs. the listed asking? Can we see a recent rent roll and the last 12 months of T-12 income?
- Built in 1940 — when were the roof, HVAC, electrical panel, plumbing, and water heater last replaced?
- Is there a deadline driving the sale (1031 exchange, divorce, estate, relocation)? That informs how much negotiation room exists.
- Schools are D-rated, which usually means shorter tenancies and higher turnover. Who's the typical renter profile here, and what's been the actual vacancy rate?
- The area grade is low — what's the realistic commute time and amenity access for the typical tenant pool here? Any planned neighborhood developments (good or bad) we should know about?
- What's the average days-on-market for RENTAL listings here right now (not sales)? A rising rental-DOM trend means longer vacancies and softer asking-rent achievability than the comps imply.
- What's the recent tenant-quality profile in this submarket — average credit score on applications, eviction rate, late-payment / NSF rate, and stable-employment percentage? A property-management company in the area should have these aggregated.
- How much new for-sale + rental construction is in the pipeline within 1–3 miles? Heavy new supply typically softens prices + rents 12–24 months out; constrained supply supports both.
Investment metrics
- 1% rule
- 0.84% ✗
- Cap rate
- 5.95%
- Cash-on-cash
- -1.24%
- DSCR
- 0.94
- GRM
- 10.0
CMA / ARV
No comps found within radius.
Projected returns pro-forma
2.57% appreciation · 3.0% rent growth · sell at horizon
- IRR
- 5.1%
- Equity multiple
- 1.28×
- Total profit
- $11,107
- Equity at exit
- $59,556
- IRR
- 8.3%
- Equity multiple
- 2.21×
- Total profit
- $47,241
- Equity at exit
- $89,226
Cash invested: $39,200 (down + closing). Projections, not guarantees.
Landlord ↔ Tenant lean methodology
- Overall (STATE)
- 90 Strongly Landlord-Friendly
- State Mississippi
- 90 Strongly Landlord-Friendly · R+11
- County
- — inherits STATE
- City
- — inherits STATE
ZIP-level market 39654
- Home prices YoY
- 2.2%
- Active inventory
- 22
- Price-to-rent
- 10.0×
Monthly cashflow live
- Estimated rent
- $1,170 medium interval (Pro) →
- Mortgage (P&I)
- −$734
- Tax from tax record
- −$172 /mo · $2,067/yr
- Insurance
- −$58
- HOA
- −$0
- Vacancy / Maint / Mgmt
- −$246
- Net cashflow
- $-41
Break-even live
Sensitivity live
| Price | -10% $39 | -5% $-1 | +0% $-41 | +5% $-80 | +10% $-120 |
|---|---|---|---|---|---|
| Rent | -10% $-133 | -5% $-87 | +0% $-41 | +5% $6 | +10% $52 |
| Rate | -1.0pp $30 | -0.5pp $-5 | base $-41 | +0.5pp $-77 | +1.0pp $-114 |
UW: 25.0% down · 7.5% · 30yr · 1.5% tax · 5.0% vac · 8.0% maint · 8.0% mgmt
Financing live
Cash to close
- Down payment
- $35,000
- Closing costs
- $4,200
- Reserves months
- —
- Total cash needed
- —
Loan-product check · same deal, 3 products live
Conventional
25% down · 7.5% · 30yr
- Down + closing
- —
- Monthly P&I
- —
- Monthly cashflow
- —
- DSCR
- —
- Eligible?
- —
Personal DTI + credit; lowest rate.
DSCR
20% down · 8.5% · 30yr
- Down + closing
- —
- Monthly P&I
- —
- Monthly cashflow
- —
- DSCR
- —
- Eligible?
- —
No personal income docs; deal must DSCR.
Hard money
10% down · 12.0% · 12mo
- Down + closing
- —
- Monthly P&I
- —
- Monthly cashflow
- —
- DSCR
- —
- Eligible?
- —
Short-term bridge; refi at stabilization.
Listing history 9 events
-
2026-06-22days on market $140,000 Active 10 DOM
-
2026-06-21days on market $140,000 Active 9 DOM
-
2026-06-21days on market $140,000 Active 8 DOM
-
2026-06-18days on market $140,000 Active 6 DOM
-
2026-06-17days on market $140,000 Active 5 DOM
-
2026-06-16days on market $140,000 Active 4 DOM
-
2026-06-15days on market $140,000 Active 3 DOM
-
2026-06-12remarks 699-char remark
-
2026-06-12$140,000 Active 1 DOM
ⓘ Source: listings_history table (triggers on properties + properties_extension) + one-shot
backfill from property_details.listing_events for pre-trigger history.
Tax reassessment forecast MS · Resets to sale price
- Current annual tax
- $2,067 · $172/mo
- Projected year-2 tax
- $2,067 · $172/mo
- Expected delta
- $0/yr ($0/mo · 0.0%)
ⓘ Screening estimate from a state-policy table — verify with the county assessor before closing.
Climate risk First Street
- Flood 1/10 Low FEMA zone X (unshaded) · 0% chance over 30 yrs
- Wildfire 4/10 Moderate
- Heat 8/10 Severe 7 d/yr ≥109°F today · 21 d/yr by 30 yrs out
- Wind 8/10 Severe 98% chance of damaging wind over 30 yrs
- Air quality 1/10 Low 0 unhealthy d/yr today · 0 by 30 yrs out
Nearby sold comps map
Loading sold comps map…
Walkable amenities ~0.75 mi
Loading nearby amenities…
Taxation est. · year 1
- Rental income
- $14,038
- − Mortgage interest
- −$7,842
- − Property taxes
- −$2,067
- − Insurance
- −$700
- − Repairs & maintenance
- −$1,123
- − Management
- −$1,123
- − Depreciation
- −$4,073
- Taxable loss
- −$2,890
- Est. tax savings @ 24.0%
- +$694
- After-tax cash flow
- $207/yr
For passive investors: Depreciation is non-cash, so a rental often shows a tax loss while cash-flowing — sheltering income. Rental losses are passive: they offset passive income freely, and up to $25,000/yr can offset ordinary (W-2) income if you actively participate and your MAGI is under $100k (phasing out to $0 by $150k); unused losses carry forward. On sale, claimed depreciation is recaptured at up to 25%, and gains may owe capital-gains tax (a 1031 exchange can defer both). Figures are a year-1 estimate at your 24.0% rate — not tax advice; consult a CPA.
Schools (NCES district)
- District
- Lawrence County School District
- NCES district ID
- 2802490
- Math proficiency
- 20% ▼ -16.00%
- Reading proficiency
- 26% ▼ -7.00%
- Median HH income
- $37,725
- Composite
- 19.21/100
- National rank
- #8812
- State rank
- #85 of 130 in MS
Livability — Monticello
- Score
- 72/100
- State rank
- #24
- US rank
- #6306
Category grades
Schools grade is shown separately in the Schools card above.
Census & demographics
- Census place
- Monticello, MS
- Population (ZIP)
- 4,589
Population outlook (Lawrence County) Hauer SSP2
- Today (2025)
- 12,069 people
- By 2030
- 11,724 · -2.9%
- By 2040
- 10,955 · -9.2%
- By 2050
- 10,085 · -16.4%
- By 2075
- 7,870 · -34.8%
- By 2100
- 5,614 · -53.5%
Race, ethnicity, and origin ACS 2023
- Neighborhood character
- Majority White (62%)
- Race & ethnicity
- White 62% Black 32% Hispanic / Latino 3% Two or more races 2%
- Common ancestry
- Italian 4% Lithuanian 3% Serbian 2%
- Foreign-born
- 0%
- Languages at home
- 99% English-only · Spanish 1%
Political lean MEDSL · Lawrence
- 2024 margin
- Solid R (+36.6) · D 31.4% · R 68.0%
- 2008→2024 swing
- -11.2pp toward R · 2008: -25.4pp · 2024: -36.6pp
- All cycles
- 2024: R+36.6 2020: R+30.6 2016: R+29.9 2012: R+26.7 2008: R+25.4
Not yet ingested
- Civics
- —
Market trends
- HPI YoY
- ▲ 2.57%
- Current HPI
- 117.8262
- Rent YoY
- —
- Metro
- —
- State GDP YoY
- —
- F500 in state
- 0
Price history
+75.2% since first listed10 events — show timeline
- 2026-06-12 Listed $140,000 MLSU
- 2024-10-07 Price Changed $135,000 HAAR
- 2024-09-15 Listed $145,900 HAAR
- 2024-04-08 Sold (Public Records) $59,000 Public Records
- 2022-03-03 Sold (Public Records) $59,000 Public Records
- 2022-03-03 Sold (MLS) — MLSU
- 2022-01-25 Listed $59,900 MLSU
- 2021-12-03 Sold (Public Records) $59,000 Public Records
- 2018-12-31 Listing Removed — MLSU
- 2018-03-07 Listed $79,900 MLSU
Property tax history
+38.2%/yrLatest (2025): $2,067 · +92.1% YoY. Source: county tax records.
Cash-flow waterfall
monthlySold comps — $/sqft
last 12 mo · ≤1 miLoading sold comps…