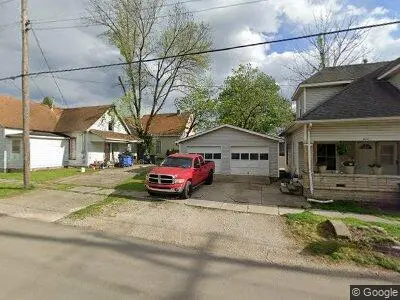
810 6th St · Bedford, IN
Flood risk 1/10 · Minimal
- FEMA flood zone
- X (unshaded)
- Chance of flooding over 30 yrs
- 0.0%
- Est. flood insurance / yr
- $473 – $860
Fire risk 1/10 · Minimal
- Est. fire insurance / yr
- $717 – $1,331
Heat risk 4/10 · Minor
- Hot days now (above 104°F)
- 7 days/yr
- Hot days in 30 yrs
- 19 days/yr
Wind risk 2/10 · Minimal
- Chance of severe wind over 30 yrs
- 1.0%
Air-quality risk 2/10 · Minimal
- Unhealthy air days now
- 0 days/yr
- Unhealthy air days in 30 yrs
- 1 days/yr
Risk factors via First Street. Map © Google.
Why this score? — see what drove the D+ grade
The composite is a weighted blend of 9 inputs, each scored 0–100. Each bar is that input's sub-score; the figure is the points it added to the 100-point composite (weight × sub-score).
- ARV discount +15.0/15.0
- Cash flow +13.2/30.0
- DSCR +4.0/10.0
- Livability +4.0/5.0
- 1% rule +3.4/10.0
- Schools +3.2/10.0
- Rent growth +2.5/5.0
- Condition / age +2.5/5.0
- Appreciation +0.0/10.0
$169,900
🖨 Deal sheet 📄 Offer letter ✓ Due diligence
Listing remarks
3 bedrooms upstairs 2 down stairs Laundry on main floor All new carpet upstairs December 2025 All new windows upstairs April 2026 lifetime warranty New vanity and mirror in bathroom Feb. 2025 New shower/tub summer 2022 The HVAC has been serviced every 6 months with Airmasters. Very small yard, concrete patio around back low maintenance! For pictures txt 8127917162
Key facts
- New carpet upstairs
- New shower tub
- New windows upstairs
Tags
Neighborhood map
What this means for you Summary
Snapshot
- This is a 3-bed/1.0-bath single-family listed at $170k.
Deal economics
- At list price, monthly cash flow is $-4 ($-52/yr) — negative.
- To cash-flow at today's rent, offer at most $169k (0.5% below list).
- To meet the 1% rule (rent ≥ 1% of price), the offer needs to be $142k (16.3% below list).
- Recommended offer: $142k (16.3% below list) — sets the bar for 1% rule.
- Cap rate 6.3% vs local median 4.2% in Bedford — top-decile yield for the area; either an underpriced asset or a hidden risk that comps aren't pricing in. Stress-test before assuming the spread holds.
Location & tenants
- Location reads 80/100 on livability (#23 in IN, #1,958 nationally) — a professional / high-income tenant draw. Strengths: crime A+, cost of living A+, housing A+; Watch: schools C-, employment D, commute F.
- North Lawrence Community Schools (rural): math 35% / reading 40% proficiency, ranked #170 of 301 in IN (top 56%) — families likely to look elsewhere, expect single-tenant / working-renter base with shorter leases.
- Market conditions: 158 active listings in the ZIP; 1 comparable units currently listed for rent nearby; 8 units permitted in Lawrence County in 2024 (0 in 5+ unit buildings).
Forward outlook
- Local home prices are declining (-3.0%/yr); year-one equity from $1k of loan paydown is wiped out by about $5k of value loss. Plan a longer hold.
- Lawrence County population projected at -14% by 2050 — secular population decline; favor cash flow + early exit over multi-decade hold.
Negotiation context
- It's been on market 15 days — a 2% lower offer ($167k) is reasonable based on typical stale-listing flexibility.
- Current owner paid $133k; 28% above their basis — modest negotiation headroom, anchor on the comps not their cost.
Risks & watch-outs
- Watch-outs: built in 1941 — expect roof / HVAC / electrical / plumbing capex.
Questions for the listing agent
- What do current leases actually rent for vs. the listed asking? Can we see a recent rent roll and the last 12 months of T-12 income?
- Built in 1941 — when were the roof, HVAC, electrical panel, plumbing, and water heater last replaced?
- Is there a deadline driving the sale (1031 exchange, divorce, estate, relocation)? That informs how much negotiation room exists.
- The area grade is low — what's the realistic commute time and amenity access for the typical tenant pool here? Any planned neighborhood developments (good or bad) we should know about?
- What's the average days-on-market for RENTAL listings here right now (not sales)? A rising rental-DOM trend means longer vacancies and softer asking-rent achievability than the comps imply.
- What's the recent tenant-quality profile in this submarket — average credit score on applications, eviction rate, late-payment / NSF rate, and stable-employment percentage? A property-management company in the area should have these aggregated.
- How much new for-sale + rental construction is in the pipeline within 1–3 miles? Heavy new supply typically softens prices + rents 12–24 months out; constrained supply supports both.
Investment metrics
- 1% rule
- 0.84% ✗
- Cap rate
- 6.26%
- Cash-on-cash
- -0.11%
- DSCR
- 1.00
- GRM
- 10.0
CMA / ARV
- ARV (median comp)
- $209,044
- List price
- $169,900
- Delta
- -18.73%
- Verdict
- UNDERPRICED
- Comps
- 20 within 1.0 mi
Show comp detail 8 sales within ~0.75 mi
| Address | Dist | Beds/Ba | Sqft | Sold | Price | $/sf | Match |
|---|---|---|---|---|---|---|---|
| 627 I St | 0.08mi | 4/2.0 (+1) | 2,048 (-2%) | 18mo | $201,000 | $98 | 68 |
| 403 M Street St | 0.42mi | 3/2.0 | 1,920 (-8%) | 1mo | $70,000 | $36 | 61 |
| 101 M St | 0.54mi | 4/2.5 (+1) | 2,124 (+1%) | 5mo | $208,500 | $98 | 58 |
| 408 L St | 0.33mi | 4/3.5 (+1) | 2,244 (+7%) | 3mo | $252,000 | $112 | 56 |
| 1617 9th St | 0.63mi | 4/2.0 (+1) | 2,304 (+10%) | 2mo | $195,000 | $85 | 44 |
| 103 W Heltonville Rd | 0.70mi | 4/2.0 (+1) | 1,812 (-14%) | 7mo | $220,000 | $121 | 30 |
| 1320 L St | 0.69mi | 4/2.0 (+1) | 2,392 (+14%) | 9mo | $100,000 | $42 | 28 |
| 642 Riley Blvd | 0.67mi | 4/3.0 (+1) | 1,920 (-8%) | 22mo | $149,900 | $78 | 23 |
Match score weights: distance 35% · size 25% · config 20% · recency 20%. Top-matched comps best support the ARV.
Projected returns pro-forma
-3.0% appreciation · 3.0% rent growth · sell at horizon
- IRR
- -16.5%
- Equity multiple
- 0.42×
- Total profit
- $-27,816
- Equity at exit
- $25,333
- IRR
- -8.3%
- Equity multiple
- 0.48×
- Total profit
- $-24,608
- Equity at exit
- $14,690
Cash invested: $47,572 (down + closing). Projections, not guarantees.
Landlord ↔ Tenant lean methodology
- Overall (STATE)
- 90 Strongly Landlord-Friendly
- State Indiana
- 90 Strongly Landlord-Friendly · R+11
- County
- — inherits STATE
- City
- — inherits STATE
ZIP-level market 47421
- Home prices YoY
- -25.2%
- Active inventory
- 158
- Price-to-rent
- 10.0×
Monthly cashflow live
- Estimated rent
- $1,422 medium interval (Pro) →
- Mortgage (P&I)
- −$891
- Tax from tax record
- −$166 /mo · $1,988/yr
- Insurance
- −$71
- HOA
- −$0
- Vacancy / Maint / Mgmt
- −$299
- Net cashflow
- $-4
Break-even live
UW: 25.0% down · 7.5% · 30yr · 1.5% tax · 5.0% vac · 8.0% maint · 8.0% mgmt
Financing live
Cash to close
- Down payment
- $42,475
- Closing costs
- $5,097
- Reserves months
- —
- Total cash needed
- —
Loan-product check · same deal, 3 products live
Conventional
25% down · 7.5% · 30yr
- Down + closing
- —
- Monthly P&I
- —
- Monthly cashflow
- —
- DSCR
- —
- Eligible?
- —
Personal DTI + credit; lowest rate.
DSCR
20% down · 8.5% · 30yr
- Down + closing
- —
- Monthly P&I
- —
- Monthly cashflow
- —
- DSCR
- —
- Eligible?
- —
No personal income docs; deal must DSCR.
Hard money
10% down · 12.0% · 12mo
- Down + closing
- —
- Monthly P&I
- —
- Monthly cashflow
- —
- DSCR
- —
- Eligible?
- —
Short-term bridge; refi at stabilization.
Rent comps 1 comps
| Address | Beds | Baths | Sqft | Rent | $/sqft | DOM | Units | Dist |
|---|---|---|---|---|---|---|---|---|
| 2115 G St Bedford, IN | 3.0 | 2.0 | 1500 | $1,750 | $1.17 | 21d | 1 | 1.26mi |
Listing history 2 events
-
2026-05-12$169,900 Active 367-char remark
-
2023-08-15soldstatus $132,700
ⓘ Source: listings_history table (triggers on properties + properties_extension) + one-shot
backfill from property_details.listing_events for pre-trigger history.
Tax reassessment forecast IN · Partial reset (capped growth)
- Current annual tax
- $1,988 · $166/mo
- Projected year-2 tax
- $1,988 · $166/mo
- Expected delta
- $0/yr ($0/mo · 0.0%)
ⓘ Screening estimate from a state-policy table — verify with the county assessor before closing.
Climate risk First Street
- Flood 1/10 Low FEMA zone X (unshaded) · 0% chance over 30 yrs
- Wildfire 1/10 Low
- Heat 4/10 Moderate 7 d/yr ≥104°F today · 19 d/yr by 30 yrs out
- Wind 2/10 Low 100% chance of damaging wind over 30 yrs
- Air quality 2/10 Low 0 unhealthy d/yr today · 1 by 30 yrs out
Nearby sold comps map
Loading sold comps map…
Walkable amenities ~0.75 mi
Loading nearby amenities…
Taxation est. · year 1
- Rental income
- $17,059
- − Mortgage interest
- −$9,517
- − Property taxes
- −$1,988
- − Insurance
- −$850
- − Repairs & maintenance
- −$1,365
- − Management
- −$1,365
- − Depreciation
- −$4,943
- Taxable loss
- −$2,967
- Est. tax savings @ 24.0%
- +$712
- After-tax cash flow
- $660/yr
For passive investors: Depreciation is non-cash, so a rental often shows a tax loss while cash-flowing — sheltering income. Rental losses are passive: they offset passive income freely, and up to $25,000/yr can offset ordinary (W-2) income if you actively participate and your MAGI is under $100k (phasing out to $0 by $150k); unused losses carry forward. On sale, claimed depreciation is recaptured at up to 25%, and gains may owe capital-gains tax (a 1031 exchange can defer both). Figures are a year-1 estimate at your 24.0% rate — not tax advice; consult a CPA.
Schools (NCES district)
- District
- North Lawrence Community Schools
- NCES district ID
- 1807860
- Math proficiency
- 35% ▼ -2.00%
- Reading proficiency
- 40% ▼ -3.00%
- Median HH income
- $44,566
- Composite
- 31.88/100
- National rank
- #5864
- State rank
- #170 of 301 in IN
Livability — Bedford
- Score
- 80/100
- State rank
- #23
- US rank
- #1958
Category grades
Schools grade is shown separately in the Schools card above.
Census & demographics
- Census place
- Bedford, IN
- County
- Lawrence County · 27,599 people
- City population
- 27,599
- Metro
- Bedford, IN
- Population (ZIP)
- 27,599
- Household income
- $68,108
- Rent vs Own
- Severe rent burden
- 507.0
Population outlook (Lawrence County) Hauer SSP2
- Today (2025)
- 44,347 people
- By 2030
- 43,331 · -2.3%
- By 2040
- 40,887 · -7.8%
- By 2050
- 38,297 · -13.6%
- By 2075
- 32,479 · -26.8%
- By 2100
- 26,051 · -41.3%
Race, ethnicity, and origin ACS 2023
- Neighborhood character
- Predominantly White (94%)
- Race & ethnicity
- White 94% Two or more races 4% Hispanic / Latino 2%
- Common ancestry
- Slovak 3% Italian 2% Scotch-Irish 1%
- Foreign-born
- 1% · Canada
- Languages at home
- 99% English-only · Spanish 1%
Political lean MEDSL · Lawrence
- 2024 margin
- Solid R (+51.0) · D 23.6% · R 74.6% · Other 1.7%
- 2008→2024 swing
- -30.5pp toward R · 2008: -20.6pp · 2024: -51.0pp
- All cycles
- 2024: R+51.0 2020: R+50.6 2016: R+51.5 2012: R+32.8 2008: R+20.6
Not yet ingested
- Civics
- —
Market trends
- HPI YoY
- ▼ -81.32%
- Current HPI
- 240.959
- Rent YoY
- —
- Metro
- Bedford, IN
- State GDP YoY
- ▲ 2.90%
- F500 in state
- 18
Industry mix (Fortune 500 HQ in IN)
| Industry | F500 HQs | Revenue |
|---|---|---|
| Industrial Machinery | 2 | $37B |
|
||
| Healthcare | 1 | $177B |
|
||
| Pharmaceuticals | 1 | $45B |
|
||
| Metals / Steel | 1 | $18B |
|
||
| Agriculture | 1 | $17B |
|
||
| Packaging | 1 | $12B |
|
||
Price history
1 event — show timeline
- 2023-08-15 Sold (Public Records) $132,700 Public Records
Property tax history
+13.1%/yrLatest (2025): $1,988 · +143.4% YoY. Source: county tax records.
Cash-flow waterfall
monthlySold comps — $/sqft
last 12 mo · ≤1 miLoading sold comps…