5448 Lariat Ln · Valley Springs, AR
Flood risk 1/10 · Minimal
- FEMA flood zone
- X (unshaded)
- Chance of flooding over 30 yrs
- 0.0%
- Est. flood insurance / yr
- $473 – $860
Fire risk 6/10 · Moderate
- Est. fire insurance / yr
- $1,499 – $2,785
Heat risk 4/10 · Minor
- Hot days now (above 105°F)
- 7 days/yr
- Hot days in 30 yrs
- 20 days/yr
Wind risk 2/10 · Minimal
- Chance of severe wind over 30 yrs
- 2.0%
Air-quality risk 1/10 · Minimal
- Unhealthy air days now
- 0 days/yr
- Unhealthy air days in 30 yrs
- 0 days/yr
Risk factors via First Street. Map © Google.
Why this score? — see what drove the D grade
The composite is a weighted blend of 9 inputs, each scored 0–100. Each bar is that input's sub-score; the figure is the points it added to the 100-point composite (weight × sub-score).
- ARV discount +15.0/15.0
- Cash flow +6.7/30.0
- Schools +4.7/10.0
- Appreciation +3.3/10.0
- Livability +3.1/5.0
- Rent growth +2.5/5.0
- Condition / age +2.5/5.0
- 1% rule +1.7/10.0
- DSCR +0.9/10.0
$129,500
🖨 Deal sheet 📄 Offer letter ✓ Due diligence
Listing remarks MLS
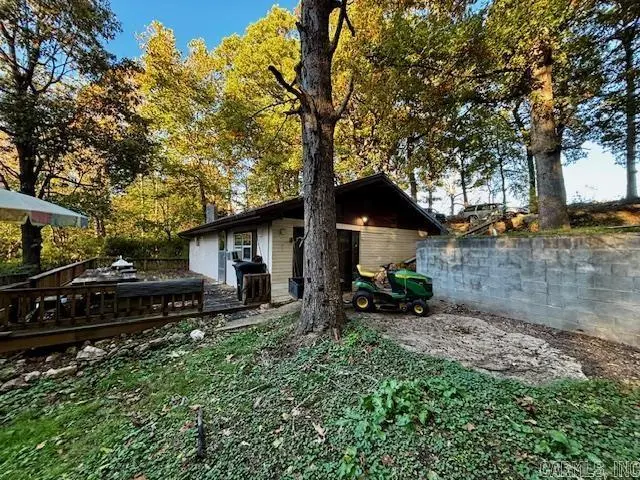
Tucked into the hillside and surrounded by peace and quiet, this super energy-efficient home offers charm, warmth, and scenic wooded views. Inside, the open floor plan features a vaulted living room ceiling with exposed wood beams and a cozy gas stove set on a rock hearth. The kitchen opens to the dining area and includes a breakfast bar, generous counter space, and brand-new appliances (2024). The remodeled bathroom features a walk-in shower. Step outside to enjoy the 16x40 deck overlooking the tranquil acreage. Property includes a 20x20 wired shop and a metal roof that’s only 6 years old. A retreat that’s practical, comfortable, and full of character.
Key facts
- Open floor plan
- Exposed wood beams
- Scenic wooded views
Tags
Neighborhood map
What this means for you Summary
Snapshot
- This is a 2-bed/1.0-bath single-family listed at $130k.
Deal economics
- At list price, monthly cash flow is $-208 ($-3k/yr) — negative.
- To cash-flow at today's rent, offer at most $99k (23.3% below list).
- To meet the 1% rule (rent ≥ 1% of price), the offer needs to be $87k (32.9% below list).
- Recommended offer: $87k (32.9% below list) — sets the bar for 1% rule.
Location & tenants
- Location reads 62/100 on livability (#225 in AR) — a middle-class / working-renter tenant base. Strengths: cost of living A+, employment B; Watch: crime F, amenities F, commute F.
- Valley Springs School District (rural): math 56% / reading 55% proficiency, ranked #7 of 238 in AR (top 3%) — acceptable for families but not a draw, mixed tenant base, ~2y average lease.
- Market conditions: 23 active listings in the ZIP; 92 units permitted in Boone County in 2024 (72 in 5+ unit buildings).
Forward outlook
- Local home prices are declining (-3.0%/yr); year-one equity from $895 of loan paydown is wiped out by about $4k of value loss. Plan a longer hold.
- Boone County population projected to shrink 8% by 2050 — rents likely to lag national; underwrite the cash flow, not the appreciation.
Negotiation context
- It's been on market 226 days — a 12% lower offer ($114k) is reasonable based on typical stale-listing flexibility.
- 9 sale attempts since 8y ago with the ask held roughly flat each time — persistent listings suggest the price (not the market) is what's stuck; bring a comps-based counter.
- Current owner paid $55k; list at $130k implies a 135% gain — meaningful room to come down on a strong offer.
Risks & watch-outs
- Climate carrying-cost: major wildfire risk — expect insurance premiums to compound above CPI over the hold.
Questions for the listing agent
- What do current leases actually rent for vs. the listed asking? Can we see a recent rent roll and the last 12 months of T-12 income?
- It's been on market 226 days. Have you received any prior offers? Is the seller open to a 33% concession, seller financing, or rate buy-down credit?
- Why hasn't it sold? Are there any deal-killer items the seller is aware of (foundation, flood, title, zoning, code violations)?
- Is there a deadline driving the sale (1031 exchange, divorce, estate, relocation)? That informs how much negotiation room exists.
- Crime grade is F in this area — have there been break-ins, vandalism, or insurance claims at this property in the last 3 years? What carrier currently insures it and at what premium?
- The area grade is low — what's the realistic commute time and amenity access for the typical tenant pool here? Any planned neighborhood developments (good or bad) we should know about?
- What's the average days-on-market for RENTAL listings here right now (not sales)? A rising rental-DOM trend means longer vacancies and softer asking-rent achievability than the comps imply.
- What's the recent tenant-quality profile in this submarket — average credit score on applications, eviction rate, late-payment / NSF rate, and stable-employment percentage? A property-management company in the area should have these aggregated.
- How much new for-sale + rental construction is in the pipeline within 1–3 miles? Heavy new supply typically softens prices + rents 12–24 months out; constrained supply supports both.
Investment metrics
- 1% rule
- 0.67% ✗
- Cap rate
- 4.36%
- Cash-on-cash
- -6.90%
- DSCR
- 0.69
- GRM
- 12.4
CMA / ARV
- ARV (median comp)
- $166,351
- List price
- $129,500
- Delta
- -22.15%
- Verdict
- UNDERPRICED
- Comps
- 8 within 2.0 mi
Projected returns pro-forma
-3.0% appreciation · 3.0% rent growth · sell at horizon
- IRR
- -28.3%
- Equity multiple
- 0.06×
- Total profit
- $-34,248
- Equity at exit
- $19,309
- IRR
- -27.3%
- Equity multiple
- -0.29×
- Total profit
- $-46,866
- Equity at exit
- $11,197
Cash invested: $36,260 (down + closing). Projections, not guarantees.
Landlord ↔ Tenant lean methodology
- Overall (STATE)
- 92 Strongly Landlord-Friendly
- State Arkansas
- 92 Strongly Landlord-Friendly · R+14
- County
- — inherits STATE
- City
- — inherits STATE
ZIP-level market 72633
- Home prices YoY
- -1.2%
- Active inventory
- 23
- Price-to-rent
- 12.4×
Monthly cashflow live
- Estimated rent
- $869 medium interval (Pro) →
- Mortgage (P&I)
- −$679
- Tax est. 1.5%
- −$162 /mo · $1,942/yr
- Insurance
- −$54
- HOA
- −$0
- Vacancy / Maint / Mgmt
- −$182
- Net cashflow
- $-208
Break-even live
UW: 25.0% down · 7.5% · 30yr · 1.5% tax · 5.0% vac · 8.0% maint · 8.0% mgmt
Financing live
Cash to close
- Down payment
- $32,375
- Closing costs
- $3,885
- Reserves months
- —
- Total cash needed
- —
Loan-product check · same deal, 3 products live
Conventional
25% down · 7.5% · 30yr
- Down + closing
- —
- Monthly P&I
- —
- Monthly cashflow
- —
- DSCR
- —
- Eligible?
- —
Personal DTI + credit; lowest rate.
DSCR
20% down · 8.5% · 30yr
- Down + closing
- —
- Monthly P&I
- —
- Monthly cashflow
- —
- DSCR
- —
- Eligible?
- —
No personal income docs; deal must DSCR.
Hard money
10% down · 12.0% · 12mo
- Down + closing
- —
- Monthly P&I
- —
- Monthly cashflow
- —
- DSCR
- —
- Eligible?
- —
Short-term bridge; refi at stabilization.
Listing history 43 events
-
2026-06-19days on market $129,500 Active 226 DOM
-
2026-06-18days on market $129,500 Active 225 DOM
-
2026-06-17days on market $129,500 Active 224 DOM
-
2026-06-16days on market $129,500 Active 223 DOM
-
2026-06-15days on market $129,500 Active 222 DOM
-
2026-06-14days on market $129,500 Active 220 DOM
-
2026-06-12days on market $129,500 Active 219 DOM
-
2026-06-09days on market $129,500 Active 216 DOM
-
2026-06-08days on market $129,500 Active 215 DOM
-
2026-06-07days on market $129,500 Active 214 DOM
-
2026-06-07days on market $129,500 Active 213 DOM
-
2026-06-04days on market $129,500 Active 210 DOM
-
2026-06-02days on market $129,500 Active 209 DOM
-
2026-06-01days on market $129,500 Active 208 DOM
-
2026-05-31days on market $129,500 Active 207 DOM
-
2026-05-31days on market $129,500 Active 206 DOM
-
2025-11-04$129,500 New Listing 673-char remark
Show marketing remark (673 chars)
Tucked into the hillside and surrounded by peace and quiet, this super energy-efficient home offers charm, warmth, and scenic wooded views. Inside, the open floor plan features a vaulted living room ceiling with exposed wood beams and a cozy gas stove set on a rock hearth. The kitchen opens to the dining area and includes a breakfast bar, generous counter space, and brand-new appliances (2024). The remodeled bathroom features a walk-in shower. Step outside to enjoy the 16x40 deck overlooking the tranquil acreage. Property includes a 20x20 wired shop and a metal roof that’s only 6 years old. A retreat that’s practical, comfortable, and full of character.
-
2024-09-20historical
-
2024-05-24price $126,900
-
2024-04-04price $128,500
-
2024-01-19$129,900 New Listing
-
2024-01-19$126,900 Active
-
2023-12-23historical
-
2023-11-01price $129,900
-
2023-11-01price $129,900
-
2023-09-30price $130,900
-
2023-09-29price $130,900
-
2023-09-29status Price Change
-
2023-09-12historical Take Backups
-
2023-09-08price $131,900
-
2023-09-07price $131,900
-
2023-06-23$132,500 Active
-
2023-06-23$132,500 New Listing
-
2022-12-07historical
-
2022-08-26price $122,900
-
2022-08-09status Back on Market
-
2022-07-20historical Take Backups
-
2022-06-16price $124,900
-
2022-05-31price $127,500
-
2022-04-06$130,000 New Listing
-
2018-08-13soldstatus $55,000
-
2018-08-10soldstatus $55,000
-
2018-05-22$58,500
ⓘ Source: listings_history table (triggers on properties + properties_extension) + one-shot
backfill from property_details.listing_events for pre-trigger history.
Climate risk First Street
- Flood 1/10 Low FEMA zone X (unshaded) · 0% chance over 30 yrs
- Wildfire 6/10 Major
- Heat 4/10 Moderate 7 d/yr ≥105°F today · 20 d/yr by 30 yrs out
- Wind 2/10 Low 2% chance of damaging wind over 30 yrs
- Air quality 1/10 Low 0 unhealthy d/yr today · 0 by 30 yrs out
Nearby sold comps map
Loading sold comps map…
Walkable amenities ~0.75 mi
Loading nearby amenities…
Taxation est. · year 1
- Rental income
- $10,428
- − Mortgage interest
- −$7,254
- − Property taxes
- −$1,942
- − Insurance
- −$648
- − Repairs & maintenance
- −$834
- − Management
- −$834
- − Depreciation
- −$3,767
- Taxable loss
- −$4,852
- Est. tax savings @ 24.0%
- +$1,164
- After-tax cash flow
- $-1,337/yr
For passive investors: Depreciation is non-cash, so a rental often shows a tax loss while cash-flowing — sheltering income. Rental losses are passive: they offset passive income freely, and up to $25,000/yr can offset ordinary (W-2) income if you actively participate and your MAGI is under $100k (phasing out to $0 by $150k); unused losses carry forward. On sale, claimed depreciation is recaptured at up to 25%, and gains may owe capital-gains tax (a 1031 exchange can defer both). Figures are a year-1 estimate at your 24.0% rate — not tax advice; consult a CPA.
Schools (NCES district)
- District
- Valley Springs School District
- NCES district ID
- 0513350
- Math proficiency
- 56% ▼ -9.00%
- Reading proficiency
- 55% ▼ -9.00%
- Median HH income
- $41,757
- Composite
- 46.57/100
- National rank
- #2424
- State rank
- #7 of 238 in AR
Livability — Valley Springs
- Score
- 62/100
- State rank
- #225
- US rank
- #17148
Category grades
Schools grade is shown separately in the Schools card above.
Census & demographics
- Population (ZIP)
- 1,976
Population outlook (Boone County) Hauer SSP2
- Today (2025)
- 37,238 people
- By 2030
- 36,808 · -1.2%
- By 2040
- 35,597 · -4.4%
- By 2050
- 34,197 · -8.2%
- By 2075
- 30,503 · -18.1%
- By 2100
- 25,797 · -30.7%
Race, ethnicity, and origin ACS 2023
- Neighborhood character
- Predominantly White (96%)
- Race & ethnicity
- White 96% Hispanic / Latino 2% Two or more races 2%
- Common ancestry
- Iranian 4% Lithuanian 2% Romanian 2%
Political lean MEDSL · Boone
- 2024 margin
- Solid R (+65.0) · D 16.7% · R 81.6% · Other 1.7%
- 2008→2024 swing
- -25.3pp toward R · 2008: -39.7pp · 2024: -65.0pp
- All cycles
- 2024: R+65.0 2020: R+61.9 2016: R+58.5 2012: R+48.0 2008: R+39.7
Not yet ingested
- Civics
- —
Market trends
- HPI YoY
- ▼ -3.36%
- Current HPI
- 280.778
- Rent YoY
- —
- Metro
- —
- State GDP YoY
- ▲ 3.80%
- F500 in state
- 10
Industry mix (Fortune 500 HQ in AR)
| Industry | F500 HQs | Revenue |
|---|---|---|
| Retail | 1 | $681B |
|
||
| Food / Agriculture | 1 | $53B |
|
||
| Retail / Energy | 1 | $22B |
|
||
| Transportation / Logistics | 1 | $12B |
|
||
| Energy | 1 | $4B |
|
||
Price history
+121.4% since first listed27 events — show timeline
- 2025-11-04 Listed $129,500 CARMLS
- 2024-09-20 Listing Removed — CARMLS
- 2024-05-24 Price Changed $126,900 CARMLS
- 2024-04-04 Price Changed $128,500 CARMLS
- 2024-01-19 Listed $126,900 MHMLS
- 2024-01-19 Listed $129,900 CARMLS
- 2023-12-23 Listing Removed — CARMLS
- 2023-11-01 Price Changed $129,900 CARMLS
- 2023-11-01 Price Changed $129,900 MHMLS
- 2023-09-30 Price Changed $130,900 CARMLS
- 2023-09-29 Price Changed $130,900 MHMLS
- 2023-09-29 Relisted — CARMLS
- 2023-09-12 Contingent — CARMLS
- 2023-09-08 Price Changed $131,900 CARMLS
- 2023-09-07 Price Changed $131,900 MHMLS
- 2023-06-23 Listed $132,500 CARMLS
- 2023-06-23 Listed $132,500 MHMLS
- 2022-12-07 Listing Removed — CARMLS
- 2022-08-26 Price Changed $122,900 CARMLS
- 2022-08-09 Relisted — CARMLS
- 2022-07-20 Contingent — CARMLS
- 2022-06-16 Price Changed $124,900 CARMLS
- 2022-05-31 Price Changed $127,500 CARMLS
- 2022-04-06 Listed $130,000 CARMLS
- 2018-08-13 Sold (Public Records) $55,000 Public Records
- 2018-08-10 Sold (MLS) $55,000 NWARMLS
- 2018-05-22 Listed $58,500 NWARMLS
Property tax history
-3.8%/yrLatest (2025): $35 · -39.4% YoY. Source: county tax records.
Cash-flow waterfall
monthlySold comps — $/sqft
last 12 mo · ≤1 miLoading sold comps…