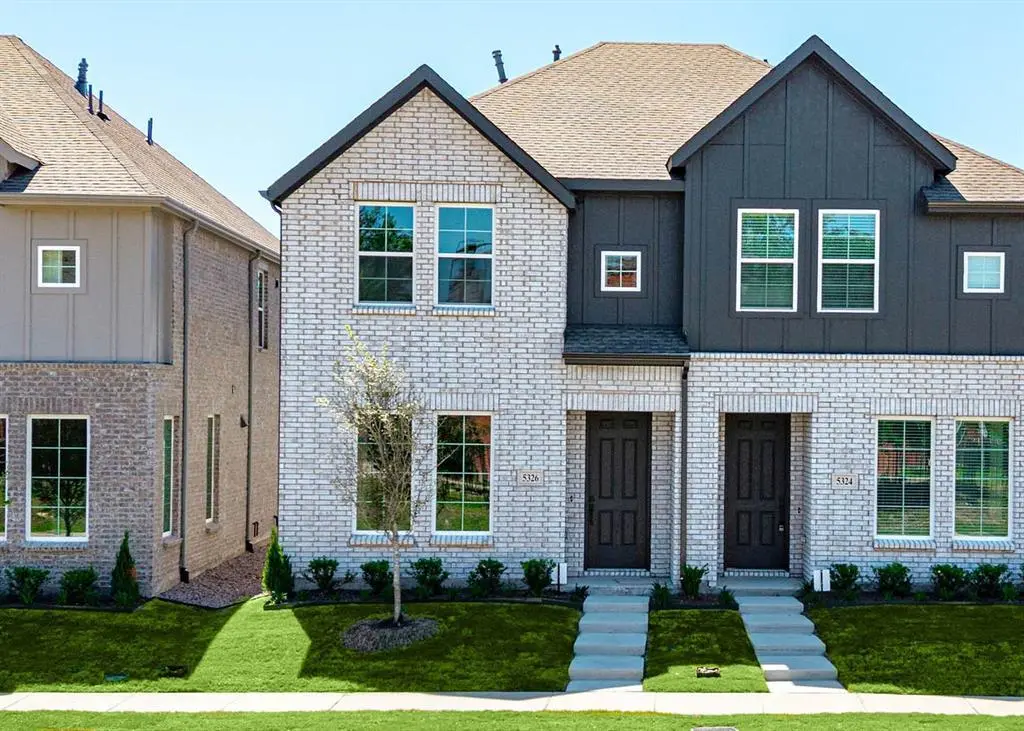
5326 Springlake Pkwy · Haltom City, TX
Flood risk 1/10 · Minimal
- FEMA flood zone
- X (unshaded)
- Chance of flooding over 30 yrs
- 0.0%
- Est. flood insurance / yr
- $507 – $1,088
Fire risk 1/10 · Minimal
- Est. fire insurance / yr
- $1,222 – $2,270
Heat risk 7/10 · Major
- Hot days now (above 109°F)
- 7 days/yr
- Hot days in 30 yrs
- 23 days/yr
Wind risk 4/10 · Minor
- Chance of severe wind over 30 yrs
- 24.0%
Air-quality risk 4/10 · Minor
- Unhealthy air days now
- 4 days/yr
- Unhealthy air days in 30 yrs
- 5 days/yr
Risk factors via First Street. Map © Google.
Why this score? — see what drove the D- grade
The composite is a weighted blend of 9 inputs, each scored 0–100. Each bar is that input's sub-score; the figure is the points it added to the 100-point composite (weight × sub-score).
- Cash flow +11.0/30.0
- ARV discount +8.2/15.0
- Rent growth +4.5/5.0
- Schools +3.7/10.0
- Livability +3.3/5.0
- DSCR +3.2/10.0
- Condition / age +2.5/5.0
- 1% rule +2.0/10.0
- Appreciation +0.0/10.0
$284,990
🖨 Deal sheet (PDF) 📄 Offer letter ✓ Due diligence
Listing remarks MLS
CB JENI HOMES OLIVIA floor plan. Gorgeous 3-bedroom, 2.5 bath END UNIT TOWNHOME with high-end finishes NOW INCLUDED, to include quartz countertops in kitchen & baths, spacious kitchen, gorgeous backsplash, beautiful white cabinetry, luxury laminate flooring, and more! Incredibly energy efficient with tankless water heater and dual WIFI programmable thermostats! Tour the model home to see this beautifully staged floorplan. Ready NOW!
Key facts
- 2 garage spots
- Built 2026
- Listed 98 days
Neighborhood map
What this means for you Summary
Snapshot
- This is a 3-bed/2.5-bath other listed at $285k.
Deal economics
- At list price, monthly cash flow is $-120 ($-1k/yr) — negative.
- To cash-flow at today's rent, offer at most $264k (7.4% below list).
- To meet the 1% rule (rent ≥ 1% of price), the offer needs to be $200k (29.7% below list).
- Recommended offer: $200k (29.7% below list) — sets the bar for 1% rule.
- Cap rate 5.8% vs local median 4.2% in Haltom City — top-decile yield for the area; either an underpriced asset or a hidden risk that comps aren't pricing in. Stress-test before assuming the spread holds.
Location & tenants
- Location reads 66/100 on livability (#644 in TX) — a middle-class / working-renter tenant base. Strengths: cost of living A+, housing A+; Watch: employment D+, amenities F, commute F.
- Birdville ISD (suburban): math 42% / reading 43% proficiency, ranked #299 of 826 in TX (top 36%) — families likely to look elsewhere, expect single-tenant / working-renter base with shorter leases.
- Zoned schools: O H Stowe El (math 38% / reading 34%, grade F, #1,921 of 4,322 statewide, top 45%, 674 students, 83% FRL); North Oaks Middle (math 26% / reading 26%, grade F, #1,222 of 1,662 statewide, top 74%, 507 students, 74% FRL); Haltom H S (math 37% / reading 48%, grade F, #721 of 1,632 statewide, top 45%, 2,785 students, 72% FRL) — zoned schools average 76% FRL vs 48% district-wide (28 pts higher); higher-poverty schools than district average — tighter screening recommended.
- Market conditions: Rents rising fast (+7.9%/yr); 123 active listings in the ZIP; 40 comparable units currently listed for rent nearby; rentals at typical pace (median 23d on market — plan ~3-4 weeks tenant-placement turnaround); 18,938 units permitted in Tarrant County in 2024 (8,336 in 5+ unit buildings).
- At $2,005/mo this rent would consume 47% of the median local household income ($52k/yr) (locally 1105% of renters already pay >50% of income on rent) — very limited rent-growth headroom before tenants either downsize or default.
Forward outlook
- Local home prices are declining (-3.0%/yr); year-one equity from $2k of loan paydown is wiped out by about $9k of value loss. Plan a longer hold.
- Tarrant County population projected at +41% by 2050 — long-run rental-demand tailwind backs the buy-and-hold thesis.
Negotiation context
- It's been on market 98 days — a 9% lower offer ($259k) is reasonable based on typical stale-listing flexibility.
- 2 sale attempts with the ask held roughly flat each time — persistent listings suggest the price (not the market) is what's stuck; bring a comps-based counter.
Risks & watch-outs
- Climate carrying-cost: extreme-heat days projected 7→23/yr by 2055 (HVAC capex compounding) — expect insurance premiums to compound above CPI over the hold.
Questions for the listing agent
- What do current leases actually rent for vs. the listed asking? Can we see a recent rent roll and the last 12 months of T-12 income?
- It's been on market 98 days. Have you received any prior offers? Is the seller open to a 30% concession, seller financing, or rate buy-down credit?
- Why hasn't it sold? Are there any deal-killer items the seller is aware of (foundation, flood, title, zoning, code violations)?
- Is there a deadline driving the sale (1031 exchange, divorce, estate, relocation)? That informs how much negotiation room exists.
- Schools are D-rated, which usually means shorter tenancies and higher turnover. Who's the typical renter profile here, and what's been the actual vacancy rate?
- The area grade is low — what's the realistic commute time and amenity access for the typical tenant pool here? Any planned neighborhood developments (good or bad) we should know about?
- What's the average days-on-market for RENTAL listings here right now (not sales)? A rising rental-DOM trend means longer vacancies and softer asking-rent achievability than the comps imply.
- What's the recent tenant-quality profile in this submarket — average credit score on applications, eviction rate, late-payment / NSF rate, and stable-employment percentage? A property-management company in the area should have these aggregated.
- How much new for-sale + rental construction is in the pipeline within 1–3 miles? Heavy new supply typically softens prices + rents 12–24 months out; constrained supply supports both.
Investment metrics
- 1% rule
- 0.70% ✗
- Cap rate
- 5.79%
- Cash-on-cash
- -1.80%
- DSCR
- 0.92
- GRM
- 11.8
CMA / ARV
- ARV (median comp)
- $289,792
- List price
- $284,990
- Delta
- -1.66%
- Verdict
- FAIR
- Comps
- 20 within 1.0 mi
Projected returns pro-forma
-3.0% appreciation · 7.89% rent growth · sell at horizon
- IRR
- -14.7%
- Equity multiple
- 0.45×
- Total profit
- $-43,596
- Equity at exit
- $42,493
- IRR
- -0.2%
- Equity multiple
- 0.98×
- Total profit
- $-1,336
- Equity at exit
- $24,641
Cash invested: $79,797 (down + closing). Projections, not guarantees.
Landlord ↔ Tenant lean methodology
- Overall (STATE)
- 87 Strongly Landlord-Friendly
- State Texas
- 87 Strongly Landlord-Friendly · R+5
- County
- — inherits STATE
- City
- — inherits STATE
ZIP-level market 76117
- Home prices YoY
- -23.9%
- Rents YoY
- 7.9%
- Active inventory
- 123
- Price-to-rent
- 11.8×
Monthly cashflow live
- Estimated rent
- $2,005 high interval (Pro) →
- Mortgage (P&I)
- −$1,495
- Tax from tax record
- −$90 /mo · $1,082/yr
- Insurance
- −$119
- HOA
- −$0
- Vacancy / Maint / Mgmt
- −$421
- Net cashflow
- $-120
Break-even live
Sensitivity live
| Price | -10% $42 | -5% $-39 | +0% $-120 | +5% $-200 | +10% $-281 |
|---|---|---|---|---|---|
| Rent | -10% $-278 | -5% $-199 | +0% $-120 | +5% $-41 | +10% $39 |
| Rate | -1.0pp $24 | -0.5pp $-47 | base $-120 | +0.5pp $-194 | +1.0pp $-269 |
UW: 25.0% down · 7.5% · 30yr · 1.5% tax · 5.0% vac · 8.0% maint · 8.0% mgmt
Financing live
Cash to close
- Down payment
- $71,248
- Closing costs
- $8,550
- Reserves months
- —
- Total cash needed
- —
Loan-product check · same deal, 3 products live
Conventional
25% down · 7.5% · 30yr
- Down + closing
- —
- Monthly P&I
- —
- Monthly cashflow
- —
- DSCR
- —
- Eligible?
- —
Personal DTI + credit; lowest rate.
DSCR
20% down · 8.5% · 30yr
- Down + closing
- —
- Monthly P&I
- —
- Monthly cashflow
- —
- DSCR
- —
- Eligible?
- —
No personal income docs; deal must DSCR.
Hard money
10% down · 12.0% · 12mo
- Down + closing
- —
- Monthly P&I
- —
- Monthly cashflow
- —
- DSCR
- —
- Eligible?
- —
Short-term bridge; refi at stabilization.
Rent comps 40 comps
| Address | Beds | Baths | Sqft | Rent | $/sqft | DOM | Units | Dist |
|---|---|---|---|---|---|---|---|---|
| 4813 Spirited Pathway Haltom City, TX | 3.0 | 2.5 | 1662 | $2,350 | $1.41 | 1d | 1 | 0.06mi |
| 4809 Harmony St Haltom City, TX | 4.0 | 3.5 | 1860 | $2,500 | $1.34 | 46d | 1 | 0.11mi |
| 5301 Springlake Pkwy Haltom City, TX | 1.0–2.0 | 1.0–2.0 | 813 | $1,485 | $1.83 | 23d | 4 | 0.14mi |
| 5114 Springlake Pkwy Haltom City, TX | 2.0 | 2.0 | 1196 | $2,260 | $1.89 | 45d | 1 | 0.24mi |
| 4708 Haltom Rd Haltom City, TX | 2.0 | 2.0 | 1161 | $2,300 | $1.98 | 45d | 1 | 0.36mi |
| 4704 Haltom Rd Haltom City, TX | 2.0 | 2.0 | 1161 | $2,100 | $1.81 | 45d | 1 | 0.36mi |
| 4428 Jane Anne St Haltom City, TX | 4.0 | 2.0 | 1231 | $2,200 | $1.79 | 4d | 1 | 0.45mi |
| 5313 Mack Rd Haltom City, TX | 4.0 | 3.0 | 1692 | $2,099 | $1.24 | 45d | 1 | 0.47mi |
| 4425 Jane Anne St Haltom City, TX | 3.0 | 1.5 | 1025 | $1,800 | $1.76 | 26d | 1 | 0.49mi |
| 4209 Haltom Rd Haltom City, TX | 3.0 | 2.0 | 1404 | $1,895 | $1.35 | 46d | 1 | 0.65mi |
| 5604 Bonner Dr Haltom City, TX | 4.0 | 2.0 | 1769 | $2,220 | $1.25 | 0d | 1 | 0.75mi |
| 4957 Colonial Park Dr Haltom City, TX | 3.0 | 2.0 | 1432 | $1,420 | $0.99 | 26d | 1 | 0.79mi |
| 5100 Herrick Ct Haltom City, TX | 2.0 | 2.0 | 901 | $1,075 | $1.19 | 8d | 1 | 0.83mi |
| 5400 Haltom Rd Haltom City, TX | 1.0–3.0 | 1.0–2.0 | 1095 | $3,097 | $2.83 | 1d | 71 | 0.90mi |
| 5604 Macgregor Dr Haltom City, TX | 3.0 | 2.0 | 1348 | $1,900 | $1.41 | 45d | 1 | 1.03mi |
| 4200 Northern Cross Blvd Haltom City, TX | 1.0–3.0 | 1.0–2.0 | 979 | $1,986 | $2.03 | 0d | 31 | 1.11mi |
| 5350 Fossil Creek Blvd Unit 5407 Haltom City, TX | 2.0 | 2.0 | 1030 | $1,490 | $1.45 | 45d | 1 | 1.12mi |
| 5350 Fossil Creek Blvd Unit 5383 Haltom City, TX | 3.0 | 2.0 | 1324 | $2,229 | $1.68 | 0d | 1 | 1.12mi |
| 5350 Fossil Creek Blvd Unit 2105 Haltom City, TX | 2.0 | 2.0 | 1030 | $1,415 | $1.37 | 0d | 1 | 1.12mi |
| 5350 Fossil Creek Blvd Unit 5387 Haltom City, TX | 2.0 | 2.0 | 1030 | $1,374 | $1.33 | 0d | 1 | 1.12mi |
| 5350 Fossil Creek Blvd Fort Worth, TX | 2.0 | 2.0 | 1127 | $1,705 | $1.51 | 45d | 1 | 1.12mi |
| 5621 Macdougall Dr Haltom City, TX | 3.0 | 2.0 | 1359 | $1,965 | $1.45 | 26d | 1 | 1.13mi |
| Fossil Creek Blvd #1125 Haltom City, TX | 1.0–2.0 | 1.0–2.0 | 881 | $2,140 | $2.43 | 22d | 7 | 1.14mi |
| 5350 Fossil Creek Blvd Unit 7-734 Fort Worth, TX | 1.0–2.0 | 1.0–2.0 | 934 | $2,180 | $2.33 | 22d | 10 | 1.15mi |
| 5340 Jerri Ln Haltom City, TX | 3.0 | 1.0 | 1134 | $1,795 | $1.58 | 9d | 1 | 1.17mi |
| 5544 Dunson Dr Haltom City, TX | 3.0 | 2.0 | 1187 | $1,950 | $1.64 | 45d | 1 | 1.19mi |
| 5333 Fossil Creek Blvd Unit 5390 Haltom City, TX | 2.0 | 2.0 | 993 | $1,360 | $1.37 | 26d | 1 | 1.21mi |
| 5333 Fossil Creek Blvd Unit 5366 Haltom City, TX | 3.0 | 2.0 | 1330 | $1,915 | $1.44 | 26d | 1 | 1.21mi |
| 4100 Northern Cross Blvd Fort Worth, TX | 3.0 | 1.0–2.0 | 948 | $2,921 | $3.08 | 0d | 35 | 1.24mi |
| 5333 Fossil Creek Blvd Fort Worth, TX | 3.0 | 2.0 | 1330 | $2,170 | $1.63 | 45d | 1 | 1.26mi |
| 5333 Fossil Creek Blvd Fort Worth, TX | 1.0–3.0 | 1.0–2.0 | 1015 | $2,210 | $2.18 | 4d | 110 | 1.26mi |
| 6100 Browning Dr North Richland Hills, TX | 1.0–2.0 | 1.0–2.0 | 957 | $1,759 | $1.84 | 0d | 26 | 1.28mi |
| 6309 Iron Horse Blvd North Richland Hills, TX | 2.0 | 1.0–2.0 | 912 | $2,179 | $2.39 | 3d | 29 | 1.32mi |
| 5500 N Beach St Fort Worth, TX | 2.0 | 2.0 | 1105 | $1,835 | $1.66 | 4d | 1 | 1.33mi |
| 5500 N Beach St Fort Worth, TX | 3.0 | 2.0 | 1378 | $2,393 | $1.74 | 45d | 1 | 1.33mi |
| 5500 N Beach St Fort Worth, TX | 3.0 | 2.0 | 1378 | $2,297 | $1.67 | 22d | 1 | 1.33mi |
| 5809 Lance Ct Haltom City, TX | 4.0 | 2.0 | 1359 | $1,950 | $1.43 | 1d | 1 | 1.33mi |
| 5620 Oregon Trail Ct Haltom City, TX | 3.0 | 2.0 | 1190 | $1,839 | $1.55 | 18d | 1 | 1.34mi |
| 4700 Fossil Vista Dr Haltom City, TX | 1.0–3.0 | 1.0–2.0 | 984 | $2,693 | $2.74 | 3d | 12 | 1.36mi |
| 3736 Layton Ave Haltom City, TX | 3.0 | 1.5 | 1100 | $1,600 | $1.45 | 45d | 1 | 1.37mi |
Listing history 14 events
-
2026-06-09days on market $284,990 Active 98 DOM
-
2026-06-08days on market $284,990 Active 97 DOM
-
2026-06-07days on market $284,990 Active 96 DOM
-
2026-06-04days on market $284,990 Active 93 DOM
-
2026-06-03days on market $284,990 Active 92 DOM
-
2026-06-02days on market $284,990 Active 91 DOM
-
2026-06-02$284,990 Active 90 DOM
-
2026-06-01days on market $284,990 Active 90 DOM
-
2026-05-31days on market $284,990 Active 89 DOM
-
2026-03-16price $289,990 442-char remark
Show marketing remark (442 chars)
CB JENI HOMES OLIVIA floor plan. Gorgeous 3-bedroom, 2.5 bath END UNIT TOWNHOME with high-end finishes NOW INCLUDED, to include quartz countertops in kitchen & baths, spacious kitchen, gorgeous backsplash, beautiful white cabinetry, luxury laminate flooring, and more! Incredibly energy efficient with tankless water heater and dual WIFI programmable thermostats! Tour the model home to see this beautifully staged floorplan. Ready NOW!
-
2026-03-14price $289,990 442-char remark
Show marketing remark (442 chars)
CB JENI HOMES OLIVIA floor plan. Gorgeous 3 bedroom, 2.5 bath END UNIT TOWNHOME with high-end finishes NOW INCLUDED, to include quartz countertops in kitchen & baths, spacious kitchen, gorgeous backsplash, beautiful white cabinetry, luxury laminate flooring, and more! Incredibly energy efficient with tankless water heater and dual WIFI programmable thermostats! Tour the model home to see this beautifully staged floorplan. Ready NOW!!
-
2026-03-03price $294,990 442-char remark
Show marketing remark (442 chars)
CB JENI HOMES OLIVIA floor plan. Gorgeous 3 bedroom, 2.5 bath END UNIT TOWNHOME with high-end finishes NOW INCLUDED, to include quartz countertops in kitchen & baths, spacious kitchen, gorgeous backsplash, beautiful white cabinetry, luxury laminate flooring, and more! Incredibly energy efficient with tankless water heater and dual WIFI programmable thermostats! Tour the model home to see this beautifully staged floorplan. Ready NOW!!
-
2026-03-03$294,990 Active 442-char remark
Show marketing remark (442 chars)
CB JENI HOMES OLIVIA floor plan. Gorgeous 3 bedroom, 2.5 bath END UNIT TOWNHOME with high-end finishes NOW INCLUDED, to include quartz countertops in kitchen & baths, spacious kitchen, gorgeous backsplash, beautiful white cabinetry, luxury laminate flooring, and more! Incredibly energy efficient with tankless water heater and dual WIFI programmable thermostats! Tour the model home to see this beautifully staged floorplan. Ready NOW!!
-
2026-03-03$304,990 Active 442-char remark
Show marketing remark (442 chars)
CB JENI HOMES OLIVIA floor plan. Gorgeous 3 bedroom, 2.5 bath END UNIT TOWNHOME with high-end finishes NOW INCLUDED, to include quartz countertops in kitchen & baths, spacious kitchen, gorgeous backsplash, beautiful white cabinetry, luxury laminate flooring, and more! Incredibly energy efficient with tankless water heater and dual WIFI programmable thermostats! Tour the model home to see this beautifully staged floorplan. Ready NOW!!
ⓘ Source: listings_history table (triggers on properties + properties_extension) + one-shot
backfill from property_details.listing_events for pre-trigger history.
Tax reassessment forecast TX · Resets to sale price
- Current annual tax
- $1,082 · $90/mo
- Projected year-2 tax
- $5,215 · $435/mo
- Expected delta
- +$4,134/yr (+$344/mo · 382.2%)
ⓘ Screening estimate from a state-policy table — verify with the county assessor before closing.
Climate risk First Street
- Flood 1/10 Low FEMA zone X (unshaded) · 0% chance over 30 yrs
- Wildfire 1/10 Low
- Heat 7/10 Severe 7 d/yr ≥109°F today · 23 d/yr by 30 yrs out
- Wind 4/10 Moderate 24% chance of damaging wind over 30 yrs
- Air quality 4/10 Moderate 4 unhealthy d/yr today · 5 by 30 yrs out
Nearby sold comps map
Loading sold comps map…
Walkable amenities ~0.75 mi
Loading nearby amenities…
Taxation est. · year 1
- Rental income
- $24,054
- − Mortgage interest
- −$15,964
- − Property taxes
- −$1,082
- − Insurance
- −$1,425
- − Repairs & maintenance
- −$1,924
- − Management
- −$1,924
- − Depreciation
- −$8,291
- Taxable loss
- −$6,555
- Est. tax savings @ 24.0%
- +$1,573
- After-tax cash flow
- $135/yr
For passive investors: Depreciation is non-cash, so a rental often shows a tax loss while cash-flowing — sheltering income. Rental losses are passive: they offset passive income freely, and up to $25,000/yr can offset ordinary (W-2) income if you actively participate and your MAGI is under $100k (phasing out to $0 by $150k); unused losses carry forward. On sale, claimed depreciation is recaptured at up to 25%, and gains may owe capital-gains tax (a 1031 exchange can defer both). Figures are a year-1 estimate at your 24.0% rate — not tax advice; consult a CPA.
Schools (NCES district)
- District
- Birdville ISD
- NCES district ID
- 4810230
- Math proficiency
- 42% ▼ -12.00%
- Reading proficiency
- 43% ▼ -6.00%
- Median HH income
- $55,930
- Composite
- 37.13/100
- National rank
- #4491
- State rank
- #299 of 826 in TX
Livability — Haltom City
- Score
- 66/100
- State rank
- #644
- US rank
- #12214
Category grades
Schools grade is shown separately in the Schools card above.
Census & demographics
- Census place
- Haltom City, TX
- County
- Tarrant County · 2,033,669 people
- City population
- 32,950
- Metro
- Dallas-Fort Worth-Arlington, TX
- Population (ZIP)
- 32,950
- Household income
- $51,670
- Rent vs Own
- Severe rent burden
- 1105.0
Population outlook (Tarrant County) Hauer SSP2
- Today (2025)
- 2,380,417 people
- By 2030
- 2,578,900 · +8.3%
- By 2040
- 2,974,995 · +25.0%
- By 2050
- 3,350,489 · +40.8%
- By 2075
- 4,216,909 · +77.2%
- By 2100
- 4,741,527 · +99.2%
Race, ethnicity, and origin ACS 2023
- Neighborhood character
- Diverse neighborhood (Simpson 0.64)
- Race & ethnicity
- Hispanic / Latino 46% White 38% Two or more races 18% Asian 7% Black 6%
- Hispanic origin (detail)
- Mexican 42% Puerto Rican 1%
- Common ancestry
- Italian 2% Serbian 1% Lithuanian 1%
- Foreign-born
- 24% · Canada, Vietnam
- Languages at home
- 56% English-only · Spanish 36% Other Asian/Pacific 4% Vietnamese 2%
Political lean MEDSL · Tarrant
- 2024 margin
- Lean R (+5.1) · D 46.7% · R 51.9% · Other 1.4%
- 2008→2024 swing
- +6.6pp toward D · 2008: -11.7pp · 2024: -5.1pp
- All cycles
- 2024: R+5.1 2020: D+0.2 2016: R+8.7 2012: R+15.7 2008: R+11.7
Not yet ingested
- Civics
- —
Market trends
- HPI YoY
- ▼ -103.25%
- Current HPI
- 328.69
- Rent YoY
- ▲ 7.89%
- Metro
- Dallas-Fort Worth-Arlington, TX
- State GDP YoY
- ▲ 3.95%
- F500 in state
- 110
Industry mix (Fortune 500 HQ in TX)
| Industry | F500 HQs | Revenue |
|---|---|---|
| Energy | 16 | $1,198B |
|
||
| Technology | 5 | $198B |
|
||
| Engineering / Construction | 4 | $72B |
|
||
| Energy Services | 3 | $60B |
|
||
| Utilities | 3 | $41B |
|
||
| Healthcare | 2 | $330B |
|
||
Price history
-4.9% since first listed5 events — show timeline
- 2026-03-16 Price Changed $289,990 Zillow
- 2026-03-14 Price Changed $289,990 NTREIS
- 2026-03-03 Price Changed $294,990 NTREIS
- 2026-03-03 Listed $294,990 Zillow
- 2026-03-03 Listed $304,990 NTREIS
Property tax history
-1.4%/yrLatest (2025): $1,082 · -2.4% YoY. Source: county tax records.
Cash-flow waterfall
monthlySold comps — $/sqft
last 12 mo · ≤1 miLoading sold comps…