 Fourplex
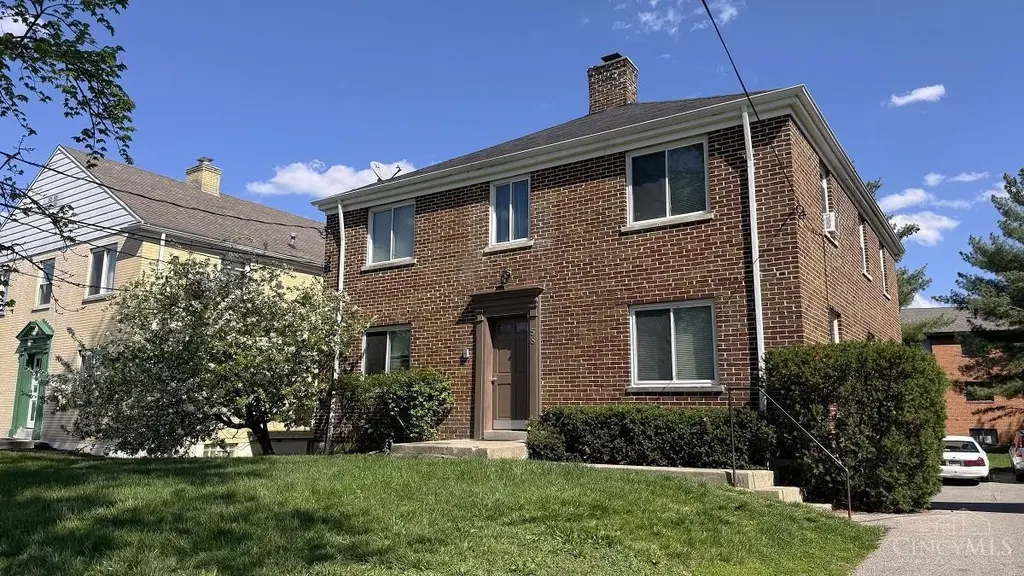
58 Gorman Ln · Reading, OH
Flood risk 1/10 · Minimal
- FEMA flood zone
- X (unshaded)
- Chance of flooding over 30 yrs
- 0.0%
- Est. flood insurance / yr
- $507 – $1,088
Fire risk 1/10 · Minimal
- Est. fire insurance / yr
- $713 – $1,323
Heat risk 5/10 · Moderate
- Hot days now (above 103°F)
- 7 days/yr
- Hot days in 30 yrs
- 19 days/yr
Wind risk 2/10 · Minimal
- Chance of severe wind over 30 yrs
- 1.0%
Air-quality risk 4/10 · Minor
- Unhealthy air days now
- 4 days/yr
- Unhealthy air days in 30 yrs
- 5 days/yr
Risk factors via First Street. Map © Google.
Why this score? — see what drove the C grade
The composite is a weighted blend of 9 inputs, each scored 0–100. Each bar is that input's sub-score; the figure is the points it added to the 100-point composite (weight × sub-score).
- Cash flow +25.8/30.0
- DSCR +8.6/10.0
- 1% rule +6.7/10.0
- Rent growth +4.5/5.0
- Schools +4.4/10.0
- Livability +4.0/5.0
- Condition / age +2.5/5.0
- ARV discount +0.0/15.0
- Appreciation +0.0/10.0
$334,900
🖨 Deal sheet 📄 Offer letter ✓ Due diligence
Multi-family units
County records classify this as Multi-Family (5+ Unit). Listing-text estimate: 4 units. estimate disagrees with records
5+ unit building — per-unit beds/baths from public records are typically unavailable; the breakdown below (if shown) is an estimate from the listing text.
Listing remarks MLS
Fully leased 4-unit all brick building generating $3,325/mo, with an upside potential of $3700+. Features ample off-street parking, on-site storage, and vendor-managed coin laundry. Recently renovated units boast hardwood / premium vinyl plank floors, updated counters, cabinets, and baths. Tenants pay electric and cooking gas. Owner pays central heat, water, and trash (total $484/mo on average). Unit A (2BR): $1025 month-to-month. Unit B (Studio): $600 long-term tenant thru 9/30/26. Unit C (2BR): $1000 thru 10/8/26. Unit D (Studio): $700 thru 3/20/27. Rents are below market. All appliances stay. Great investment opportunity with instant and long-term potential! See pdf file for a list of major repairs. Video walkthroughs available upon request.
Key facts
- 6,316 sq ft lot
- 4 parking spots
- Built 1942
Neighborhood map
What this means for you Summary
Snapshot
- This is a 2×2bd/1ba + 2×1bd/1ba units multifamily listed at $335k.
Deal economics
- At list price, monthly cash flow is $810 ($10k/yr) — positive. Per door: $203/mo.
- The deal already cash-flows at list — no discount required.
- Meets the 1% rule at list price ($4k rent vs $335k).
- Recommended offer: $315k (6.0% below list) — sets the bar for market timing.
- Cap rate 9.2% vs local median 4.8% in Reading — top-decile yield for the area; either an underpriced asset or a hidden risk that comps aren't pricing in. Stress-test before assuming the spread holds.
Location & tenants
- Location reads 80/100 on livability (#112 in OH, #1,682 nationally) — a professional / high-income tenant draw. Strengths: commute A+, cost of living A+, housing A+; Watch: employment D, amenities F.
- Reading Community City (suburban): math 51% / reading 54% proficiency, ranked #413 of 656 in OH (top 63%) — acceptable for families but not a draw, mixed tenant base, ~2y average lease.
- Market conditions: Rents rising fast (+8.0%/yr); 47 active listings in the ZIP; 801 units permitted in Hamilton County in 2024 (190 in 5+ unit buildings).
- At $3,922/mo this rent would consume 68% of the median local household income ($69k/yr) (locally 1529% of renters already pay >50% of income on rent) — very limited rent-growth headroom before tenants either downsize or default.
Forward outlook
- Local home prices are declining (-3.0%/yr); year-one equity from $2k of loan paydown is wiped out by about $10k of value loss. Plan a longer hold.
- At projected returns (-3.0% appreciation + 8.0% rent growth), your $94k cash investment doubles in ~8 years — after that, you're playing with house money.
Negotiation context
- It's been on market 69 days — a 6% lower offer ($315k) is reasonable based on typical stale-listing flexibility.
- 5 sale attempts since 26y ago with the ask held roughly flat each time — persistent listings suggest the price (not the market) is what's stuck; bring a comps-based counter.
- Current owner paid $55k; list at $335k implies a 509% gain — meaningful room to come down on a strong offer.
Risks & watch-outs
- Watch-outs: built in 1942 — expect roof / HVAC / electrical / plumbing capex.
- Climate carrying-cost: extreme-heat days projected 7→19/yr by 2055 (HVAC capex compounding) — expect insurance premiums to compound above CPI over the hold.
Questions for the listing agent
- It's been on market 69 days. Have you received any prior offers? Is the seller open to a 6% concession, seller financing, or rate buy-down credit?
- Can we see the unit-by-unit rent roll, current vacancy, and any below-market leases? What's the average tenancy length?
- What capital expenditures (roof, boiler, parking lot, exteriors) have been made in the last 5 years, and what's planned in the next 2?
- Built in 1942 — when were the roof, HVAC, electrical panel, plumbing, and water heater last replaced?
- Why hasn't it sold? Are there any deal-killer items the seller is aware of (foundation, flood, title, zoning, code violations)?
- Is there a deadline driving the sale (1031 exchange, divorce, estate, relocation)? That informs how much negotiation room exists.
- Schools are A-rated — typically a magnet for longer-tenancy family renters. What's the average tenant stay here, and is there a school-zone premium baked into asking?
- What's the average days-on-market for RENTAL listings here right now (not sales)? A rising rental-DOM trend means longer vacancies and softer asking-rent achievability than the comps imply.
- What's the recent tenant-quality profile in this submarket — average credit score on applications, eviction rate, late-payment / NSF rate, and stable-employment percentage? A property-management company in the area should have these aggregated.
- How much new apartment / multifamily construction is in the pipeline within 1–3 miles? Heavy new supply (>2% of stock underway) typically softens rents 12–24 months out; light construction supports rent growth.
Investment metrics
- 1% rule
- 1.17% ✓
- Cap rate
- 9.20%
- Cash-on-cash
- 10.37%
- DSCR
- 1.46
- GRM
- 7.1
CMA / ARV
- ARV (median comp)
- $281,484
- List price
- $334,900
- Delta
- 18.98%
- Verdict
- OVERPRICED
- Comps
- 17 within 1.0 mi
Projected returns pro-forma
-3.0% appreciation · 8.0% rent growth · sell at horizon
- IRR
- 4.7%
- Equity multiple
- 1.19×
- Total profit
- $18,102
- Equity at exit
- $49,935
- IRR
- 18.3%
- Equity multiple
- 2.88×
- Total profit
- $176,718
- Equity at exit
- $28,956
Cash invested: $93,772 (down + closing). Projections, not guarantees.
Landlord ↔ Tenant lean methodology
- Overall (STATE)
- 73 Landlord-Friendly
- State Ohio
- 73 Landlord-Friendly · R+6
- County
- — inherits STATE
- City
- — inherits STATE
ZIP-level market 45215
- Rents YoY
- 8.0%
- Active inventory
- 47
- Price-to-rent
- 27.4×
Monthly cashflow live
- Estimated rent
- $3,922 high interval (Pro) →
- Mortgage (P&I)
- −$1,756
- Tax from tax record
- −$392 /mo · $4,709/yr
- Insurance
- −$140
- HOA
- −$0
- Vacancy / Maint / Mgmt
- −$824
- Net cashflow
- $810
Break-even live
4-unit breakdown (identical units grouped — click to expand)
| Units | Beds | Baths | Est. rent |
|---|---|---|---|
| 2× units | 2 | 1 | $2,036 |
| #1 | 2 | 1 | $1,018 |
| #2 | 2 | 1 | $1,018 |
| 2× units | 1 | 1 | $1,888 |
| #3 | 1 | 1 | $944 |
| #4 | 1 | 1 | $944 |
| Total (4 units) | $3,922 | ||
UW: 25.0% down · 7.5% · 30yr · 1.5% tax · 5.0% vac · 8.0% maint · 8.0% mgmt
Financing live
Cash to close
- Down payment
- $83,725
- Closing costs
- $10,047
- Reserves months
- —
- Total cash needed
- —
Loan-product check · same deal, 3 products live
Conventional
25% down · 7.5% · 30yr
- Down + closing
- —
- Monthly P&I
- —
- Monthly cashflow
- —
- DSCR
- —
- Eligible?
- —
Personal DTI + credit; lowest rate.
DSCR
20% down · 8.5% · 30yr
- Down + closing
- —
- Monthly P&I
- —
- Monthly cashflow
- —
- DSCR
- —
- Eligible?
- —
No personal income docs; deal must DSCR.
Hard money
10% down · 12.0% · 12mo
- Down + closing
- —
- Monthly P&I
- —
- Monthly cashflow
- —
- DSCR
- —
- Eligible?
- —
Short-term bridge; refi at stabilization.
Listing history 28 events
-
2026-06-18days on market $334,900 Active 69 DOM
-
2026-06-17days on market $334,900 Active 68 DOM
-
2026-06-16days on market $334,900 Active 67 DOM
-
2026-06-15days on market $334,900 Active 66 DOM
-
2026-06-13days on market $334,900 Active 64 DOM
-
2026-06-13days on market $334,900 Active 63 DOM
-
2026-06-09days on market $334,900 Active 60 DOM
-
2026-06-08days on market $334,900 Active 59 DOM
-
2026-06-07days on market $334,900 Active 58 DOM
-
2026-06-03days on market $334,900 Active 54 DOM
-
2026-06-02days on market $334,900 Active 53 DOM
-
2026-06-01days on market $334,900 Active 52 DOM
-
2026-05-31days on market $334,900 Active 51 DOM
-
2026-05-12price $334,900 754-char remark
Show marketing remark (754 chars)
Fully leased 4-unit all brick building generating $3,325/mo, with an upside potential of $3700+. Features ample off-street parking, on-site storage, and vendor-managed coin laundry. Recently renovated units boast hardwood / premium vinyl plank floors, updated counters, cabinets, and baths. Tenants pay electric and cooking gas. Owner pays central heat, water, and trash (total $484/mo on average). Unit A (2BR): $1025 month-to-month. Unit B (Studio): $600 long-term tenant thru 9/30/26. Unit C (2BR): $1000 thru 10/8/26. Unit D (Studio): $700 thru 3/20/27. Rents are below market. All appliances stay. Great investment opportunity with instant and long-term potential! See pdf file for a list of major repairs. Video walkthroughs available upon request.
-
2026-04-10$349,900 Active 754-char remark
Show marketing remark (754 chars)
Fully leased 4-unit all brick building generating $3,325/mo, with an upside potential of $3700+. Features ample off-street parking, on-site storage, and vendor-managed coin laundry. Recently renovated units boast hardwood / premium vinyl plank floors, updated counters, cabinets, and baths. Tenants pay electric and cooking gas. Owner pays central heat, water, and trash (total $484/mo on average). Unit A (2BR): $1025 month-to-month. Unit B (Studio): $600 long-term tenant thru 9/30/26. Unit C (2BR): $1000 thru 10/8/26. Unit D (Studio): $700 thru 3/20/27. Rents are below market. All appliances stay. Great investment opportunity with instant and long-term potential! See pdf file for a list of major repairs. Video walkthroughs available upon request.
-
2013-03-25soldstatus $55,000 145-char remark
Show marketing remark (145 chars)
6 bedrooms, 4 bath Mutli Family Quad home. Property features Gas/None, a partial basement, 4 built in garage at rear and 4 private parking places
-
2013-01-23$50,000 145-char remark
Show marketing remark (145 chars)
6 bedrooms, 4 bath Mutli Family Quad home. Property features Gas/None, a partial basement, 4 built in garage at rear and 4 private parking places
-
2010-10-31historical
-
2009-11-06$135,000
-
2006-10-26soldstatus $118,600
-
2006-08-17$115,900
-
2000-11-27soldstatus $126,500
-
2000-11-14soldstatus $126,500
-
2000-06-22$130,000
-
1992-05-12soldstatus $105,000
-
1990-07-10soldstatus $101,075
-
1988-10-03soldstatus $1,200,000
-
1988-10-03soldstatus $829,600
ⓘ Source: listings_history table (triggers on properties + properties_extension) + one-shot
backfill from property_details.listing_events for pre-trigger history.
Tax reassessment forecast OH · Partial reset (capped growth)
- Current annual tax
- $4,709 · $392/mo
- Projected year-2 tax
- $4,967 · $414/mo
- Expected delta
- +$258/yr (+$21/mo · 5.5%)
ⓘ Screening estimate from a state-policy table — verify with the county assessor before closing.
Climate risk First Street
- Flood 1/10 Low FEMA zone X (unshaded) · 0% chance over 30 yrs
- Wildfire 1/10 Low
- Heat 5/10 Major 7 d/yr ≥103°F today · 19 d/yr by 30 yrs out
- Wind 2/10 Low 100% chance of damaging wind over 30 yrs
- Air quality 4/10 Moderate 4 unhealthy d/yr today · 5 by 30 yrs out
Nearby sold comps map
Loading sold comps map…
Walkable amenities ~0.75 mi
Loading nearby amenities…
Taxation est. · year 1
- Rental income
- $47,064
- − Mortgage interest
- −$18,760
- − Property taxes
- −$4,709
- − Insurance
- −$1,674
- − Repairs & maintenance
- −$3,765
- − Management
- −$3,765
- − Depreciation
- −$9,743
- Taxable income
- $4,648
- Est. tax owed @ 24.0%
- −$1,116
- After-tax cash flow
- $8,607/yr
For passive investors: Depreciation is non-cash, so a rental often shows a tax loss while cash-flowing — sheltering income. Rental losses are passive: they offset passive income freely, and up to $25,000/yr can offset ordinary (W-2) income if you actively participate and your MAGI is under $100k (phasing out to $0 by $150k); unused losses carry forward. On sale, claimed depreciation is recaptured at up to 25%, and gains may owe capital-gains tax (a 1031 exchange can defer both). Figures are a year-1 estimate at your 24.0% rate — not tax advice; consult a CPA.
Schools (NCES district)
- District
- Reading Community City
- NCES district ID
- 3904469
- Math proficiency
- 51% ▼ -12.00%
- Reading proficiency
- 54% ▼ -9.00%
- Median HH income
- $43,128
- Composite
- 44.19/100
- National rank
- #2854
- State rank
- #413 of 656 in OH
Livability — Reading
- Score
- 80/100
- State rank
- #112
- US rank
- #1682
Category grades
Schools grade is shown separately in the Schools card above.
Census & demographics
- Census place
- Reading, OH
- County
- Hamilton County · 701,295 people
- Metro
- Cincinnati, OH-KY-IN
- Population (ZIP)
- 30,586
- Household income
- $69,372
- Rent vs Own
- Severe rent burden
- 1529.0
Population outlook (Hamilton County) Hauer SSP2
- Today (2025)
- 826,054 people
- By 2030
- 830,947 · +0.6%
- By 2040
- 832,319 · +0.8%
- By 2050
- 822,428 · -0.4%
- By 2075
- 788,688 · -4.5%
- By 2100
- 710,674 · -14.0%
Race, ethnicity, and origin ACS 2023
- Neighborhood character
- Majority White (63%)
- Race & ethnicity
- White 63% Black 26% Two or more races 6% Hispanic / Latino 3% Asian 2%
- Common ancestry
- Italian 3% Slovak 2% Lithuanian 1%
- Foreign-born
- 4% · Canada
- Languages at home
- 95% English-only · Spanish 2% Other Indo-European 1% French/Haitian/Cajun 1%
Political lean MEDSL · Hamilton
- 2024 margin
- D (+14.9) · D 57.0% · R 42.1%
- 2008→2024 swing
- +7.9pp toward D · 2008: 7.0pp · 2024: 14.9pp
- All cycles
- 2024: D+14.9 2020: D+15.9 2016: D+9.5 2012: D+4.9 2008: D+7.0
Not yet ingested
- Civics
- —
Market trends
- HPI YoY
- ▼ -263.50%
- Current HPI
- 217.3319
- Rent YoY
- ▲ 8.02%
- Metro
- Cincinnati, OH-KY-IN
- State GDP YoY
- ▲ 1.98%
- F500 in state
- 48
Industry mix (Fortune 500 HQ in OH)
| Industry | F500 HQs | Revenue |
|---|---|---|
| Insurance | 3 | $145B |
|
||
| Industrial Machinery | 3 | $49B |
|
||
| Financial Services | 3 | $24B |
|
||
| Consumer Goods | 2 | $93B |
|
||
| Aerospace / Defense | 2 | $47B |
|
||
| Utilities | 2 | $33B |
|
||
Price history
-72.1% since first listed15 events — show timeline
- 2026-05-12 Price Changed $334,900 Cincy MLS
- 2026-04-10 Listed $349,900 Cincy MLS
- 2013-03-25 Sold (MLS) $55,000 Cincy MLS
- 2013-01-23 Listed $50,000 Cincy MLS
- 2010-10-31 Listing Removed — Cincy MLS
- 2009-11-06 Listed $135,000 Cincy MLS
- 2006-10-26 Sold (MLS) $118,600 Cincy MLS
- 2006-08-17 Listed $115,900 Cincy MLS
- 2000-11-27 Sold (Public Records) $126,500 Public Records
- 2000-11-14 Sold (MLS) $126,500 Cincy MLS
- 2000-06-22 Listed $130,000 Cincy MLS
- 1992-05-12 Sold (Public Records) $105,000 Public Records
- 1990-07-10 Sold (Public Records) $101,075 Public Records
- 1988-10-03 Sold (Public Records) $829,600 Public Records
- 1988-10-03 Sold (Public Records) $1,200,000 Public Records
Property tax history
+10.4%/yrLatest (2025): $4,709 · +0.2% YoY. Source: county tax records.
Cash-flow waterfall
monthlySold comps — $/sqft
last 12 mo · ≤1 miLoading sold comps…