 🔨 Auction
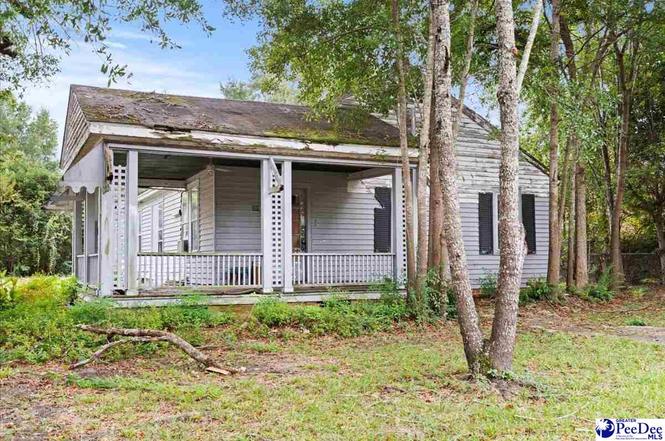
300 W Bryd St · Timmonsville, SC
Flood risk 1/10 · Minimal
- FEMA flood zone
- X (unshaded)
- Chance of flooding over 30 yrs
- 0.0%
- Est. flood insurance / yr
- $507 – $1,088
Fire risk 6/10 · Moderate
- Est. fire insurance / yr
- $783 – $1,453
Heat risk 7/10 · Major
- Hot days now (above 108°F)
- 7 days/yr
- Hot days in 30 yrs
- 15 days/yr
Wind risk 8/10 · Major
- Chance of severe wind over 30 yrs
- 80.0%
Air-quality risk 1/10 · Minimal
- Unhealthy air days now
- 0 days/yr
- Unhealthy air days in 30 yrs
- 0 days/yr
Risk factors via First Street. Map © Google.
Why this score? — see what drove the F grade
The composite is a weighted blend of 9 inputs, each scored 0–100. Each bar is that input's sub-score; the figure is the points it added to the 100-point composite (weight × sub-score).
- ARV discount +7.5/15.0
- Cash flow +7.3/30.0
- Schools +3.2/10.0
- Livability +2.8/5.0
- Rent growth +2.5/5.0
- Condition / age +2.5/5.0
- DSCR +1.5/10.0
- 1% rule +1.2/10.0
- Appreciation +0.0/10.0
$45,500
🖨 Deal sheet 📄 Offer letter ✓ Due diligence
Listing remarks
Don’t miss this excellent opportunity to acquire a 3-bedroom, 1-bath residential home with approximately 1,900 square feet of space, situated on a corner lot in the quiet town of Timmonsville, South Carolina. This property is ideal for seasoned investors looking to expand their portfolio or those searching for a new rehab project. The home was purchased by the current owner through an online auction following a delinquent tax sale. It will be conveyed by Quitclaim Deed only, using the most recent deed of record for the legal description. Please note: No title search has been performed by the seller or the closing attorney. Title insurance will not be offered. The seller has limited kn
Key facts
- 0.34 acre lot
- Built 1931
- Listed 237 days
Property features AI
Exterior
- Utilities: Public water; Public sewer
- Home design: Single-family residence; Residential property
- Construction: Wood siding; Shingle roof; Crawl space foundation; Built area above grade: 1,900
- Exterior features: Porch; Corner lot
Interior
- Kitchen: Range
- Flooring: Wood / Hardwood floors
- Bathrooms: 1 full bathroom
- Heating & cooling: Has cooling; Ceiling fan(s)
- Interior features: Fireplace (1); Ceiling fan(s)
Neighborhood map
What this means for you Summary
Snapshot
- This is a 3-bed/1.0-bath single-family listed at $46k.
Deal economics
- At list price, monthly cash flow is $-276 ($-3k/yr) — negative.
- The deal already cash-flows at list — no discount required.
- Meets the 1% rule at list price ($1k rent vs $46k).
- Recommended offer: $40k (12.0% below list) — sets the bar for market timing.
Location & tenants
- Location reads 55/100 on livability (#309 in SC) — a working-class tenant base; expect higher turnover. Strengths: cost of living A+, housing B; Watch: crime F, amenities F, commute F.
- Florence 01 (urban): math 29% / reading 47% proficiency, ranked #34 of 80 in SC (top 42%) — families likely to look elsewhere, expect single-tenant / working-renter base with shorter leases.
- Zoned schools: Brockington Elementary Magnet (301 students, 99% FRL) — zoned schools average 99% FRL vs 57% district-wide (42 pts higher); higher-poverty schools than district average — tighter screening recommended.
- Market conditions: 51 active listings in the ZIP; 657 units permitted in Florence County in 2024 (40 in 5+ unit buildings).
Forward outlook
- Local home prices are declining (-3.0%/yr); year-one equity from $1k of loan paydown is wiped out by about $6k of value loss. Plan a longer hold.
Negotiation context
- It's been on market 238 days — a 12% lower offer ($40k) is reasonable based on typical stale-listing flexibility.
- 3 sale attempts since 3y ago with the ask held roughly flat each time — persistent listings suggest the price (not the market) is what's stuck; bring a comps-based counter.
- Current owner paid $31k; 47% above their basis — modest negotiation headroom, anchor on the comps not their cost.
Risks & watch-outs
- Watch-outs: property tax is 3.3% of price; built in 1931 — expect roof / HVAC / electrical / plumbing capex.
- Climate carrying-cost: severe wind risk, 80% chance of damaging wind over 30y; major wildfire risk; extreme-heat days projected 7→15/yr by 2055 (HVAC capex compounding) — expect insurance premiums to compound above CPI over the hold.
Questions for the listing agent
- What do current leases actually rent for vs. the listed asking? Can we see a recent rent roll and the last 12 months of T-12 income?
- It's been on market 238 days. Have you received any prior offers? Is the seller open to a 12% concession, seller financing, or rate buy-down credit?
- Built in 1931 — when were the roof, HVAC, electrical panel, plumbing, and water heater last replaced?
- Property tax is high relative to price — has the assessment been appealed recently, and will the sale trigger a re-assessment?
- Why hasn't it sold? Are there any deal-killer items the seller is aware of (foundation, flood, title, zoning, code violations)?
- Is there a deadline driving the sale (1031 exchange, divorce, estate, relocation)? That informs how much negotiation room exists.
- Schools are F-rated, which usually means shorter tenancies and higher turnover. Who's the typical renter profile here, and what's been the actual vacancy rate?
- Crime grade is F in this area — have there been break-ins, vandalism, or insurance claims at this property in the last 3 years? What carrier currently insures it and at what premium?
- The area grade is low — what's the realistic commute time and amenity access for the typical tenant pool here? Any planned neighborhood developments (good or bad) we should know about?
- What's the average days-on-market for RENTAL listings here right now (not sales)? A rising rental-DOM trend means longer vacancies and softer asking-rent achievability than the comps imply.
- What's the recent tenant-quality profile in this submarket — average credit score on applications, eviction rate, late-payment / NSF rate, and stable-employment percentage? A property-management company in the area should have these aggregated.
- How much new for-sale + rental construction is in the pipeline within 1–3 miles? Heavy new supply typically softens prices + rents 12–24 months out; constrained supply supports both.
Investment metrics
- 1% rule
- 0.62% ✗
- Cap rate
- 4.70%
- Cash-on-cash
- -5.70%
- DSCR
- 0.75
- GRM
- 13.3
CMA / ARV
- ARV (on-the-fly)
- $207,100
- Comps found
- 4
Show comp detail 4 sales within ~0.75 mi
| Address | Dist | Beds/Ba | Sqft | Sold | Price | $/sf | Match |
|---|---|---|---|---|---|---|---|
| 302 W Byrd St | 0.02mi | 3/2.5 | 1,809 (-5%) | 18mo | $203,000 | $112 | 70 |
| 401 W Byrd St | 0.16mi | 3/2.0 | 1,655 (-13%) | 5mo | $98,500 | $60 | 63 |
| 100 W Byrd St | 0.19mi | 2/1.5 (-1) | 1,680 (-12%) | 6mo | $50,000 | $30 | 60 |
| 600 S Hill St | 0.59mi | 4/2.0 (+1) | 2,000 (+5%) | 18mo | $217,900 | $109 | 40 |
Match score weights: distance 35% · size 25% · config 20% · recency 20%. Top-matched comps best support the ARV.
Projected returns pro-forma
-3.0% appreciation · 3.0% rent growth · sell at horizon
- IRR
- -26.1%
- Equity multiple
- 0.12×
- Total profit
- $-51,178
- Equity at exit
- $30,879
- IRR
- -23.1%
- Equity multiple
- -0.16×
- Total profit
- $-67,425
- Equity at exit
- $17,906
Cash invested: $57,988 (down + closing). Projections, not guarantees.
Landlord ↔ Tenant lean methodology
- Overall (STATE)
- 90 Strongly Landlord-Friendly
- State South Carolina
- 90 Strongly Landlord-Friendly · R+6
- County
- — inherits STATE
- City
- — inherits STATE
ZIP-level market 29161
- Home prices YoY
- -4.9%
- Active inventory
- 51
- Price-to-rent
- 2.9×
Monthly cashflow live
- Estimated rent
- $1,294 medium interval (Pro) →
- Mortgage (P&I)
- −$1,086
- Tax from tax record
- −$126 /mo · $1,507/yr
- Insurance
- −$86
- HOA
- −$0
- Vacancy / Maint / Mgmt
- −$272
- Net cashflow
- $-276
Break-even live
UW: 25.0% down · 7.5% · 30yr · 1.5% tax · 5.0% vac · 8.0% maint · 8.0% mgmt
Financing live
Cash to close
- Down payment
- $51,775
- Closing costs
- $6,213
- Reserves months
- —
- Total cash needed
- —
Loan-product check · same deal, 3 products live
Conventional
25% down · 7.5% · 30yr
- Down + closing
- —
- Monthly P&I
- —
- Monthly cashflow
- —
- DSCR
- —
- Eligible?
- —
Personal DTI + credit; lowest rate.
DSCR
20% down · 8.5% · 30yr
- Down + closing
- —
- Monthly P&I
- —
- Monthly cashflow
- —
- DSCR
- —
- Eligible?
- —
No personal income docs; deal must DSCR.
Hard money
10% down · 12.0% · 12mo
- Down + closing
- —
- Monthly P&I
- —
- Monthly cashflow
- —
- DSCR
- —
- Eligible?
- —
Short-term bridge; refi at stabilization.
Listing history 21 events
-
2026-06-19days on market $45,500 Active 238 DOM
-
2026-06-18days on market $45,500 Active 237 DOM
-
2026-06-17days on market $45,500 Active 236 DOM
-
2026-06-16days on market $45,500 Active 235 DOM
-
2026-06-15days on market $45,500 Active 234 DOM
-
2026-06-14days on market $45,500 Active 232 DOM
-
2026-06-13days on market $45,500 Active 231 DOM
-
2026-06-10days on market $45,500 Active 229 DOM
-
2026-06-09days on market $45,500 Active 228 DOM
-
2026-06-08days on market $45,500 Active 227 DOM
-
2026-06-07days on market $45,500 Active 226 DOM
-
2026-06-05days on market $45,500 Active 223 DOM
-
2026-06-02days on market $45,500 Active 221 DOM
-
2026-06-01days on market $45,500 Active 220 DOM
-
2026-05-31days on market $45,500 Active 219 DOM
-
2026-05-30days on market $45,500 Active 218 DOM
-
2026-03-25status Active
-
2025-10-24$45,500 Active
-
2023-11-06$60,000 Active
-
1999-12-31soldstatus $31,000
-
1989-10-31soldstatus $31,000
ⓘ Source: listings_history table (triggers on properties + properties_extension) + one-shot
backfill from property_details.listing_events for pre-trigger history.
Tax reassessment forecast SC · Resets to sale price
- Current annual tax
- $1,507 · $126/mo
- Projected year-2 tax
- $1,507 · $126/mo
- Expected delta
- $0/yr ($0/mo · 0.0%)
ⓘ Screening estimate from a state-policy table — verify with the county assessor before closing.
Climate risk First Street
- Flood 1/10 Low FEMA zone X (unshaded) · 0% chance over 30 yrs
- Wildfire 6/10 Major
- Heat 7/10 Severe 7 d/yr ≥108°F today · 15 d/yr by 30 yrs out
- Wind 8/10 Severe 80% chance of damaging wind over 30 yrs
- Air quality 1/10 Low 0 unhealthy d/yr today · 0 by 30 yrs out
Nearby sold comps map
Loading sold comps map…
Walkable amenities ~0.75 mi
Loading nearby amenities…
Taxation est. · year 1
- Rental income
- $15,529
- − Mortgage interest
- −$11,601
- − Property taxes
- −$1,507
- − Insurance
- −$1,036
- − Repairs & maintenance
- −$1,242
- − Management
- −$1,242
- − Depreciation
- −$6,025
- Taxable loss
- −$7,124
- Est. tax savings @ 24.0%
- +$1,710
- After-tax cash flow
- $-1,598/yr
For passive investors: Depreciation is non-cash, so a rental often shows a tax loss while cash-flowing — sheltering income. Rental losses are passive: they offset passive income freely, and up to $25,000/yr can offset ordinary (W-2) income if you actively participate and your MAGI is under $100k (phasing out to $0 by $150k); unused losses carry forward. On sale, claimed depreciation is recaptured at up to 25%, and gains may owe capital-gains tax (a 1031 exchange can defer both). Figures are a year-1 estimate at your 24.0% rate — not tax advice; consult a CPA.
Schools (NCES district)
- District
- Florence 01
- NCES district ID
- 4502130
- Math proficiency
- 29% ▼ -10.00%
- Reading proficiency
- 47% ▬ 0.00%
- Median HH income
- $45,782
- Composite
- 32.36/100
- National rank
- #5737
- State rank
- #34 of 80 in SC
Livability — Timmonsville
- Score
- 55/100
- State rank
- #309
- US rank
- #23528
Category grades
Schools grade is shown separately in the Schools card above.
Census & demographics
- Census place
- Timmonsville, SC
- Population (ZIP)
- 10,114
Population outlook (Florence County) Hauer SSP2
- Today (2025)
- 141,714 people
- By 2030
- 142,121 · +0.3%
- By 2040
- 141,344 · -0.3%
- By 2050
- 139,478 · -1.6%
- By 2075
- 132,275 · -6.7%
- By 2100
- 118,374 · -16.5%
Race, ethnicity, and origin ACS 2023
- Neighborhood character
- Majority White (51%)
- Race & ethnicity
- White 51% Black 44% Two or more races 3% Hispanic / Latino 2%
- Common ancestry
- Iranian 3% Slovak 1% Serbian 1%
- Foreign-born
- 0%
- Languages at home
- 99% English-only · Spanish 1%
Political lean MEDSL · Florence
- 2024 margin
- Lean R (+8.0) · D 45.3% · R 53.3% · Other 1.3%
- 2008→2024 swing
- -4.8pp toward R · 2008: -3.2pp · 2024: -8.0pp
- All cycles
- 2024: R+8.0 2020: R+2.3 2016: R+5.0 2012: R+0.5 2008: R+3.2
Not yet ingested
- Civics
- —
Market trends
- HPI YoY
- ▼ -11.43%
- Current HPI
- 222.6015
- Rent YoY
- —
- Metro
- —
- State GDP YoY
- ▲ 4.51%
- F500 in state
- 2
Industry mix (Fortune 500 HQ in SC)
| Industry | F500 HQs | Revenue |
|---|---|---|
| Packaging | 1 | $7B |
|
||
Price history
+46.8% since first listed5 events — show timeline
- 2026-03-25 Relisted — RAGPD
- 2025-10-24 Listed $45,500 RAGPD
- 2023-11-06 Listed $60,000 RAGPD
- 1999-12-31 Sold (Public Records) $31,000 Public Records
- 1989-10-31 Sold (Public Records) $31,000 Public Records
Property tax history
+17.0%/yrLatest (2025): $1,507 · +5.9% YoY. Source: county tax records.
Cash-flow waterfall
monthlySold comps — $/sqft
last 12 mo · ≤1 miLoading sold comps…