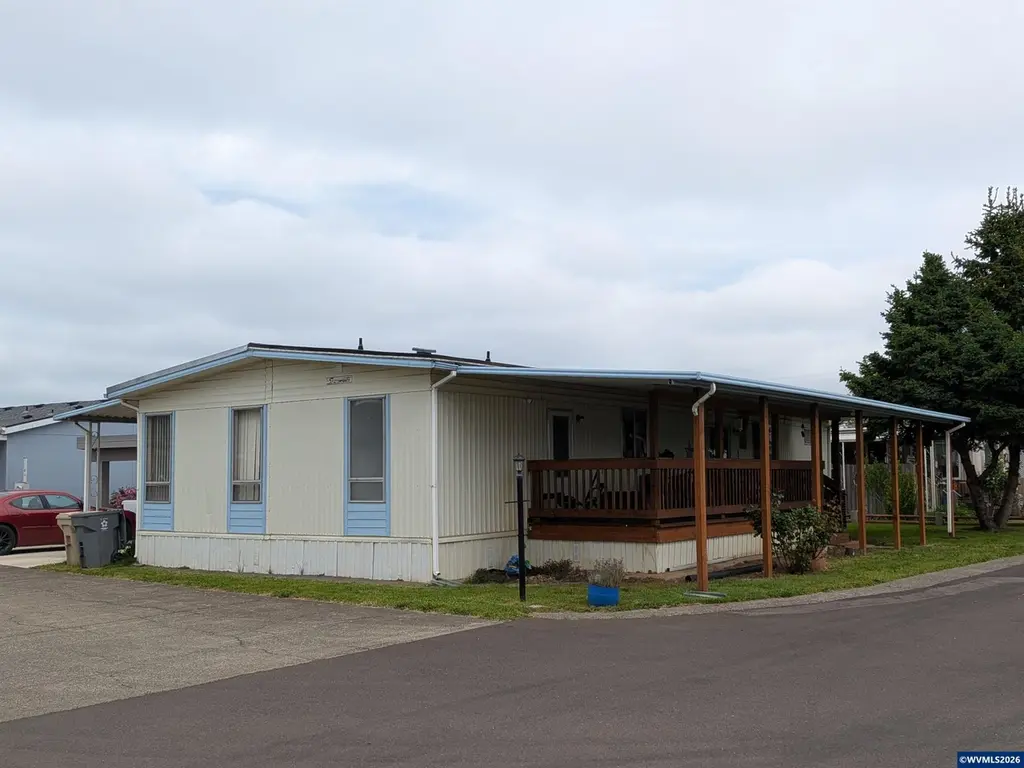
204 Cascade Dr #66 · Lebanon, OR
Flood risk 6/10 · Moderate
- FEMA flood zone
- X (unshaded)
- Chance of flooding over 30 yrs
- 0.71%
- Est. flood insurance / yr
- $507 – $1,088
Fire risk 5/10 · Moderate
- Est. fire insurance / yr
- $498 – $926
Heat risk 4/10 · Minor
- Hot days now (above 91°F)
- 7 days/yr
- Hot days in 30 yrs
- 16 days/yr
Wind risk 1/10 · Minimal
- Chance of severe wind over 30 yrs
- —
Air-quality risk 10/10 · Severe
- Unhealthy air days now
- 11 days/yr
- Unhealthy air days in 30 yrs
- 13 days/yr
Risk factors via First Street. Map © Google.
Why this score? — see what drove the B grade
The composite is a weighted blend of 9 inputs, each scored 0–100. Each bar is that input's sub-score; the figure is the points it added to the 100-point composite (weight × sub-score).
- Cash flow +30.0/30.0
- 1% rule +10.0/10.0
- DSCR +10.0/10.0
- ARV discount +7.5/15.0
- Rent growth +3.6/5.0
- Livability +3.6/5.0
- Schools +3.0/10.0
- Condition / age +2.5/5.0
- Appreciation +0.0/10.0
$110,000
🖨 Deal sheet 📄 Offer letter ✓ Due diligence
Listing remarks
Wonderful 3 bedroom - 2 bathroom home with a large back deck with views to the north! Great split-layout with a big master bedroom with walk-in- closet one side of the home and 2 bedroom 1 bath on the other. Both bathrooms have been updated. High ceilings throughout and an oversized heat pump keeping utility costs low. This home has a newer rubber membrane roofing also a new storage shed and carport on this corner lot. Financing available.
Key facts
- Garage
- Built 1972
- Listed 19 days
Property features AI
Finance
- Other: Home warranty negotiable; No assessments/liens reported; Financing available (per remarks)
- HOA & community: Adult park community; Park rent covers water, sewer, garbage, and cable
Exterior
- Parking: Carport; One garage space
- Utilities: City water; City sewer; Park rent includes water, sewer, garbage, and cable; Electric water heater
- Home design: Double-wide manufactured home; Made by Spacemaster; Located in an adult park (Santiam Village); Cream exterior color; Corner lot with large back deck and north-facing views; Entry and living spaces on the main level
- Construction: Built in 1972; Pier foundation; Aluminum siding; Roof listed as 'Other' (refer to remarks); newer rubber membrane roof noted in remarks
- Exterior features: Covered patio; Shed/outbuilding; Handicap amenities (refer to remarks)
Interior
- Kitchen: Electric range; Dishwasher; Garbage disposal
- Bedrooms: Master bedroom on the main level (15 x 15); Two additional bedrooms on the main level (10 x 10 each)
- Flooring: Carpet; Vinyl; Luxury vinyl plank
- Bathrooms: Two bathrooms on the main level (both updated)
- Heating & cooling: Heat pump; Forced air
- Interior features: High-speed communication available; Carpet and vinyl flooring with luxury vinyl plank
- Laundry & utility: Utility room on the main level (8 x 8); Electric water heater
Neighborhood map
What this means for you Summary
Snapshot
- This is a 3-bed/1.0-bath other listed at $110k.
Deal economics
- At list price, monthly cash flow is $826 ($10k/yr) — positive.
- The deal already cash-flows at list — no discount required.
- Meets the 1% rule at list price ($2k rent vs $110k).
- Recommended offer: $108k (1.5% below list) — sets the bar for market timing.
- Cap rate 15.3% vs local median 2.9% in Lebanon — top-decile yield for the area; either an underpriced asset or a hidden risk that comps aren't pricing in. Stress-test before assuming the spread holds.
Location & tenants
- Location reads 71/100 on livability (#126 in OR) — a middle-class / working-renter tenant base. Strengths: housing A+, crime A, cost of living A; Watch: schools C-, health & safety C-, amenities D+.
- Lebanon Community SD 9 (town): math 27% / reading 43% proficiency, ranked #26 of 58 in OR (top 45%) — families likely to look elsewhere, expect single-tenant / working-renter base with shorter leases.
- Market conditions: Rents rising fast (+4.5%/yr); 246 active listings in the ZIP; 16 comparable units currently listed for rent nearby; rentals lingering (median 44d on market — plan ~5-8 weeks vacancy on turnover, expect pricing pressure); 100% of comp listings sitting > 30 days — soft ceiling on asking rent; 311 units permitted in Linn County in 2024 (60 in 5+ unit buildings).
- This rent runs 33% of the median local income ($69k/yr) — at the standard rent-burdened threshold; future hikes will face affordability resistance.
Forward outlook
- Local home prices are declining (-3.0%/yr); year-one equity from $761 of loan paydown is wiped out by about $3k of value loss. Plan a longer hold.
- Linn County population projected at +5% by 2050 — modest demand growth; plan on rents tracking national, not racing it.
- At projected returns (-3.0% appreciation + 4.5% rent growth), your $31k cash investment doubles in ~4 years — after that, you're playing with house money.
Negotiation context
- It's been on market 20 days — a 2% lower offer ($108k) is reasonable based on typical stale-listing flexibility.
Risks & watch-outs
- Climate carrying-cost: major flood risk; moderate wildfire risk — expect insurance premiums to compound above CPI over the hold.
Questions for the listing agent
- Built in 1972 — when were the roof, HVAC, electrical panel, plumbing, and water heater last replaced?
- Is there a deadline driving the sale (1031 exchange, divorce, estate, relocation)? That informs how much negotiation room exists.
- What's the average days-on-market for RENTAL listings here right now (not sales)? A rising rental-DOM trend means longer vacancies and softer asking-rent achievability than the comps imply.
- What's the recent tenant-quality profile in this submarket — average credit score on applications, eviction rate, late-payment / NSF rate, and stable-employment percentage? A property-management company in the area should have these aggregated.
- How much new for-sale + rental construction is in the pipeline within 1–3 miles? Heavy new supply typically softens prices + rents 12–24 months out; constrained supply supports both.
Investment metrics
- 1% rule
- 1.73% ✓
- Cap rate
- 15.30%
- Cash-on-cash
- 32.18%
- DSCR
- 2.43
- GRM
- 4.8
CMA / ARV
No comps found within radius.
Projected returns pro-forma
-3.0% appreciation · 4.55% rent growth · sell at horizon
- IRR
- 28.8%
- Equity multiple
- 2.23×
- Total profit
- $37,785
- Equity at exit
- $16,401
- IRR
- 37.1%
- Equity multiple
- 4.68×
- Total profit
- $113,346
- Equity at exit
- $9,511
Cash invested: $30,800 (down + closing). Projections, not guarantees.
Landlord ↔ Tenant lean methodology
- Overall (STATE)
- 28 Tenant-Leaning
- State Oregon
- 28 Tenant-Leaning · D+6
- County
- — inherits STATE
- City
- — inherits STATE
ZIP-level market 97355
- Rents YoY
- 4.5%
- Active inventory
- 246
- Price-to-rent
- 4.8×
Monthly cashflow live
- Estimated rent
- $1,906 high interval (Pro) →
- Mortgage (P&I)
- −$577
- Tax from tax record
- −$57 /mo · $680/yr
- Insurance
- −$46
- HOA
- −$0
- Vacancy / Maint / Mgmt
- −$400
- Net cashflow
- $826
Break-even live
UW: 25.0% down · 7.5% · 30yr · 1.5% tax · 5.0% vac · 8.0% maint · 8.0% mgmt
Financing live
Cash to close
- Down payment
- $27,500
- Closing costs
- $3,300
- Reserves months
- —
- Total cash needed
- —
Loan-product check · same deal, 3 products live
Conventional
25% down · 7.5% · 30yr
- Down + closing
- —
- Monthly P&I
- —
- Monthly cashflow
- —
- DSCR
- —
- Eligible?
- —
Personal DTI + credit; lowest rate.
DSCR
20% down · 8.5% · 30yr
- Down + closing
- —
- Monthly P&I
- —
- Monthly cashflow
- —
- DSCR
- —
- Eligible?
- —
No personal income docs; deal must DSCR.
Hard money
10% down · 12.0% · 12mo
- Down + closing
- —
- Monthly P&I
- —
- Monthly cashflow
- —
- DSCR
- —
- Eligible?
- —
Short-term bridge; refi at stabilization.
Rent comps 16 comps
| Address | Beds | Baths | Sqft | Rent | $/sqft | DOM | Units | Dist |
|---|---|---|---|---|---|---|---|---|
| 362 Seven Oaks Ln Lebanon, OR | 3.0 | 2.5 | 1513 | $2,250 | $1.49 | 43d | 2 | 0.35mi |
| 86 Weldwood Dr Lebanon, OR | 2.0 | 2.0 | 1222 | $1,650 | $1.35 | 43d | 1 | 0.38mi |
| 3463 Snow Bird Dr Lebanon, OR | 2.0 | 2.0 | 1621 | $2,200 | $1.36 | 43d | 1 | 0.54mi |
| 26 Sand Ridge Ct Lebanon, OR | 3.0 | 2.5 | 1696 | $2,345 | $1.38 | 43d | 1 | 0.58mi |
| 2656 S Main Rd #107 Lebanon, OR | 3.0 | 2.5 | 1402 | $1,950 | $1.39 | 43d | 1 | 0.70mi |
| 300 Sand Ridge Ct Lebanon, OR | 1.0–2.0 | 1.0–2.0 | 944 | $1,525 | $1.61 | 43d | 6 | 0.75mi |
| 2180 Franklin St Lebanon, OR | 1.0–2.0 | 1.0–2.0 | 862 | $1,695 | $1.97 | 43d | 6 | 0.83mi |
| E Airport Rd Lebanon, OR | 1.0–3.0 | 1.0–2.0 | 993 | $1,995 | $2.01 | 43d | 14 | 0.96mi |
| 1956 S Second St Lebanon, OR | 1.0–2.0 | 1.0–2.0 | 840 | $1,445 | $1.72 | 43d | 7 | 1.05mi |
| 1900 S 2nd St Unit A304 Lebanon, OR | 3.0 | 2.0 | 1177 | $1,700 | $1.44 | 43d | 1 | 1.09mi |
| 1900 S Second St Unit A201 Lebanon, OR | 2.0 | 2.0 | 1078 | $1,450 | $1.35 | 43d | 1 | 1.09mi |
| 1096 Fuji Ln Lebanon, OR | 3.0 | 2.0 | 1300 | $2,395 | $1.84 | 43d | 1 | 1.20mi |
| 1515 David Dr Unit 1515-DA Lebanon, OR | 2.0 | 1.0 | 1104 | $1,450 | $1.31 | 43d | 1 | 1.23mi |
| 929 Wassom St Unit 929 Lebanon, OR | 2.0 | 2.0 | 1202 | $1,800 | $1.50 | 43d | 1 | 1.24mi |
| 975 Wassom St Lebanon, OR | 2.0 | 1.5 | 928 | $1,525 | $1.64 | 43d | 1 | 1.30mi |
| 2400 12th St Lebanon, OR | 1.0–2.0 | 1.0 | 926 | $1,600 | $1.73 | 43d | 6 | 1.50mi |
Listing history 2 events
-
2026-05-16price $110,000 443-char remark
-
2026-05-07$125,000 Active 443-char remark
ⓘ Source: listings_history table (triggers on properties + properties_extension) + one-shot
backfill from property_details.listing_events for pre-trigger history.
Tax reassessment forecast OR · Resets to sale price
- Current annual tax
- $680 · $57/mo
- Projected year-2 tax
- $1,067 · $89/mo
- Expected delta
- +$387/yr (+$32/mo · 57.0%)
ⓘ Screening estimate from a state-policy table — verify with the county assessor before closing.
Climate risk First Street
- Flood 6/10 Major FEMA zone X (unshaded) · 71% chance over 30 yrs
- Wildfire 5/10 Major
- Heat 4/10 Moderate 7 d/yr ≥91°F today · 16 d/yr by 30 yrs out
- Wind 1/10 Low
- Air quality 10/10 Extreme 11 unhealthy d/yr today · 13 by 30 yrs out
Nearby sold comps map
Loading sold comps map…
Walkable amenities ~0.75 mi
Loading nearby amenities…
Taxation est. · year 1
- Rental income
- $22,867
- − Mortgage interest
- −$6,162
- − Property taxes
- −$680
- − Insurance
- −$550
- − Repairs & maintenance
- −$1,829
- − Management
- −$1,829
- − Depreciation
- −$3,200
- Taxable income
- $8,617
- Est. tax owed @ 24.0%
- −$2,068
- After-tax cash flow
- $7,845/yr
For passive investors: Depreciation is non-cash, so a rental often shows a tax loss while cash-flowing — sheltering income. Rental losses are passive: they offset passive income freely, and up to $25,000/yr can offset ordinary (W-2) income if you actively participate and your MAGI is under $100k (phasing out to $0 by $150k); unused losses carry forward. On sale, claimed depreciation is recaptured at up to 25%, and gains may owe capital-gains tax (a 1031 exchange can defer both). Figures are a year-1 estimate at your 24.0% rate — not tax advice; consult a CPA.
Schools (NCES district)
- District
- Lebanon Community SD 9
- NCES district ID
- 4107380
- Math proficiency
- 27% ▼ -10.00%
- Reading proficiency
- 43% ▼ -4.00%
- Median HH income
- $45,264
- Composite
- 29.83/100
- National rank
- #6418
- State rank
- #26 of 58 in OR
Livability — Lebanon
- Score
- 71/100
- State rank
- #126
- US rank
- #7209
Category grades
Schools grade is shown separately in the Schools card above.
Census & demographics
- Census place
- Lebanon, OR
- County
- Linn County · 70,700 people
- City population
- 34,292
- Metro
- Albany-Lebanon, OR
- Population (ZIP)
- 34,292
- Household income
- $68,595
- Rent vs Own
- Severe rent burden
- 1051.0
Population outlook (Linn County) Hauer SSP2
- Today (2025)
- 127,026 people
- By 2030
- 129,540 · +2.0%
- By 2040
- 132,780 · +4.5%
- By 2050
- 133,614 · +5.2%
- By 2075
- 129,061 · +1.6%
- By 2100
- 112,224 · -11.7%
Race, ethnicity, and origin ACS 2023
- Neighborhood character
- Predominantly White (87%)
- Race & ethnicity
- White 87% Hispanic / Latino 7% Two or more races 7%
- Hispanic origin (detail)
- Mexican 6%
- Common ancestry
- Italian 5% Slovak 3% Portuguese 3%
- Foreign-born
- 4% · Canada
- Languages at home
- 93% English-only · Spanish 5% French/Haitian/Cajun 1%
Political lean MEDSL · Linn
- 2024 margin
- Strong R (+24.4) · D 36.2% · R 60.6% · Other 3.1%
- 2008→2024 swing
- -13.0pp toward R · 2008: -11.4pp · 2024: -24.4pp
- All cycles
- 2024: R+24.4 2020: R+23.4 2016: R+27.8 2012: R+17.2 2008: R+11.4
Not yet ingested
- Civics
- —
Market trends
- HPI YoY
- ▼ -528.42%
- Current HPI
- 221.8977
- Rent YoY
- ▲ 4.55%
- Metro
- Albany-Lebanon, OR
- State GDP YoY
- ▲ 2.05%
- F500 in state
- 2
Industry mix (Fortune 500 HQ in OR)
| Industry | F500 HQs | Revenue |
|---|---|---|
| Consumer Goods | 1 | $51B |
|
||
Price history
-12.0% since first listed3 events — show timeline
- 2026-05-30 Listing Removed — WVMLS
- 2026-05-16 Price Changed $110,000 WVMLS
- 2026-05-07 Listed $125,000 WVMLS
Property tax history
+6.4%/yrLatest (2025): $680 · +5.2% YoY. Source: county tax records.
Cash-flow waterfall
monthlySold comps — $/sqft
last 12 mo · ≤1 miLoading sold comps…