3541 Rain Forest Dr W · Jacksonville, FL
Flood risk 1/10 · Minimal
- FEMA flood zone
- X (unshaded)
- Chance of flooding over 30 yrs
- 0.0%
- Est. flood insurance / yr
- $507 – $1,088
Fire risk 3/10 · Minor
- Est. fire insurance / yr
- $947 – $1,759
Heat risk 10/10 · Severe
- Hot days now (above 106°F)
- 7 days/yr
- Hot days in 30 yrs
- 21 days/yr
Wind risk 9/10 · Severe
- Chance of severe wind over 30 yrs
- 99.0%
Air-quality risk 4/10 · Minor
- Unhealthy air days now
- 6 days/yr
- Unhealthy air days in 30 yrs
- 6 days/yr
Risk factors via First Street. Map © Google.
Why this score? — see what drove the D grade
The composite is a weighted blend of 9 inputs, each scored 0–100. Each bar is that input's sub-score; the figure is the points it added to the 100-point composite (weight × sub-score).
- Cash flow +12.4/30.0
- ARV discount +8.6/15.0
- Livability +4.2/5.0
- Schools +3.9/10.0
- DSCR +3.7/10.0
- Rent growth +3.0/5.0
- 1% rule +2.5/10.0
- Condition / age +2.5/5.0
- Appreciation +0.0/10.0
$205,000
🖨 Deal sheet 📄 Offer letter ✓ Due diligence
Listing remarks MLS
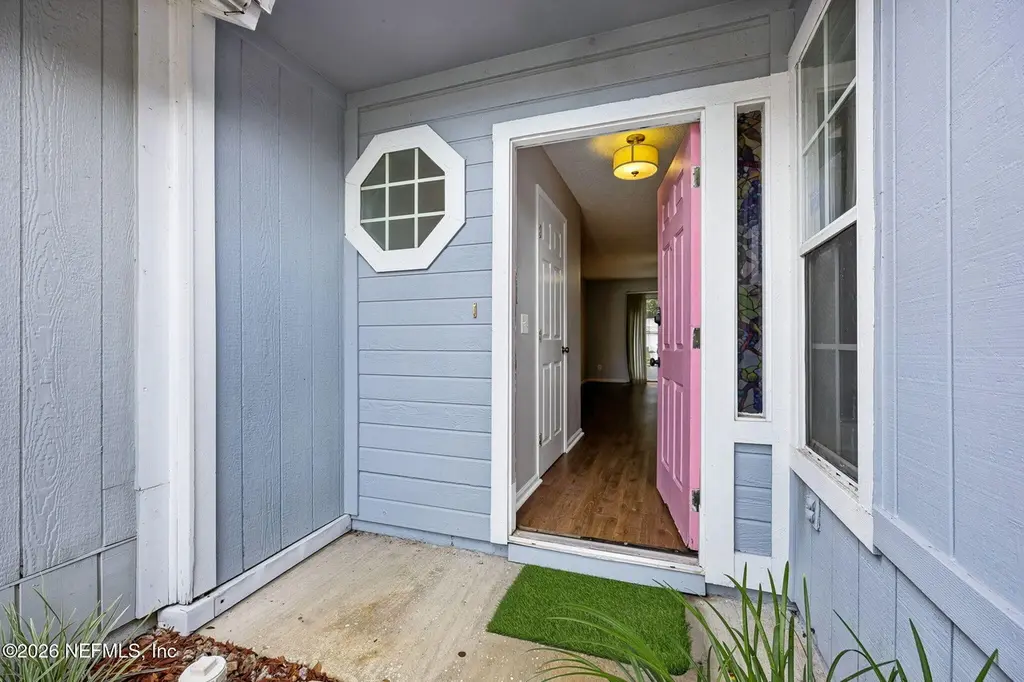
UPDATED TOWNHOME WITH NEW WOOD AND TILE FLOORING, METICULOUSLY MAINTAINED, NEW STOVE & NEWER FRIG, FRESHLY PAINTED, BOTH BEDROOMS UPSTAIRS, GREAT LOCATION, LOW HOMEOWNER ASSOC. FEES.
Key facts
- Attached garage
- $13 HOA
- Garage
Tags
Property features AI
Finance
- HOA & community: Homeowners association with an annual fee of $152.78; Not a senior community
Exterior
- Parking: Garage; 1-car garage
- Utilities: Public sewer; Cable available
- Home design: Townhouse; Two levels; Attached property
- Construction: Frame construction; Shingle roof
- Exterior features: Rear porch; Back yard fencing; Asphalt road access
Interior
- Kitchen: Dishwasher; Electric range; Refrigerator; Pantry; Breakfast bar; Eat-in kitchen
- Bedrooms: 2 bedrooms
- Flooring: Carpet; Laminate; Tile
- Bathrooms: 1 full bathroom; 1 half bathroom
- Heating & cooling: Central heating; Central air
- Interior features: Breakfast bar; Ceiling fan(s); Eat-in kitchen; Entrance foyer; Jack and Jill bathroom; Pantry; Primary bathroom with tub and shower; Vaulted ceiling(s); Walk-in closet(s)
- Laundry & utility: Washer hookup; Electric dryer hookup; Electric water heater
Neighborhood map
What this means for you Summary
Snapshot
- This is a 2-bed/3.0-bath townhouse listed at $205k.
Deal economics
- At list price, monthly cash flow is $-35 ($-424/yr) — negative.
- To cash-flow at today's rent, offer at most $199k (3.0% below list).
- To meet the 1% rule (rent ≥ 1% of price), the offer needs to be $153k (25.4% below list).
- Recommended offer: $153k (25.4% below list) — sets the bar for 1% rule.
- Cap rate 6.1% vs local median 4.0% in Jacksonville — top-decile yield for the area; either an underpriced asset or a hidden risk that comps aren't pricing in. Stress-test before assuming the spread holds.
Location & tenants
- Location reads 83/100 on livability (#50 in FL, #911 nationally) — a professional / high-income tenant draw. Strengths: amenities A+, commute A+, housing A+.
- Duval (urban): math 46% / reading 45% proficiency, ranked #48 of 73 in FL (top 66%) — families likely to look elsewhere, expect single-tenant / working-renter base with shorter leases.
- Market conditions: Rents rising (+1.9%/yr); 118 active listings in the ZIP; 27 comparable units currently listed for rent nearby; rentals at typical pace (median 15d on market — plan ~3-4 weeks tenant-placement turnaround); 6,503 units permitted in Duval County in 2024 (1,131 in 5+ unit buildings).
Forward outlook
- Local home prices are declining (-3.0%/yr); year-one equity from $1k of loan paydown is wiped out by about $6k of value loss. Plan a longer hold.
- Duval County population projected at +19% by 2050 — long-run rental-demand tailwind backs the buy-and-hold thesis.
Negotiation context
- It's been on market 16 days — a 2% lower offer ($202k) is reasonable based on typical stale-listing flexibility.
- 4 sale attempts since 23y ago with the ask held roughly flat each time — persistent listings suggest the price (not the market) is what's stuck; bring a comps-based counter.
- Current owner paid $99k; list at $205k implies a 108% gain — meaningful room to come down on a strong offer.
Risks & watch-outs
- Climate carrying-cost: severe wind risk, 99% chance of damaging wind over 30y; extreme-heat days projected 7→21/yr by 2055 (HVAC capex compounding) — expect insurance premiums to compound above CPI over the hold.
Questions for the listing agent
- What do current leases actually rent for vs. the listed asking? Can we see a recent rent roll and the last 12 months of T-12 income?
- What does the HOA fee cover, when was the last increase, and are there any pending special assessments or reserve-fund shortfalls?
- Is there a deadline driving the sale (1031 exchange, divorce, estate, relocation)? That informs how much negotiation room exists.
- Schools are B-rated — typically a magnet for longer-tenancy family renters. What's the average tenant stay here, and is there a school-zone premium baked into asking?
- The area grade is low — what's the realistic commute time and amenity access for the typical tenant pool here? Any planned neighborhood developments (good or bad) we should know about?
- What's the average days-on-market for RENTAL listings here right now (not sales)? A rising rental-DOM trend means longer vacancies and softer asking-rent achievability than the comps imply.
- What's the recent tenant-quality profile in this submarket — average credit score on applications, eviction rate, late-payment / NSF rate, and stable-employment percentage? A property-management company in the area should have these aggregated.
- How much new for-sale + rental construction is in the pipeline within 1–3 miles? Heavy new supply typically softens prices + rents 12–24 months out; constrained supply supports both.
Investment metrics
- 1% rule
- 0.75% ✗
- Cap rate
- 6.09%
- Cash-on-cash
- -0.74%
- DSCR
- 0.97
- GRM
- 11.2
CMA / ARV
- ARV (on-the-fly)
- $210,276
- Comps found
- 10
Show comp detail 10 sales within ~0.75 mi
| Address | Dist | Beds/Ba | Sqft | Sold | Price | $/sf | Match |
|---|---|---|---|---|---|---|---|
| 7604 Leafy Forest Way | 0.13mi | 2/2.0 | 1,182 (-0%) | 9mo | $193,900 | $164 | 82 |
| 7411 Colony Cove Ln | 0.13mi | 2/2.0 | 1,242 (+4%) | 11mo | $140,100 | $113 | 74 |
| 3541 Colony Cove Trl | 0.16mi | 2/2.0 | 1,254 (+6%) | 12mo | $218,000 | $174 | 69 |
| 7375 Colony Cove Ln | 0.13mi | 2/2.0 | 1,062 (-11%) | 5mo | $228,000 | $215 | 68 |
| 7462 Colony Cove Ln | 0.10mi | 2/2.0 | 1,062 (-11%) | 13mo | $235,000 | $221 | 63 |
| 3401 Townsend Blvd #313 | 0.21mi | 2/2.5 | 1,329 (+12%) | 7mo | $94,500 | $71 | 63 |
| 7324 Colony Cove Ln | 0.20mi | 3/2.0 (+1) | 1,236 (+4%) | 16mo | $229,900 | $186 | 62 |
| 7627 Rain Forest Dr N | 0.12mi | 2/2.0 | 1,079 (-9%) | 22mo | $185,000 | $171 | 57 |
| 7622 Hovering Mist Way | 0.08mi | 3/2.5 (+1) | 1,328 (+12%) | 20mo | $235,000 | $177 | 53 |
| 8024 Marseilles Dr | 0.56mi | 2/2.0 | 1,039 (-12%) | 11mo | $206,000 | $198 | 40 |
Match score weights: distance 35% · size 25% · config 20% · recency 20%. Top-matched comps best support the ARV.
Projected returns pro-forma
-3.0% appreciation · 1.94% rent growth · sell at horizon
- IRR
- -18.6%
- Equity multiple
- 0.35×
- Total profit
- $-37,167
- Equity at exit
- $30,566
- IRR
- -13.1%
- Equity multiple
- 0.27×
- Total profit
- $-42,085
- Equity at exit
- $17,725
Cash invested: $57,400 (down + closing). Projections, not guarantees.
Landlord ↔ Tenant lean methodology
- Overall (STATE)
- 87 Strongly Landlord-Friendly
- State Florida
- 87 Strongly Landlord-Friendly · R+3
- County
- — inherits STATE
- City
- — inherits STATE
ZIP-level market 32277
- Rents YoY
- 1.9%
- Active inventory
- 118
- Price-to-rent
- 11.2×
Monthly cashflow live
- Estimated rent
- $1,529 high interval (Pro) →
- Mortgage (P&I)
- −$1,075
- Tax from tax record
- −$70 /mo · $841/yr
- Insurance
- −$85
- HOA
- −$13
- Vacancy / Maint / Mgmt
- −$321
- Net cashflow
- $-35
Break-even live
UW: 25.0% down · 7.5% · 30yr · 1.5% tax · 5.0% vac · 8.0% maint · 8.0% mgmt
Financing live
Cash to close
- Down payment
- $51,250
- Closing costs
- $6,150
- Reserves months
- —
- Total cash needed
- —
Loan-product check · same deal, 3 products live
Conventional
25% down · 7.5% · 30yr
- Down + closing
- —
- Monthly P&I
- —
- Monthly cashflow
- —
- DSCR
- —
- Eligible?
- —
Personal DTI + credit; lowest rate.
DSCR
20% down · 8.5% · 30yr
- Down + closing
- —
- Monthly P&I
- —
- Monthly cashflow
- —
- DSCR
- —
- Eligible?
- —
No personal income docs; deal must DSCR.
Hard money
10% down · 12.0% · 12mo
- Down + closing
- —
- Monthly P&I
- —
- Monthly cashflow
- —
- DSCR
- —
- Eligible?
- —
Short-term bridge; refi at stabilization.
Rent comps 27 comps
| Address | Beds | Baths | Sqft | Rent | $/sqft | DOM | Units | Dist |
|---|---|---|---|---|---|---|---|---|
| 3501 Townsend Blvd Jacksonville, FL | 3.0 | 1.0–2.5 | 816 | $1,330 | $1.63 | 1d | 25 | 0.07mi |
| 7608 Rain Forest Dr N Jacksonville, FL | 3.0 | 2.0 | 1312 | $1,745 | $1.33 | 21d | 1 | 0.10mi |
| 3523 Colony Cove Trl W Jacksonville, FL | 2.0 | 2.0 | 1062 | $1,450 | $1.37 | 23d | 1 | 0.13mi |
| 3460 Net Ct Jacksonville, FL | 3.0 | 2.0 | 1292 | $1,869 | $1.45 | 3d | 1 | 0.14mi |
| 3545 Villa Pl Jacksonville, FL | 3.0 | 2.0 | 1386 | $1,695 | $1.22 | 23d | 1 | 0.16mi |
| 3544 Villa Pl Jacksonville, FL | 2.0 | 2.0 | 1086 | $1,400 | $1.29 | 23d | 1 | 0.19mi |
| 3450 Townsend Blvd Jacksonville, FL | 3.0 | 1.0–2.0 | 816 | $1,236 | $1.51 | 14d | 13 | 0.22mi |
| 7609 Tacony Dr Jacksonville, FL | 3.0 | 1.0 | 1176 | $1,450 | $1.23 | 4d | 1 | 0.48mi |
| 7609 Tacony Dr Jacksonville, FL | 3.0 | 1.0 | 1176 | $1,450 | $1.23 | 23d | 1 | 0.48mi |
| 7537 Dalehurst Dr S Jacksonville, FL | 3.0 | 2.0 | 1170 | $1,524 | $1.30 | 4d | 1 | 0.57mi |
| 2921 Mansion Rd Jacksonville, FL | 3.0 | 2.0 | 1450 | $1,845 | $1.27 | 23d | 1 | 0.68mi |
| 7027 Berrywood Ln Jacksonville, FL | 3.0 | 2.0 | 1247 | $1,875 | $1.50 | 23d | 1 | 0.78mi |
| 7716 Monetta Dr Jacksonville, FL | 3.0 | 2.0 | 1401 | $1,716 | $1.22 | 23d | 1 | 0.80mi |
| 3459 Rogero Rd Jacksonville, FL | 3.0 | 2.0 | 1322 | $1,695 | $1.28 | 23d | 1 | 0.90mi |
| 7925 Merrill Rd Jacksonville, FL | 1.0–3.0 | 1.0–2.0 | 1065 | $1,438 | $1.35 | 1d | 46 | 0.93mi |
| 8230 Dames Point Crossing Blvd N #1103 Jacksonville, FL | 2.0 | 2.5 | 1100 | $1,100 | $1.00 | 10d | 1 | 1.07mi |
| 8543 Fort Caroline Rd Jacksonville, FL | 3.0 | 1.0 | 957 | $1,800 | $1.88 | 23d | 1 | 1.08mi |
| 8291 Dames Point Crossing Blvd N Jacksonville, FL | 1.0 | 1.0 | 1017 | $1,395 | $1.37 | 1d | 1 | 1.15mi |
| 6111 Shetland Rd Jacksonville, FL | 3.0 | 2.0 | 1075 | $1,595 | $1.48 | 7d | 1 | 1.28mi |
| 7656 Arble Dr Jacksonville, FL | 2.0 | 1.5 | 1192 | $1,490 | $1.25 | 4d | 1 | 1.33mi |
| 7920 Merrill Rd Jacksonville, FL | 2.0–3.0 | 2.0 | 1048 | $1,200 | $1.14 | 7d | 4 | 1.33mi |
| 7920 Merrill Rd Jacksonville, FL | 2.0–3.0 | 2.0 | 1048 | $1,100 | $1.05 | 17d | 5 | 1.33mi |
| 7920 Merrill Rd Jacksonville, FL | 2.0–3.0 | 2.0 | 1048 | $1,250 | $1.19 | 1d | 3 | 1.33mi |
| 3517 Peeler Rd #23 Jacksonville, FL | 2.0 | 1.5 | 1139 | $1,195 | $1.05 | 7d | 1 | 1.33mi |
| 6308 Merrill Rd Jacksonville, FL | 3.0 | 2.0 | 1292 | $1,585 | $1.23 | 7d | 1 | 1.35mi |
| 2328 Caladium Rd Jacksonville, FL | 3.0 | 2.0 | 1425 | $1,595 | $1.12 | 23d | 1 | 1.49mi |
| 6055 Carolines Ct Jacksonville, FL | 3.0 | 2.5 | 1382 | $1,598 | $1.16 | 19d | 1 | 1.49mi |
HOA detail
- Monthly dues
- $13 · $156/yr
Listing history 12 events
-
2026-06-18days on market $205,000 Active 16 DOM
-
2026-06-17days on market $205,000 Active 15 DOM
-
2026-06-16days on market $205,000 Active 14 DOM
-
2026-06-15days on market $205,000 Active 13 DOM
-
2026-06-13days on market $205,000 Active 11 DOM
-
2026-06-13days on market $205,000 Active 10 DOM
-
2026-06-10days on market $205,000 Active 7 DOM
-
2026-06-08days on market $205,000 Active 6 DOM
-
2026-06-07days on market $205,000 Active 5 DOM
-
2026-06-05days on market $205,000 Active 2 DOM
-
2026-06-02remarks 699-char remark
-
2026-06-02$205,000 Active 1 DOM
ⓘ Source: listings_history table (triggers on properties + properties_extension) + one-shot
backfill from property_details.listing_events for pre-trigger history.
Tax reassessment forecast FL · Resets to sale price
- Current annual tax
- $841 · $70/mo
- Projected year-2 tax
- $1,702 · $142/mo
- Expected delta
- +$860/yr (+$72/mo · 102.3%)
ⓘ Screening estimate from a state-policy table — verify with the county assessor before closing.
Climate risk First Street
- Flood 1/10 Low FEMA zone X (unshaded) · 0% chance over 30 yrs
- Wildfire 3/10 Moderate
- Heat 10/10 Extreme 7 d/yr ≥106°F today · 21 d/yr by 30 yrs out
- Wind 9/10 Extreme 99% chance of damaging wind over 30 yrs
- Air quality 4/10 Moderate 6 unhealthy d/yr today · 6 by 30 yrs out
Nearby sold comps map
Loading sold comps map…
Walkable amenities ~0.75 mi
Loading nearby amenities…
Taxation est. · year 1
- Rental income
- $18,353
- − Mortgage interest
- −$11,483
- − Property taxes
- −$841
- − Insurance
- −$1,025
- − Repairs & maintenance
- −$1,468
- − Management
- −$1,468
- − HOA
- −$156
- − Depreciation
- −$5,964
- Taxable loss
- −$4,053
- Est. tax savings @ 24.0%
- +$973
- After-tax cash flow
- $549/yr
For passive investors: Depreciation is non-cash, so a rental often shows a tax loss while cash-flowing — sheltering income. Rental losses are passive: they offset passive income freely, and up to $25,000/yr can offset ordinary (W-2) income if you actively participate and your MAGI is under $100k (phasing out to $0 by $150k); unused losses carry forward. On sale, claimed depreciation is recaptured at up to 25%, and gains may owe capital-gains tax (a 1031 exchange can defer both). Figures are a year-1 estimate at your 24.0% rate — not tax advice; consult a CPA.
Schools (NCES district)
- District
- Duval
- NCES district ID
- 1200480
- Math proficiency
- 46% ▼ -11.00%
- Reading proficiency
- 45% ▼ -4.00%
- Median HH income
- $48,987
- Composite
- 38.97/100
- National rank
- #4076
- State rank
- #48 of 73 in FL
Livability — Jacksonville
- Score
- 83/100
- State rank
- #50
- US rank
- #911
Category grades
Schools grade is shown separately in the Schools card above.
Census & demographics
- Census place
- Jacksonville, FL
- County
- Duval County · 1,015,274 people
- City population
- 979,034
- Metro
- Jacksonville, FL
- Population (ZIP)
- 36,338
- Household income
- $61,554
- Rent vs Own
- Severe rent burden
- 2550.0
Population outlook (Duval County) Hauer SSP2
- Today (2025)
- 1,013,010 people
- By 2030
- 1,059,228 · +4.6%
- By 2040
- 1,141,439 · +12.7%
- By 2050
- 1,205,258 · +19.0%
- By 2075
- 1,324,282 · +30.7%
- By 2100
- 1,319,620 · +30.3%
Race, ethnicity, and origin ACS 2023
- Neighborhood character
- Diverse neighborhood (Simpson 0.68)
- Race & ethnicity
- White 41% Black 36% Hispanic / Latino 16% Two or more races 10% Asian 3%
- Hispanic origin (detail)
- Mexican 1% Puerto Rican 7% Cuban 4%
- Common ancestry
- Hispanic 5% Slovak 2% Lithuanian 1%
- Foreign-born
- 15% · Canada, Jamaica, Vietnam
- Languages at home
- 80% English-only · Spanish 10% French/Haitian/Cajun 4% Russian/Polish/Slavic 2%
Political lean MEDSL · Duval
- 2024 margin
- Toss-up / Even · D 48.7% · R 50.1% · Other 1.2%
- 2008→2024 swing
- +0.4pp no change · 2008: -1.9pp · 2024: -1.5pp
- All cycles
- 2024: R+1.5 2020: D+3.8 2016: R+1.5 2012: R+3.6 2008: R+1.9
Not yet ingested
- Civics
- —
Market trends
- HPI YoY
- ▼ -180.79%
- Current HPI
- 289.4062
- Rent YoY
- ▲ 1.94%
- Metro
- Jacksonville, FL
- State GDP YoY
- ▲ 3.28%
- F500 in state
- 36
Industry mix (Fortune 500 HQ in FL)
| Industry | F500 HQs | Revenue |
|---|---|---|
| Industrial Technology | 2 | $29B |
|
||
| Insurance | 2 | $17B |
|
||
| Retail | 1 | $60B |
|
||
| Technology Distribution | 1 | $58B |
|
||
| Homebuilding | 1 | $35B |
|
||
| Technology Manufacturing | 1 | $35B |
|
||
Price history
+262.8% since first listed15 events — show timeline
- 2026-06-02 Listed $205,000 realMLS
- 2009-12-15 Sold (Public Records) $98,700 Public Records
- 2009-11-27 Listing Removed — realMLS
- 2009-11-25 Sold (MLS) $98,640 realMLS
- 2009-05-30 Listed $95,000 realMLS
- 2007-10-04 Sold (Public Records) $132,500 Public Records
- 2007-10-01 Listing Removed — realMLS
- 2007-09-24 Sold (MLS) $132,500 realMLS
- 2007-07-16 Listed $139,500 realMLS
- 2003-06-02 Sold (Public Records) $87,000 Public Records
- 2003-05-15 Sold (MLS) $87,000 realMLS
- 2003-04-09 Listed $89,900 realMLS
- 2000-03-14 Sold (Public Records) $63,900 Public Records
- 1997-07-25 Sold (Public Records) $47,000 Public Records
- 1994-09-07 Sold (Public Records) $56,500 Public Records
Property tax history
+3.4%/yrLatest (2025): $841 · +27.1% YoY. Source: county tax records.
Cash-flow waterfall
monthlySold comps — $/sqft
last 12 mo · ≤1 miLoading sold comps…