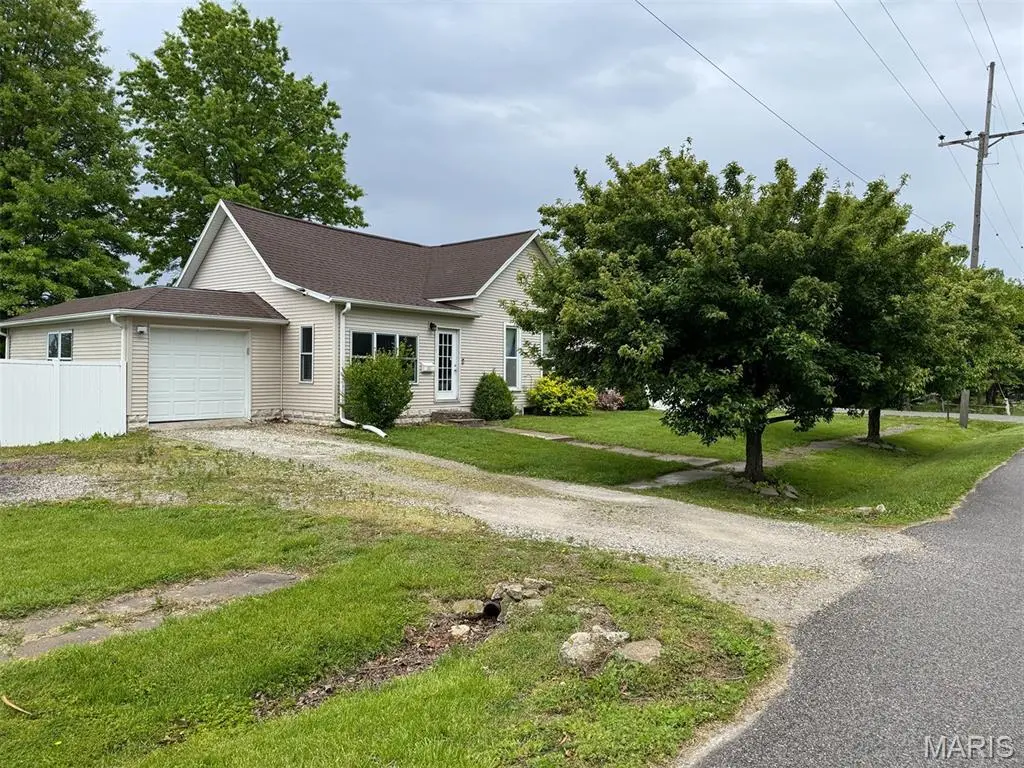
267 Montgomery St · Kahoka, MO
Flood risk 1/10 · Minimal
- FEMA flood zone
- X (unshaded)
- Chance of flooding over 30 yrs
- 0.0%
- Est. flood insurance / yr
- $473 – $860
Fire risk 2/10 · Minimal
- Est. fire insurance / yr
- $1,054 – $1,958
Heat risk 3/10 · Minor
- Hot days now (above 106°F)
- 7 days/yr
- Hot days in 30 yrs
- 16 days/yr
Wind risk 2/10 · Minimal
- Chance of severe wind over 30 yrs
- 0.0%
Air-quality risk 2/10 · Minimal
- Unhealthy air days now
- 2 days/yr
- Unhealthy air days in 30 yrs
- 2 days/yr
Risk factors via First Street. Map © Google.
Why this score? — see what drove the F grade
The composite is a weighted blend of 9 inputs, each scored 0–100. Each bar is that input's sub-score; the figure is the points it added to the 100-point composite (weight × sub-score).
- Cash flow +11.1/30.0
- Appreciation +7.6/10.0
- Livability +3.3/5.0
- DSCR +3.2/10.0
- Schools +2.6/10.0
- Rent growth +2.5/5.0
- Condition / age +2.5/5.0
- 1% rule +1.9/10.0
- ARV discount +0.0/15.0
$165,000
🖨 Deal sheet 📄 Offer letter ✓ Due diligence
Listing remarks
This move-in-ready 3-bedroom, 2-bath ranch home offers comfortable single-level living with modern living features throughout. The home includes a spacious, modern kitchen with all appliances included, making it turnkey for the next owner. A dedicated office space provides flexibility for remote work, studying, or hobbies. An attached garage adds everyday convenience, while the very large, private, fully fenced backyard offers exceptional outdoor space ideal for entertaining, pets, or relaxing in privacy. Conveniently located within walking distance of Clark County High School, this property blends functionality, comfort, and an excellent location.
Key facts
- Attached garage
- Modern kitchen
- 0.32 acre lot
Tags
Property features AI
Finance
- Other: Property located at 267 Montgomery St, Kahoka, MO 63445
Exterior
- Parking: Attached garage with space for 1 car
- Utilities: Public water; Public sewer; Electricity (220 volts); Natural gas connected
- Home design: Single-family residence; One level
- Construction: Vinyl siding
- Exterior features: City lot
Interior
- Bedrooms: Three bedrooms on the main level
- Bathrooms: Two full bathrooms (both on the main level)
- Interior features: Central air conditioning; Natural gas heating
Neighborhood map
What this means for you Summary
Snapshot
- This is a 3-bed/2.0-bath single-family listed at $165k.
Deal economics
- At list price, monthly cash flow is $-67 ($-799/yr) — negative.
- To cash-flow at today's rent, offer at most $153k (7.1% below list).
- To meet the 1% rule (rent ≥ 1% of price), the offer needs to be $113k (31.3% below list).
- Recommended offer: $113k (31.3% below list) — sets the bar for 1% rule.
Location & tenants
- Location reads 66/100 on livability (#236 in MO) — a middle-class / working-renter tenant base. Strengths: cost of living A+, crime B+, housing B+; Watch: health & safety C-, employment D, amenities F.
- Clark County R-I (rural): math 29% / reading 32% proficiency, ranked #268 of 324 in MO (top 83%) — families likely to look elsewhere, expect single-tenant / working-renter base with shorter leases.
- Zoned schools: Black Hawk Elem. (math 32% / reading 27%, grade F, #813 of 1,115 statewide, top 75%, 365 students, 56% FRL); Clark Co. High (math 27% / reading 42%, grade F, #321 of 521 statewide, top 67%, 308 students, 46% FRL).
- Market conditions: 8 active listings in the ZIP; 2 units permitted in Clark County in 2024 (0 in 5+ unit buildings).
Forward outlook
- In year one you build about $10k of equity ($1k loan paydown + $9k appreciation (5.2% local appreciation)).
- Clark County population projected at -26% by 2050 — secular population decline; favor cash flow + early exit over multi-decade hold.
- At projected returns (5.2% appreciation + 3.0% rent growth), your $46k cash investment doubles in ~5 years — after that, you're playing with house money.
- By year 4, paydown + projected appreciation supports a ~$33k cash-out refi (75% LTV) — recoverable capital for the next deal without selling this one.
Negotiation context
- Only 4 days on market — expect competitive offers; lowballing is unlikely to land.
- 2 sale attempts with the ask held roughly flat each time — persistent listings suggest the price (not the market) is what's stuck; bring a comps-based counter.
Risks & watch-outs
- Watch-outs: built in 1930 — expect roof / HVAC / electrical / plumbing capex.
Questions for the listing agent
- What do current leases actually rent for vs. the listed asking? Can we see a recent rent roll and the last 12 months of T-12 income?
- Built in 1930 — when were the roof, HVAC, electrical panel, plumbing, and water heater last replaced?
- Is there a deadline driving the sale (1031 exchange, divorce, estate, relocation)? That informs how much negotiation room exists.
- The area grade is low — what's the realistic commute time and amenity access for the typical tenant pool here? Any planned neighborhood developments (good or bad) we should know about?
- What's the average days-on-market for RENTAL listings here right now (not sales)? A rising rental-DOM trend means longer vacancies and softer asking-rent achievability than the comps imply.
- What's the recent tenant-quality profile in this submarket — average credit score on applications, eviction rate, late-payment / NSF rate, and stable-employment percentage? A property-management company in the area should have these aggregated.
- How much new for-sale + rental construction is in the pipeline within 1–3 miles? Heavy new supply typically softens prices + rents 12–24 months out; constrained supply supports both.
Investment metrics
- 1% rule
- 0.69% ✗
- Cap rate
- 5.81%
- Cash-on-cash
- -1.73%
- DSCR
- 0.92
- GRM
- 12.1
CMA / ARV
- ARV (on-the-fly)
- $124,800
- Comps found
- 1
Show comp detail 1 sale within ~0.75 mi
| Address | Dist | Beds/Ba | Sqft | Sold | Price | $/sf | Match |
|---|---|---|---|---|---|---|---|
| 404 W Thompson St | 0.44mi | 2/1.0 (-1) | 1,400 (-12%) | 1mo | $109,000 | $78 | 49 |
Match score weights: distance 35% · size 25% · config 20% · recency 20%. Top-matched comps best support the ARV.
Projected returns pro-forma
5.17% appreciation · 3.0% rent growth · sell at horizon
- IRR
- 11.8%
- Equity multiple
- 1.76×
- Total profit
- $35,342
- Equity at exit
- $95,255
- IRR
- 12.9%
- Equity multiple
- 3.37×
- Total profit
- $109,608
- Equity at exit
- $165,864
Cash invested: $46,200 (down + closing). Projections, not guarantees.
Landlord ↔ Tenant lean methodology
- Overall (STATE)
- 81 Strongly Landlord-Friendly
- State Missouri
- 81 Strongly Landlord-Friendly · R+10
- County
- — inherits STATE
- City
- — inherits STATE
ZIP-level market 63445
- Home prices YoY
- 4.9%
- Active inventory
- 8
- Price-to-rent
- 12.1×
Monthly cashflow live
- Estimated rent
- $1,133 medium interval (Pro) →
- Mortgage (P&I)
- −$865
- Tax from tax record
- −$28 /mo · $334/yr
- Insurance
- −$69
- HOA
- −$0
- Vacancy / Maint / Mgmt
- −$238
- Net cashflow
- $-67
Break-even live
UW: 25.0% down · 7.5% · 30yr · 1.5% tax · 5.0% vac · 8.0% maint · 8.0% mgmt
Financing live
Cash to close
- Down payment
- $41,250
- Closing costs
- $4,950
- Reserves months
- —
- Total cash needed
- —
Loan-product check · same deal, 3 products live
Conventional
25% down · 7.5% · 30yr
- Down + closing
- —
- Monthly P&I
- —
- Monthly cashflow
- —
- DSCR
- —
- Eligible?
- —
Personal DTI + credit; lowest rate.
DSCR
20% down · 8.5% · 30yr
- Down + closing
- —
- Monthly P&I
- —
- Monthly cashflow
- —
- DSCR
- —
- Eligible?
- —
No personal income docs; deal must DSCR.
Hard money
10% down · 12.0% · 12mo
- Down + closing
- —
- Monthly P&I
- —
- Monthly cashflow
- —
- DSCR
- —
- Eligible?
- —
Short-term bridge; refi at stabilization.
Listing history 4 events
-
2026-05-18status Pending
-
2026-05-16status Active
-
2026-05-14status Pending
-
2026-05-12$165,000 Active
ⓘ Source: listings_history table (triggers on properties + properties_extension) + one-shot
backfill from property_details.listing_events for pre-trigger history.
Tax reassessment forecast MO · Resets to sale price
- Current annual tax
- $334 · $28/mo
- Projected year-2 tax
- $1,600 · $133/mo
- Expected delta
- +$1,267/yr (+$106/mo · 379.6%)
ⓘ Screening estimate from a state-policy table — verify with the county assessor before closing.
Climate risk First Street
- Flood 1/10 Low FEMA zone X (unshaded) · 0% chance over 30 yrs
- Wildfire 2/10 Low
- Heat 3/10 Moderate 7 d/yr ≥106°F today · 16 d/yr by 30 yrs out
- Wind 2/10 Low 0% chance of damaging wind over 30 yrs
- Air quality 2/10 Low 2 unhealthy d/yr today · 2 by 30 yrs out
Nearby sold comps map
Loading sold comps map…
Walkable amenities ~0.75 mi
Loading nearby amenities…
Taxation est. · year 1
- Rental income
- $13,599
- − Mortgage interest
- −$9,243
- − Property taxes
- −$334
- − Insurance
- −$825
- − Repairs & maintenance
- −$1,088
- − Management
- −$1,088
- − Depreciation
- −$4,800
- Taxable loss
- −$3,778
- Est. tax savings @ 24.0%
- +$907
- After-tax cash flow
- $108/yr
For passive investors: Depreciation is non-cash, so a rental often shows a tax loss while cash-flowing — sheltering income. Rental losses are passive: they offset passive income freely, and up to $25,000/yr can offset ordinary (W-2) income if you actively participate and your MAGI is under $100k (phasing out to $0 by $150k); unused losses carry forward. On sale, claimed depreciation is recaptured at up to 25%, and gains may owe capital-gains tax (a 1031 exchange can defer both). Figures are a year-1 estimate at your 24.0% rate — not tax advice; consult a CPA.
Schools (NCES district)
- District
- Clark County R-I
- NCES district ID
- 2916380
- Math proficiency
- 29% ▼ -8.00%
- Reading proficiency
- 32% ▼ -11.00%
- Median HH income
- $41,836
- Composite
- 25.83/100
- National rank
- #7355
- State rank
- #268 of 324 in MO
Livability — Kahoka
- Score
- 66/100
- State rank
- #236
- US rank
- #11503
Category grades
Schools grade is shown separately in the Schools card above.
Census & demographics
- Census place
- Kahoka, MO
- Population (ZIP)
- 3,945
Population outlook (Clark County) Hauer SSP2
- Today (2025)
- 6,211 people
- By 2030
- 5,858 · -5.7%
- By 2040
- 5,211 · -16.1%
- By 2050
- 4,620 · -25.6%
- By 2075
- 3,595 · -42.1%
- By 2100
- 2,927 · -52.9%
Race, ethnicity, and origin ACS 2023
- Neighborhood character
- Predominantly White (97%)
- Race & ethnicity
- White 97% Two or more races 2%
- Common ancestry
- Iranian 3% Lithuanian 2% Portuguese 2%
- Foreign-born
- 0%
Political lean MEDSL · Clark
- 2024 margin
- Solid R (+61.5) · D 18.8% · R 80.4%
- 2008→2024 swing
- -55.5pp toward R · 2008: -6.1pp · 2024: -61.5pp
- All cycles
- 2024: R+61.5 2020: R+58.8 2016: R+52.3 2012: R+10.3 2008: R+6.1
Not yet ingested
- Civics
- —
Market trends
- HPI YoY
- ▲ 5.17%
- Current HPI
- 111.3571
- Rent YoY
- —
- Metro
- —
- State GDP YoY
- ▲ 1.84%
- F500 in state
- 20
Industry mix (Fortune 500 HQ in MO)
| Industry | F500 HQs | Revenue |
|---|---|---|
| Healthcare | 1 | $163B |
|
||
| Insurance | 1 | $21B |
|
||
| Industrial Technology | 1 | $17B |
|
||
| Retail | 1 | $16B |
|
||
| Industrial Distribution | 1 | $10B |
|
||
| Utilities | 1 | $9B |
|
||
Price history
4 events — show timeline
- 2026-05-18 Pending — MARIS as Distributed by MLS Grid
- 2026-05-16 Relisted — MARIS as Distributed by MLS Grid
- 2026-05-14 Pending — MARIS as Distributed by MLS Grid
- 2026-05-12 Listed $165,000 MARIS as Distributed by MLS Grid
Property tax history
+2.4%/yrLatest (2025): $334 · +15.3% YoY. Source: county tax records.
Cash-flow waterfall
monthlySold comps — $/sqft
last 12 mo · ≤1 miLoading sold comps…