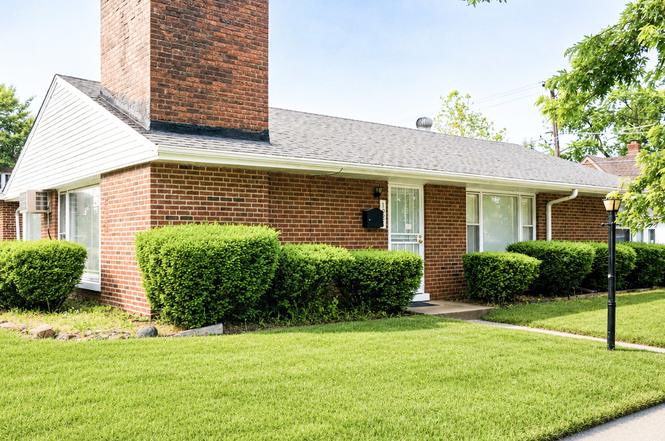
1021 Wentworth Ave · Calumet City, IL
Flood risk 1/10 · Minimal
- FEMA flood zone
- X (unshaded)
- Chance of flooding over 30 yrs
- 0.0%
- Est. flood insurance / yr
- $473 – $860
Fire risk 1/10 · Minimal
- Est. fire insurance / yr
- $804 – $1,492
Heat risk 3/10 · Minor
- Hot days now (above 102°F)
- 7 days/yr
- Hot days in 30 yrs
- 15 days/yr
Wind risk 2/10 · Minimal
- Chance of severe wind over 30 yrs
- 0.0%
Air-quality risk 4/10 · Minor
- Unhealthy air days now
- 5 days/yr
- Unhealthy air days in 30 yrs
- 6 days/yr
Risk factors via First Street. Map © Google.
Why this score? — see what drove the F grade
The composite is a weighted blend of 9 inputs, each scored 0–100. Each bar is that input's sub-score; the figure is the points it added to the 100-point composite (weight × sub-score).
- Cash flow +8.1/30.0
- 1% rule +5.6/10.0
- ARV discount +5.2/15.0
- Rent growth +4.0/5.0
- Livability +3.6/5.0
- Condition / age +2.5/5.0
- DSCR +2.2/10.0
- Schools +1.0/10.0
- Appreciation +0.0/10.0
$189,900
🖨 Deal sheet 📄 Offer letter ✓ Due diligence
Listing remarks MLS
BEAUTIFUL RANCH HOME! 3 BEDS ~ 2 BATHS~ HEATED FLOORS ~ ATTACHED 2 CAR GARAGE ~ HIGH CEILING BEAMED FAMILY ROOM ~ FIREPLACE ~ IN UNIT WASHER AND DRYER HOOK UP ~ NEW FLOORING ~ ON A QUIET BLOCK. SCHEDULE YOUR SHOWING TODAY!!
Key facts
- Updated flooring
- Single-level living
- Corner lot
Tags
Property features AI
Finance
- Other: Living area source: assessor; Some photos are virtually staged
- HOA & community: No master association fee required
Exterior
- Parking: Attached garage (owned) with space for 2 cars; Additional driveway parking for a total of 4 parking spaces; Concrete driveway
- Utilities: Water supplied by Lake Michigan and public system; Public sewer
- Home design: Detached single-family home; One-story; Fee simple ownership; Built before 1978 (approximately 71–80 years old); Brick construction
- Construction: Brick exterior; Shallow age range: 71–80 years; Not rebuilt or rehabilitated
- Exterior features: Lot dimensions approximately 30 x 125; Lot smaller than 0.25 acre; Corner lot location (implied by directions)
Interior
- Kitchen: Kitchen on the main level with wood laminate flooring
- Bedrooms: Three bedrooms (all on the main level) — master bedroom on the main level
- Flooring: Laminate flooring; Carpet; Wood laminate in living areas and kitchen; Ceramic tile in family room
- Bathrooms: One full bath; One half bath
- Heating & cooling: Electric heating with radiant and radiant floor components; Wall-mounted cooling units
- Interior features: Beamed ceilings; Seven total rooms; Wood-burning fireplace in the living room
- Laundry & utility: Main-level laundry located in the kitchen with electric dryer hookup
Neighborhood map
What this means for you Summary
Snapshot
- This is a 3-bed/1.5-bath single-family listed at $190k.
Deal economics
- At list price, monthly cash flow is $-183 ($-2k/yr) — negative.
- To cash-flow at today's rent, offer at most $166k (12.6% below list).
- Meets the 1% rule at list price ($2k rent vs $190k).
- Recommended offer: $166k (12.6% below list) — sets the bar for cash-flow.
- Cap rate 5.1% vs local median 8.2% in Calumet City — below-typical yield; the buyer is paying a premium for something (appreciation thesis, condition, location) that the cap rate doesn't capture.
Location & tenants
- Location reads 71/100 on livability (#330 in IL) — a middle-class / working-renter tenant base. Strengths: commute A+, cost of living A+, housing A+; Watch: employment C-, schools F, crime D-.
- Thornton Fractional Twp Hsd 215 (suburban): math 9% / reading 13% proficiency, ranked #563 of 620 in IL (top 91%) — low school quality limits family demand, transient renter base, plan for 1-2y turnover.
- Market conditions: Rents rising fast (+6.2%/yr); 198 active listings in the ZIP; 6 comparable units currently listed for rent nearby; rentals leasing fast (median 8d on market — plan ~1-2 weeks tenant-placement turnaround); 6,272 units permitted in Cook County in 2024 (4,658 in 5+ unit buildings).
- This rent runs 43% of the median local income ($55k/yr) — at the standard rent-burdened threshold; future hikes will face affordability resistance.
Forward outlook
- Local home prices are declining (-3.0%/yr); year-one equity from $1k of loan paydown is wiped out by about $6k of value loss. Plan a longer hold.
Negotiation context
- Only 3 days on market — expect competitive offers; lowballing is unlikely to land.
- 12 sale attempts since 14y ago with the ask held roughly flat each time — persistent listings suggest the price (not the market) is what's stuck; bring a comps-based counter.
- Current owner paid $140k; 36% above their basis — modest negotiation headroom, anchor on the comps not their cost.
Risks & watch-outs
- Watch-outs: property tax is 4.4% of price; built in 1951 — expect roof / HVAC / electrical / plumbing capex.
Questions for the listing agent
- What do current leases actually rent for vs. the listed asking? Can we see a recent rent roll and the last 12 months of T-12 income?
- Built in 1951 — when were the roof, HVAC, electrical panel, plumbing, and water heater last replaced?
- Property tax is high relative to price — has the assessment been appealed recently, and will the sale trigger a re-assessment?
- Is there a deadline driving the sale (1031 exchange, divorce, estate, relocation)? That informs how much negotiation room exists.
- Schools are F-rated, which usually means shorter tenancies and higher turnover. Who's the typical renter profile here, and what's been the actual vacancy rate?
- Crime grade is D in this area — have there been break-ins, vandalism, or insurance claims at this property in the last 3 years? What carrier currently insures it and at what premium?
- The area grade is low — what's the realistic commute time and amenity access for the typical tenant pool here? Any planned neighborhood developments (good or bad) we should know about?
- What's the average days-on-market for RENTAL listings here right now (not sales)? A rising rental-DOM trend means longer vacancies and softer asking-rent achievability than the comps imply.
- What's the recent tenant-quality profile in this submarket — average credit score on applications, eviction rate, late-payment / NSF rate, and stable-employment percentage? A property-management company in the area should have these aggregated.
- How much new for-sale + rental construction is in the pipeline within 1–3 miles? Heavy new supply typically softens prices + rents 12–24 months out; constrained supply supports both.
Investment metrics
- 1% rule
- 1.06% ✓
- Cap rate
- 5.14%
- Cash-on-cash
- -4.13%
- DSCR
- 0.82
- GRM
- 7.9
CMA / ARV
- ARV (on-the-fly)
- $180,690
- Comps found
- 12
Show comp detail 12 sales within ~0.75 mi
| Address | Dist | Beds/Ba | Sqft | Sold | Price | $/sf | Match |
|---|---|---|---|---|---|---|---|
| 131 Detroit St | 0.09mi | 2/1.5 (-1) | 1,527 (-4%) | 2mo | $175,000 | $115 | 82 |
| 106 Elizabeth St | 0.10mi | 3/1.5 | 1,507 (-5%) | 7mo | $172,250 | $114 | 81 |
| 122 Elizabeth St | 0.08mi | 3/1.0 | 1,686 (+6%) | 5mo | $164,000 | $97 | 80 |
| 37 Waltham St | 0.16mi | 4/2.0 (+1) | 1,559 (-2%) | 11mo | $239,000 | $153 | 74 |
| 106 Forestdale Pkwy | 0.14mi | 4/3.0 (+1) | 1,519 (-4%) | 6mo | $126,500 | $83 | 70 |
| 42 Detroit St | 0.33mi | 3/1.5 | 1,724 (+9%) | 2mo | $103,000 | $60 | 68 |
| 207 156th Pl | 0.46mi | 4/2.5 (+1) | 1,625 (+2%) | 3mo | $200,000 | $123 | 63 |
| 4 Warren St | 0.36mi | 4/1.0 (+1) | 1,775 (+12%) | 7mo | $145,000 | $82 | 50 |
| 425 Webb St | 0.48mi | 3/1.0 | 1,400 (-12%) | 12mo | $175,000 | $125 | 46 |
| 1234 Price Ave | 0.52mi | 4/2.0 (+1) | 1,746 (+10%) | 12mo | $219,900 | $126 | 42 |
| 802 State Line Rd | 0.49mi | 4/3.0 (+1) | 1,400 (-12%) | 9mo | $85,000 | $61 | 39 |
| 1304 Price Ave | 0.65mi | 2/2.0 (-1) | 1,800 (+14%) | 10mo | $85,000 | $47 | 32 |
Match score weights: distance 35% · size 25% · config 20% · recency 20%. Top-matched comps best support the ARV.
Projected returns pro-forma
-3.0% appreciation · 6.17% rent growth · sell at horizon
- IRR
- -18.3%
- Equity multiple
- 0.33×
- Total profit
- $-35,530
- Equity at exit
- $28,315
- IRR
- -3.8%
- Equity multiple
- 0.70×
- Total profit
- $-15,814
- Equity at exit
- $16,419
Cash invested: $53,172 (down + closing). Projections, not guarantees.
Landlord ↔ Tenant lean methodology
- Overall (STATE)
- 43 Moderately Tenant-Leaning
- State Illinois
- 43 Moderately Tenant-Leaning · D+7
- County
- — inherits STATE
- City
- — inherits STATE
ZIP-level market 60409
- Home prices YoY
- -27.6%
- Rents YoY
- 6.2%
- Active inventory
- 198
- Price-to-rent
- 7.9×
Monthly cashflow live
- Estimated rent
- $2,004 high interval (Pro) →
- Mortgage (P&I)
- −$996
- Tax from tax record
- −$691 /mo · $8,296/yr
- Insurance
- −$79
- HOA
- −$0
- Vacancy / Maint / Mgmt
- −$421
- Net cashflow
- $-183
Break-even live
UW: 25.0% down · 7.5% · 30yr · 1.5% tax · 5.0% vac · 8.0% maint · 8.0% mgmt
Financing live
Cash to close
- Down payment
- $47,475
- Closing costs
- $5,697
- Reserves months
- —
- Total cash needed
- —
Loan-product check · same deal, 3 products live
Conventional
25% down · 7.5% · 30yr
- Down + closing
- —
- Monthly P&I
- —
- Monthly cashflow
- —
- DSCR
- —
- Eligible?
- —
Personal DTI + credit; lowest rate.
DSCR
20% down · 8.5% · 30yr
- Down + closing
- —
- Monthly P&I
- —
- Monthly cashflow
- —
- DSCR
- —
- Eligible?
- —
No personal income docs; deal must DSCR.
Hard money
10% down · 12.0% · 12mo
- Down + closing
- —
- Monthly P&I
- —
- Monthly cashflow
- —
- DSCR
- —
- Eligible?
- —
Short-term bridge; refi at stabilization.
Rent comps 6 comps
| Address | Beds | Baths | Sqft | Rent | $/sqft | DOM | Units | Dist |
|---|---|---|---|---|---|---|---|---|
| 34 Elizabeth St Calumet City, IL | 3.0 | 1.0 | 1246 | $2,400 | $1.93 | 1d | 1 | 0.18mi |
| 3 Waltham St Hammond, IN | 3.0 | 1.0 | 1200 | $1,095 | $0.91 | 25d | 1 | 0.30mi |
| 1312 Gordon Ave Calumet City, IL | 2.0 | 1.0 | 1134 | $1,600 | $1.41 | 7d | 1 | 0.59mi |
| 1539 Wentworth Ave Unit 3W Calumet City, IL | 3.0 | 1.0 | 1100 | $1,700 | $1.55 | 12d | 1 | 1.05mi |
| 617 Kane St Hammond, IN | 4.0 | 2.0 | 2146 | $2,300 | $1.07 | 1d | 1 | 1.19mi |
| 252 Lawndale St Hammond, IN | 4.0 | 3.0 | 2016 | $2,600 | $1.29 | 2d | 1 | 1.28mi |
Listing history 4 events
-
2026-06-18days on market $189,900 Active 3 DOM
-
2026-06-17days on market $189,900 Active 2 DOM
-
2026-06-16remarks 699-char remark
-
2026-06-16$189,900 Active 1 DOM
ⓘ Source: listings_history table (triggers on properties + properties_extension) + one-shot
backfill from property_details.listing_events for pre-trigger history.
Tax reassessment forecast IL · Partial reset (capped growth)
- Current annual tax
- $8,296 · $691/mo
- Projected year-2 tax
- $8,296 · $691/mo
- Expected delta
- $0/yr ($0/mo · 0.0%)
ⓘ Screening estimate from a state-policy table — verify with the county assessor before closing.
Climate risk First Street
- Flood 1/10 Low FEMA zone X (unshaded) · 0% chance over 30 yrs
- Wildfire 1/10 Low
- Heat 3/10 Moderate 7 d/yr ≥102°F today · 15 d/yr by 30 yrs out
- Wind 2/10 Low 0% chance of damaging wind over 30 yrs
- Air quality 4/10 Moderate 5 unhealthy d/yr today · 6 by 30 yrs out
Nearby sold comps map
Loading sold comps map…
Walkable amenities ~0.75 mi
Loading nearby amenities…
Taxation est. · year 1
- Rental income
- $24,049
- − Mortgage interest
- −$10,637
- − Property taxes
- −$8,296
- − Insurance
- −$950
- − Repairs & maintenance
- −$1,924
- − Management
- −$1,924
- − Depreciation
- −$5,524
- Taxable loss
- −$5,206
- Est. tax savings @ 24.0%
- +$1,249
- After-tax cash flow
- $-948/yr
For passive investors: Depreciation is non-cash, so a rental often shows a tax loss while cash-flowing — sheltering income. Rental losses are passive: they offset passive income freely, and up to $25,000/yr can offset ordinary (W-2) income if you actively participate and your MAGI is under $100k (phasing out to $0 by $150k); unused losses carry forward. On sale, claimed depreciation is recaptured at up to 25%, and gains may owe capital-gains tax (a 1031 exchange can defer both). Figures are a year-1 estimate at your 24.0% rate — not tax advice; consult a CPA.
Schools (NCES district)
- District
- Thornton Fractional Twp Hsd 215
- NCES district ID
- 1738940
- Math proficiency
- 9% ▼ -3.00%
- Reading proficiency
- 13% ▼ -3.00%
- Median HH income
- $48,207
- Composite
- 10.27/100
- National rank
- #9793
- State rank
- #563 of 620 in IL
Livability — Calumet City
- Score
- 71/100
- State rank
- #330
- US rank
- #6552
Category grades
Schools grade is shown separately in the Schools card above.
Census & demographics
- Census place
- Calumet City, IL
- County
- Cook County · 4,486,803 people
- City population
- 35,100
- Metro
- Chicago-Naperville-Elgin, IL-IN-WI
- Population (ZIP)
- 35,100
- Household income
- $55,369
- Rent vs Own
- Severe rent burden
- 2415.0
Population outlook (Cook County) Hauer SSP2
- Today (2025)
- 5,347,519 people
- By 2030
- 5,357,703 · +0.2%
- By 2040
- 5,324,924 · -0.4%
- By 2050
- 5,230,762 · -2.2%
- By 2075
- 4,785,735 · -10.5%
- By 2100
- 4,188,836 · -21.7%
Race, ethnicity, and origin ACS 2023
- Neighborhood character
- Predominantly Black (74%)
- Race & ethnicity
- Black 74% Hispanic / Latino 15% White 7% Two or more races 4%
- Hispanic origin (detail)
- Mexican 14%
- Common ancestry
- Romanian 2%
- Foreign-born
- 9% · Canada
- Languages at home
- 83% English-only · Spanish 14%
Political lean MEDSL · Cook
- 2024 margin
- Solid D (+42.0) · D 70.4% · R 28.4% · Other 1.2%
- 2008→2024 swing
- -11.4pp toward R · 2008: 53.4pp · 2024: 42.0pp
- All cycles
- 2024: D+42.0 2020: D+50.3 2016: D+53.0 2012: D+49.4 2008: D+53.4
Not yet ingested
- Civics
- —
Market trends
- HPI YoY
- ▼ -75.01%
- Current HPI
- 197.2137
- Rent YoY
- ▲ 6.17%
- Metro
- Chicago-Naperville-Elgin, IL-IN-WI
- State GDP YoY
- ▲ 1.59%
- F500 in state
- 60
Industry mix (Fortune 500 HQ in IL)
| Industry | F500 HQs | Revenue |
|---|---|---|
| Insurance | 4 | $201B |
|
||
| Consumer Goods | 4 | $87B |
|
||
| Industrial Machinery | 3 | $64B |
|
||
| Healthcare | 2 | $55B |
|
||
| Retail / Pharmacy | 1 | $148B |
|
||
| Agriculture / Food | 1 | $86B |
|
||
Price history
+341.6% since first listed34 events — show timeline
- 2026-06-16 Listed $189,900 MRED as Distributed by MLS Grid
- 2026-06-12 Listing Removed — MRED as Distributed by MLS Grid
- 2023-11-09 Sold (Public Records) $140,000 Public Records
- 2023-11-03 Sold (MLS) $140,000 MRED as Distributed by MLS Grid
- 2023-09-10 Contingent — MRED as Distributed by MLS Grid
- 2023-08-29 Listed $139,900 MRED as Distributed by MLS Grid
- 2023-03-15 Listing Removed — MRED as Distributed by MLS Grid
- 2023-03-01 Listed — MRED as Distributed by MLS Grid
- 2023-01-09 Listing Removed — MRED as Distributed by MLS Grid
- 2022-11-01 Listed — MRED as Distributed by MLS Grid
- 2022-09-28 Contingent — MRED as Distributed by MLS Grid
- 2022-09-28 Listing Removed — MRED as Distributed by MLS Grid
- 2022-09-01 Listed — MRED as Distributed by MLS Grid
- 2022-08-02 Contingent — MRED as Distributed by MLS Grid
- 2022-08-01 Listing Removed — MRED as Distributed by MLS Grid
- 2022-07-18 Listed — MRED as Distributed by MLS Grid
- 2022-03-05 Listing Removed — MRED as Distributed by MLS Grid
- 2022-02-28 Price Changed — MRED as Distributed by MLS Grid
- 2022-02-26 Listed — MRED as Distributed by MLS Grid
- 2016-08-12 Sold (Public Records) $82,500 Public Records
- 2012-12-11 Sold (MLS) $22,001 MRED as Distributed by MLS Grid
- 2012-11-06 Pending — MRED as Distributed by MLS Grid
- 2012-11-03 Relisted — MRED as Distributed by MLS Grid
- 2012-10-29 Pending — MRED as Distributed by MLS Grid
- 2012-10-25 Relisted — MRED as Distributed by MLS Grid
- 2012-10-18 Pending — MRED as Distributed by MLS Grid
- 2012-10-12 Relisted — MRED as Distributed by MLS Grid
- 2012-10-02 Pending — MRED as Distributed by MLS Grid
- 2012-09-26 Relisted — MRED as Distributed by MLS Grid
- 2012-09-20 Pending — MRED as Distributed by MLS Grid
- 2012-09-08 Listed $22,000 MRED as Distributed by MLS Grid
- 2002-05-31 Sold (Public Records) $118,000 Public Records
- 1983-12-01 Sold (Public Records) $56,500 Public Records
- 1978-07-27 Sold (Public Records) $43,000 Public Records
Property tax history
+5.1%/yrLatest (2023): $8,296 · +52.2% YoY. Source: county tax records.
Cash-flow waterfall
monthlySold comps — $/sqft
last 12 mo · ≤1 miLoading sold comps…