 🏷️ Likely Rental
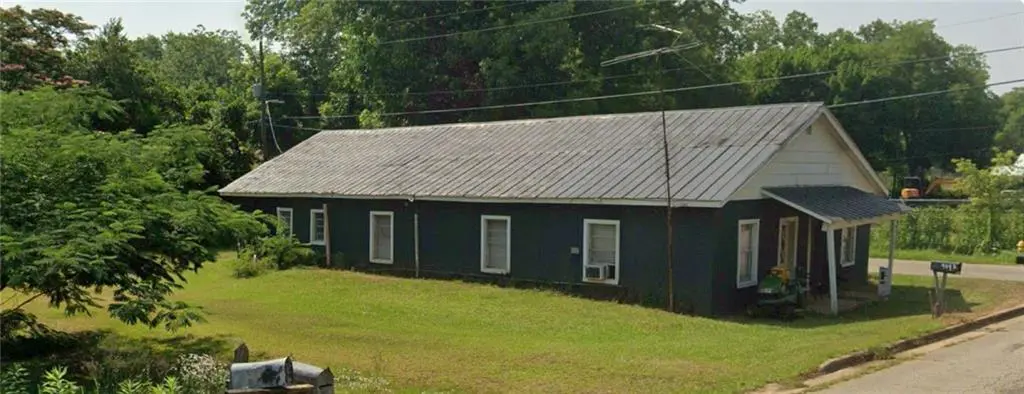
904 Ash St NE · Dawson, GA
Flood risk 1/10 · Minimal
- FEMA flood zone
- X (unshaded)
- Chance of flooding over 30 yrs
- 0.0%
- Est. flood insurance / yr
- $473 – $860
Fire risk 4/10 · Minor
- Est. fire insurance / yr
- $963 – $1,789
Heat risk 7/10 · Major
- Hot days now (above 108°F)
- 7 days/yr
- Hot days in 30 yrs
- 19 days/yr
Wind risk 8/10 · Major
- Chance of severe wind over 30 yrs
- 80.0%
Air-quality risk 2/10 · Minimal
- Unhealthy air days now
- 1 days/yr
- Unhealthy air days in 30 yrs
- 2 days/yr
Risk factors via First Street. Map © Google.
Why this score? — see what drove the B grade
The composite is a weighted blend of 9 inputs, each scored 0–100. Each bar is that input's sub-score; the figure is the points it added to the 100-point composite (weight × sub-score).
- Cash flow +30.0/30.0
- 1% rule +10.0/10.0
- DSCR +10.0/10.0
- ARV discount +7.5/15.0
- Appreciation +5.8/10.0
- Livability +2.8/5.0
- Rent growth +2.5/5.0
- Condition / age +2.5/5.0
- Schools +0.8/10.0
$50,000
🖨 Deal sheet (PDF) 📄 Offer letter ✓ Due diligence
Listing remarks
INVESTOR OPPORTUNITY – INCOME PRODUCING DUPLEX Turnkey duplex offering immediate rental income with future upside potential. This income producing property features two occupied 2 bedroom, 1 bath units with established rental history already in place. Unit 1 currently rents for $435 per month with a $435 security deposit. Lease expires July 1st. Unit 2 currently rents for $400 per month with a $400 security deposit and is leased through February 2026. Market rents in the area are estimated around $650 to $700 per unit, creating an opportunity for future income growth and improved cash flow. The property features durable cinder block and siding construction, a newer roof installed w
Key facts
- Occupied units
- Siding construction
- Rental income
Tags
Property features AI
Finance
- Financial info: Two-unit multifamily property; Unit 1 rent $435; deposit $435; tenant occupies; Utilities (electric, gas, water, garbage) not included for Unit 1; Maintenance is included for Unit 1
- HOA & community: Community features: Other
Exterior
- Parking: Driveway parking; Open parking
- Utilities: Cable available; Electricity available; Natural gas available; Phone available; Sewer available; Water available
- Home design: One-level property; Resale condition; Facing/direction not specified
- Construction: Frame construction; Composition roof
- Exterior features: Driveway; Open parking available; Public water; Septic tank sewer
Interior
- Bedrooms: 2 bedrooms
- Bathrooms: 1 bathroom
- Heating & cooling: Electric heating; Other cooling
- Interior features: Wood window frames
- Laundry & utility: Maintenance included for Unit 1
Neighborhood map
What this means for you Summary
Snapshot
- This is a 4-bed/2.0-bath single-family listed at $50k.
Deal economics
- At list price, monthly cash flow is $664 ($8k/yr) — positive.
- The deal already cash-flows at list — no discount required.
- Meets the 1% rule at list price ($1k rent vs $50k).
- Recommended offer: $48k (3.0% below list) — sets the bar for market timing.
Location & tenants
- Location reads 55/100 on livability (#508 in GA) — a working-class tenant base; expect higher turnover. Strengths: cost of living A+, housing A-; Watch: crime D+, amenities F, commute F.
- Terrell County (rural): math 7% / reading 13% proficiency, ranked #167 of 174 in GA (top 96%) — low school quality limits family demand, transient renter base, plan for 1-2y turnover; 79% free/reduced lunch — lower-income household profile, screen leases tightly.
- Zoned schools: Cooper-Carver Elementary School (math 11% / reading 13%, grade F, #1,041 of 1,228 statewide, top 87%, 482 students, 100% FRL); Terrell Middle School (math 2% / reading 12%, grade F, #449 of 470 statewide, top 97%, 244 students, 100% FRL); Terrell High School (math 5% / reading 5%, grade F, #394 of 424 statewide, top 97%, 309 students, 100% FRL) — zoned schools average 100% FRL vs 79% district-wide (21 pts higher); higher-poverty schools than district average — tighter screening recommended.
- Market conditions: 35 active listings in the ZIP; 1 comparable units currently listed for rent nearby; 2 units permitted in Terrell County in 2024 (0 in 5+ unit buildings).
Forward outlook
- In year one you build about $1k of equity ($346 loan paydown + $782 appreciation (1.6% local appreciation)).
- Terrell County population projected at -33% by 2050 — secular population decline; favor cash flow + early exit over multi-decade hold.
- At projected returns (1.6% appreciation + 3.0% rent growth), your $14k cash investment doubles in ~2 years — after that, you're playing with house money.
Negotiation context
- It's been on market 32 days — a 3% lower offer ($48k) is reasonable based on typical stale-listing flexibility.
- 4 sale attempts since 2y ago with the ask held roughly flat each time — persistent listings suggest the price (not the market) is what's stuck; bring a comps-based counter.
Risks & watch-outs
- Watch-outs: built in 1950 — expect roof / HVAC / electrical / plumbing capex.
- Climate carrying-cost: severe wind risk, 80% chance of damaging wind over 30y; extreme-heat days projected 7→19/yr by 2055 (HVAC capex compounding) — expect insurance premiums to compound above CPI over the hold.
Questions for the listing agent
- It's been on market 32 days. Have you received any prior offers? Is the seller open to a 3% concession, seller financing, or rate buy-down credit?
- Built in 1950 — when were the roof, HVAC, electrical panel, plumbing, and water heater last replaced?
- Is there a deadline driving the sale (1031 exchange, divorce, estate, relocation)? That informs how much negotiation room exists.
- Schools are F-rated, which usually means shorter tenancies and higher turnover. Who's the typical renter profile here, and what's been the actual vacancy rate?
- Crime grade is D in this area — have there been break-ins, vandalism, or insurance claims at this property in the last 3 years? What carrier currently insures it and at what premium?
- What's the average days-on-market for RENTAL listings here right now (not sales)? A rising rental-DOM trend means longer vacancies and softer asking-rent achievability than the comps imply.
- What's the recent tenant-quality profile in this submarket — average credit score on applications, eviction rate, late-payment / NSF rate, and stable-employment percentage? A property-management company in the area should have these aggregated.
- How much new for-sale + rental construction is in the pipeline within 1–3 miles? Heavy new supply typically softens prices + rents 12–24 months out; constrained supply supports both.
Investment metrics
- 1% rule
- 2.47% ✓
- Cap rate
- 22.23%
- Cash-on-cash
- 56.90%
- DSCR
- 3.53
- GRM
- 3.4
CMA / ARV
- ARV (median comp)
- $117,311
- List price
- $50,000
- Delta
- -57.38%
- Verdict
- UNDERPRICED
- Comps
- 6 within 1.0 mi
Show comp detail 2 sales within ~0.75 mi
| Address | Dist | Beds/Ba | Sqft | Sold | Price | $/sf | Match |
|---|---|---|---|---|---|---|---|
| 456 Henry Mitchell Dr NE | 0.57mi | 4/2.0 | 1,680 (-7%) | 10mo | $40,000 | $24 | 54 |
| 624 Johnson St SE | 0.74mi | 3/2.0 (-1) | 1,692 (-6%) | 16mo | $125,000 | $74 | 37 |
Match score weights: distance 35% · size 25% · config 20% · recency 20%. Top-matched comps best support the ARV.
Projected returns pro-forma
1.56% appreciation · 3.0% rent growth · sell at horizon
- IRR
- 60.3%
- Equity multiple
- 4.19×
- Total profit
- $44,611
- Equity at exit
- $18,554
- IRR
- 61.1%
- Equity multiple
- 8.46×
- Total profit
- $104,432
- Equity at exit
- $25,849
Cash invested: $14,000 (down + closing). Projections, not guarantees.
Landlord ↔ Tenant lean methodology
- Overall (STATE)
- 90 Strongly Landlord-Friendly
- State Georgia
- 90 Strongly Landlord-Friendly · R+3
- County
- — inherits STATE
- City
- — inherits STATE
ZIP-level market 39842
- Home prices YoY
- 0.8%
- Active inventory
- 35
- Price-to-rent
- 3.4×
Monthly cashflow live
- Estimated rent
- $1,235 medium interval (Pro) →
- Mortgage (P&I)
- −$262
- Tax from tax record
- −$29 /mo · $345/yr
- Insurance
- −$21
- HOA
- −$0
- Vacancy / Maint / Mgmt
- −$259
- Net cashflow
- $664
Break-even live
Sensitivity live
| Price | -10% $692 | -5% $678 | +0% $664 | +5% $650 | +10% $636 |
|---|---|---|---|---|---|
| Rent | -10% $566 | -5% $615 | +0% $664 | +5% $713 | +10% $761 |
| Rate | -1.0pp $689 | -0.5pp $677 | base $664 | +0.5pp $651 | +1.0pp $638 |
UW: 25.0% down · 7.5% · 30yr · 1.5% tax · 5.0% vac · 8.0% maint · 8.0% mgmt
Financing live
Cash to close
- Down payment
- $12,500
- Closing costs
- $1,500
- Reserves months
- —
- Total cash needed
- —
Loan-product check · same deal, 3 products live
Conventional
25% down · 7.5% · 30yr
- Down + closing
- —
- Monthly P&I
- —
- Monthly cashflow
- —
- DSCR
- —
- Eligible?
- —
Personal DTI + credit; lowest rate.
DSCR
20% down · 8.5% · 30yr
- Down + closing
- —
- Monthly P&I
- —
- Monthly cashflow
- —
- DSCR
- —
- Eligible?
- —
No personal income docs; deal must DSCR.
Hard money
10% down · 12.0% · 12mo
- Down + closing
- —
- Monthly P&I
- —
- Monthly cashflow
- —
- DSCR
- —
- Eligible?
- —
Short-term bridge; refi at stabilization.
Rent comps 1 comps
| Address | Beds | Baths | Sqft | Rent | $/sqft | DOM | Units | Dist |
|---|---|---|---|---|---|---|---|---|
| 1404 Georgia Ave SE Dawson, GA | 3.0 | 2.0 | 1310 | $1,235 | $0.94 | 46d | 1 | 1.44mi |
Listing history 22 events
-
2026-06-15days on market $50,000 Active 32 DOM
-
2026-06-14days on market $50,000 Active 30 DOM
-
2026-06-13days on market $50,000 Active 29 DOM
-
2026-06-10days on market $50,000 Active 27 DOM
-
2026-06-09days on market $50,000 Active 26 DOM
-
2026-06-08days on market $50,000 Active 25 DOM
-
2026-06-07days on market $50,000 Active 24 DOM
-
2026-06-05days on market $50,000 Active 21 DOM
-
2026-06-03days on market $50,000 Active 20 DOM
-
2026-06-02days on market $50,000 Active 19 DOM
-
2026-06-01days on market $50,000 Active 18 DOM
-
2026-05-31days on market $50,000 Active 17 DOM
-
2026-05-30days on market $50,000 Active 16 DOM
-
2026-05-14$50,000 Active 1772-char remark
-
2026-05-14$50,000 New 1766-char remark
-
2026-05-08historical
-
2026-01-08price $64,000
-
2026-01-07$55,000 New
-
2025-02-07historical
-
2025-01-31historical
-
2024-10-20$60,000 Active
-
2024-10-20$60,000 New
ⓘ Source: listings_history table (triggers on properties + properties_extension) + one-shot
backfill from property_details.listing_events for pre-trigger history.
Tax reassessment forecast GA · Resets to sale price
- Current annual tax
- $345 · $29/mo
- Projected year-2 tax
- $460 · $38/mo
- Expected delta
- +$115/yr (+$10/mo · 33.4%)
ⓘ Screening estimate from a state-policy table — verify with the county assessor before closing.
Climate risk First Street
- Flood 1/10 Low FEMA zone X (unshaded) · 0% chance over 30 yrs
- Wildfire 4/10 Moderate
- Heat 7/10 Severe 7 d/yr ≥108°F today · 19 d/yr by 30 yrs out
- Wind 8/10 Severe 80% chance of damaging wind over 30 yrs
- Air quality 2/10 Low 1 unhealthy d/yr today · 2 by 30 yrs out
Nearby sold comps map
Loading sold comps map…
Walkable amenities ~0.75 mi
Loading nearby amenities…
Taxation est. · year 1
- Rental income
- $14,820
- − Mortgage interest
- −$2,801
- − Property taxes
- −$345
- − Insurance
- −$250
- − Repairs & maintenance
- −$1,186
- − Management
- −$1,186
- − Depreciation
- −$1,455
- Taxable income
- $7,599
- Est. tax owed @ 24.0%
- −$1,824
- After-tax cash flow
- $6,143/yr
For passive investors: Depreciation is non-cash, so a rental often shows a tax loss while cash-flowing — sheltering income. Rental losses are passive: they offset passive income freely, and up to $25,000/yr can offset ordinary (W-2) income if you actively participate and your MAGI is under $100k (phasing out to $0 by $150k); unused losses carry forward. On sale, claimed depreciation is recaptured at up to 25%, and gains may owe capital-gains tax (a 1031 exchange can defer both). Figures are a year-1 estimate at your 24.0% rate — not tax advice; consult a CPA.
Schools (NCES district)
- District
- Terrell County
- NCES district ID
- 1304860
- Math proficiency
- 7% ▼ -14.00%
- Reading proficiency
- 13% ▼ -9.00%
- Median HH income
- $31,887
- Composite
- 7.87/100
- National rank
- #9928
- State rank
- #167 of 174 in GA
Livability — Dawson
- Score
- 55/100
- State rank
- #508
- US rank
- #23135
Category grades
Schools grade is shown separately in the Schools card above.
Census & demographics
- Census place
- Dawson, GA
- Population (ZIP)
- 7,780
Population outlook (Terrell County) Hauer SSP2
- Today (2025)
- 8,041 people
- By 2030
- 7,444 · -7.4%
- By 2040
- 6,339 · -21.2%
- By 2050
- 5,415 · -32.7%
- By 2075
- 4,220 · -47.5%
- By 2100
- 3,750 · -53.4%
Race, ethnicity, and origin ACS 2023
- Neighborhood character
- Majority Black (64%)
- Race & ethnicity
- Black 64% White 33% Hispanic / Latino 2%
- Common ancestry
- Serbian 1% Lithuanian 1% Italian 1%
- Foreign-born
- 1% · Canada
- Languages at home
- 97% English-only · Spanish 3%
Political lean MEDSL · Terrell
- 2024 margin
- Toss-up / Even · D 51.9% · R 47.8%
- 2008→2024 swing
- -9.7pp toward R · 2008: 13.8pp · 2024: 4.1pp
- All cycles
- 2024: D+4.1 2020: D+8.4 2016: D+9.4 2012: D+16.1 2008: D+13.8
Not yet ingested
- Civics
- —
Market trends
- HPI YoY
- ▲ 1.56%
- Current HPI
- 190.252
- Rent YoY
- —
- Metro
- —
- State GDP YoY
- ▲ 2.66%
- F500 in state
- 28
Industry mix (Fortune 500 HQ in GA)
| Industry | F500 HQs | Revenue |
|---|---|---|
| Paper / Packaging | 2 | $29B |
|
||
| Retail | 1 | $160B |
|
||
| Transportation / Logistics | 1 | $91B |
|
||
| Airlines | 1 | $62B |
|
||
| Consumer Goods | 1 | $47B |
|
||
| Utilities | 1 | $25B |
|
||
Price history
-16.7% since first listed9 events — show timeline
- 2026-06-15 Listing Removed — GAMLS
- 2026-05-14 Listed $50,000 GAMLS
- 2026-05-08 Listing Removed — GAMLS
- 2026-01-08 Price Changed $64,000 GAMLS
- 2026-01-07 Listed $55,000 GAMLS
- 2025-02-07 Listing Removed — FMLS
- 2025-01-31 Listing Removed — GAMLS
- 2024-10-20 Listed $60,000 GAMLS
- 2024-10-20 Listed $60,000 FMLS
Property tax history
+0.3%/yrLatest (2025): $345 · -0.1% YoY. Source: county tax records.
Cash-flow waterfall
monthlySold comps — $/sqft
last 12 mo · ≤1 miLoading sold comps…