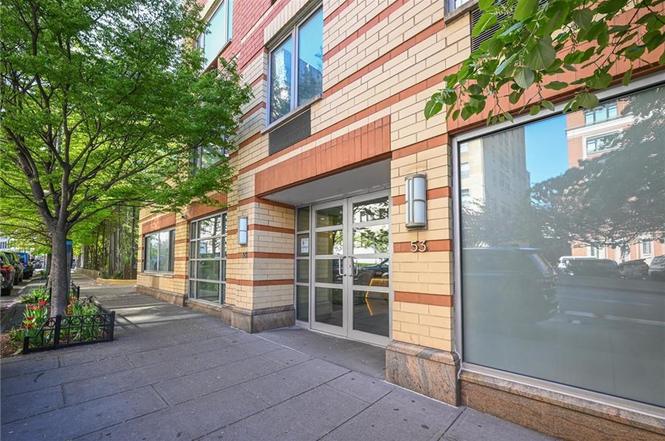
53 Boerum Pl Unit 7C · New York, NY
Flood risk 1/10 · Minimal
- FEMA flood zone
- X (unshaded)
- Chance of flooding over 30 yrs
- 0.0%
- Est. flood insurance / yr
- $507 – $1,088
Fire risk 1/10 · Minimal
- Est. fire insurance / yr
- $691 – $1,283
Heat risk 7/10 · Major
- Hot days now (above 99°F)
- 7 days/yr
- Hot days in 30 yrs
- 15 days/yr
Wind risk 6/10 · Moderate
- Chance of severe wind over 30 yrs
- 27.0%
Air-quality risk 4/10 · Minor
- Unhealthy air days now
- 5 days/yr
- Unhealthy air days in 30 yrs
- 7 days/yr
Risk factors via First Street. Map © Google.
Why this score? — see what drove the D+ grade
The composite is a weighted blend of 9 inputs, each scored 0–100. Each bar is that input's sub-score; the figure is the points it added to the 100-point composite (weight × sub-score).
- Cash flow +10.2/30.0
- Appreciation +8.0/10.0
- ARV discount +7.5/15.0
- 1% rule +5.3/10.0
- Schools +5.0/10.0
- Rent growth +3.8/5.0
- Livability +3.8/5.0
- DSCR +2.9/10.0
- Condition / age +2.5/5.0
$485,000
🖨 Deal sheet 📄 Offer letter ✓ Due diligence
Listing remarks
One Bedroom condominium located in the heart of Downtown Brooklyn. Built in 2003, Designed by the renowned architectural firm Stephen B. Jacobs Group. The building boasts 24-hour doorman and concierge service, a live-in superintendent, and high-speed elevators, fully equipped gym, residents' lounge, a landscaped common garden terrace, bike storage, and a central laundry room. Nearby dining, and shopping, Brooklyn Heights Promenade, which offers breathtaking views of the Manhattan skyline. Transportation several major subway lines within close proximity, 2, 3, 4, 5, A, C, F, and R trains are all easily accessible to Manhattan.
Key facts
- High-speed elevators
- Residents lounge
- 24-hour doorman
Tags
Neighborhood map
What this means for you Summary
Snapshot
- This is a 1-bed/1.0-bath condo listed at $485k.
Deal economics
- At list price, monthly cash flow is $-276 ($-3k/yr) — negative.
- The deal already cash-flows at list — no discount required.
- Meets the 1% rule at list price ($5k rent vs $485k).
- Recommended offer: $427k (12.0% below list) — sets the bar for market timing.
- Cap rate 5.6% vs local median 2.6% in New York — top-decile yield for the area; either an underpriced asset or a hidden risk that comps aren't pricing in. Stress-test before assuming the spread holds.
Location & tenants
- Location reads 75/100 on livability (#268 in NY, #4,188 nationally) — a middle-class / working-renter tenant base. Strengths: amenities A+, commute A+, health & safety A; Watch: crime F, cost of living F.
- Market conditions: Rents rising fast (+5.4%/yr); 393 active listings in the ZIP; 31 comparable units currently listed for rent nearby; rentals leasing fast (median 3d on market — plan ~1-2 weeks tenant-placement turnaround); high-income renter base; 10,063 units permitted in Kings County in 2024 (9,789 in 5+ unit buildings).
- This rent runs 35% of the median local income ($173k/yr) — at the standard rent-burdened threshold; future hikes will face affordability resistance.
Forward outlook
- In year one you build about $32k of equity ($3k loan paydown + $29k appreciation (6.0% local appreciation)).
- Kings County population projected at +13% by 2050 — modest demand growth; plan on rents tracking national, not racing it.
- By year 2, paydown + projected appreciation supports a ~$52k cash-out refi (75% LTV) — recoverable capital for the next deal without selling this one.
Negotiation context
- It's been on market 145 days — a 12% lower offer ($427k) is reasonable based on typical stale-listing flexibility.
Risks & watch-outs
- Climate carrying-cost: major wind risk, 27% chance of damaging wind over 30y; extreme-heat days projected 7→15/yr by 2055 (HVAC capex compounding) — expect insurance premiums to compound above CPI over the hold.
Questions for the listing agent
- What do current leases actually rent for vs. the listed asking? Can we see a recent rent roll and the last 12 months of T-12 income?
- It's been on market 145 days. Have you received any prior offers? Is the seller open to a 12% concession, seller financing, or rate buy-down credit?
- What does the HOA fee cover, when was the last increase, and are there any pending special assessments or reserve-fund shortfalls?
- Any open or pending special assessments — roof, HVAC, plumbing, elevator, façade? What's the per-unit balance and payoff schedule, and is the seller paying it off at close or rolling it to the buyer?
- Why hasn't it sold? Are there any deal-killer items the seller is aware of (foundation, flood, title, zoning, code violations)?
- Is there a deadline driving the sale (1031 exchange, divorce, estate, relocation)? That informs how much negotiation room exists.
- Schools are B-rated — typically a magnet for longer-tenancy family renters. What's the average tenant stay here, and is there a school-zone premium baked into asking?
- Crime grade is F in this area — have there been break-ins, vandalism, or insurance claims at this property in the last 3 years? What carrier currently insures it and at what premium?
- The area grade is low — what's the realistic commute time and amenity access for the typical tenant pool here? Any planned neighborhood developments (good or bad) we should know about?
- What's the average days-on-market for RENTAL listings here right now (not sales)? A rising rental-DOM trend means longer vacancies and softer asking-rent achievability than the comps imply.
- What's the recent tenant-quality profile in this submarket — average credit score on applications, eviction rate, late-payment / NSF rate, and stable-employment percentage? A property-management company in the area should have these aggregated.
- How much new apartment / multifamily construction is in the pipeline within 1–3 miles? Heavy new supply (>2% of stock underway) typically softens rents 12–24 months out; light construction supports rent growth.
Investment metrics
- 1% rule
- 1.03% ✓
- Cap rate
- 5.61%
- Cash-on-cash
- -2.44%
- DSCR
- 0.89
- GRM
- 8.1
CMA / ARV
No comps found within radius.
Projected returns pro-forma
5.97% appreciation · 5.39% rent growth · sell at horizon
- IRR
- 14.6%
- Equity multiple
- 1.99×
- Total profit
- $134,338
- Equity at exit
- $303,837
- IRR
- 15.9%
- Equity multiple
- 4.22×
- Total profit
- $437,794
- Equity at exit
- $550,087
Cash invested: $135,800 (down + closing). Projections, not guarantees.
Landlord ↔ Tenant lean methodology
- Overall (CITY)
- 0 Strongly Tenant-Friendly
- State New York
- 15 Strongly Tenant-Friendly · D+10
- County
- — inherits STATE
- City New York
- 0 Strongly Tenant-Friendly · D+34
ZIP-level market 11201
- Home prices YoY
- 1.9%
- Rents YoY
- 5.4%
- Active inventory
- 393
- Price-to-rent
- 8.1×
Monthly cashflow live
- Estimated rent
- $4,979 high interval (Pro) →
- Mortgage (P&I)
- −$2,543
- Tax from tax record
- −$796 /mo · $9,549/yr
- Insurance
- −$202
- HOA est. from 2 same-building comps
- −$668
- Vacancy / Maint / Mgmt
- −$1,046
- Net cashflow
- $-276
Break-even live
UW: 25.0% down · 7.5% · 30yr · 1.5% tax · 5.0% vac · 8.0% maint · 8.0% mgmt
Financing live
Cash to close
- Down payment
- $121,250
- Closing costs
- $14,550
- Reserves months
- —
- Total cash needed
- —
Loan-product check · same deal, 3 products live
Conventional
25% down · 7.5% · 30yr
- Down + closing
- —
- Monthly P&I
- —
- Monthly cashflow
- —
- DSCR
- —
- Eligible?
- —
Personal DTI + credit; lowest rate.
DSCR
20% down · 8.5% · 30yr
- Down + closing
- —
- Monthly P&I
- —
- Monthly cashflow
- —
- DSCR
- —
- Eligible?
- —
No personal income docs; deal must DSCR.
Hard money
10% down · 12.0% · 12mo
- Down + closing
- —
- Monthly P&I
- —
- Monthly cashflow
- —
- DSCR
- —
- Eligible?
- —
Short-term bridge; refi at stabilization.
Rent comps 31 comps
| Address | Beds | Baths | Sqft | Rent | $/sqft | DOM | Units | Dist |
|---|---|---|---|---|---|---|---|---|
| 150 Lawrence St Brooklyn, NY | 1.0–2.0 | 1.0–2.0 | 700 | $4,920 | $7.03 | 2d | 2 | 0.22mi |
| 72 Willoughby St Brooklyn, NY | 1.0–2.0 | 1.0 | 487 | $3,900 | $8.00 | 2d | 2 | 0.26mi |
| 200 Montague St #1516 Brooklyn, NY | 1.0 | 1.0 | 600 | $7,500 | $12.50 | 20d | 1 | 0.27mi |
| 141 Joralemon St #819 Brooklyn, NY | 1.0–3.0 | 1.0–2.0 | 750 | $5,820 | $7.76 | 2d | 3 | 0.28mi |
| 111 Lawrence St Brooklyn, NY | 3.0 | 1.0–2.0 | 950 | $4,356 | $4.58 | 1d | 24 | 0.29mi |
| 180 Montague St Brooklyn, NY | 3.0 | 1.0–2.0 | 901 | $5,327 | $5.91 | 1d | 13 | 0.29mi |
| 100 Willoughby St Brooklyn, NY | 3.0 | 1.0–2.0 | 892 | $5,232 | $5.87 | 7d | 1 | 0.31mi |
| 214 Duffield St Brooklyn, NY | 3.0 | 1.0–2.0 | 956 | $4,347 | $4.55 | 2d | 1 | 0.32mi |
| 10 Nevins St Unit 9D Brooklyn, NY | — | 1.0 | 488 | $3,500 | $7.17 | 24d | 1 | 0.46mi |
| 540 Fulton St #1729 Brooklyn, NY | 3.0 | 1.0–2.0 | 750 | $5,737 | $7.65 | 24d | 4 | 0.47mi |
| 343 Gold St Brooklyn, NY | 3.0 | 1.0–2.0 | 903 | $5,053 | $5.59 | 4d | 1 | 0.47mi |
| 333 Schermerhorn St Brooklyn, NY | 1.0 | 1.0 | 585 | $6,782 | $11.58 | 4d | 16 | 0.51mi |
| 196 Willoughby St Brooklyn, NY | 2.0 | 1.0–2.0 | 717 | $6,064 | $8.46 | 1d | 8 | 0.53mi |
| 107 Columbia Hts #1757 Brooklyn, NY | 1.0–2.0 | 1.0–2.0 | 708 | $5,710 | $8.06 | 2d | 2 | 0.70mi |
| 160 Front St Brooklyn, NY | 1.0 | 1.0 | 597 | $5,191 | $8.70 | 2d | 2 | 0.84mi |
| 151 S Elliott Pl Brooklyn, NY | 1.0–2.0 | 1.0–2.0 | 655 | $4,670 | $7.13 | 2d | 2 | 0.87mi |
| 655 Union St #1846 Brooklyn, NY | 1.0–2.0 | 1.0–2.0 | 727 | $5,780 | $7.95 | 2d | 2 | 0.92mi |
| 461 Dean St Brooklyn, NY | 1.0 | 1.0 | 781 | $5,320 | $6.81 | 5d | 5 | 0.94mi |
| 68 Gold St New York, NY | 1.0–2.0 | 1.0 | 700 | $3,610 | $5.16 | 24d | 2 | 1.07mi |
| 475 Clermont Ave Brooklyn, NY | 2.0 | 1.0–2.0 | 807 | $5,144 | $6.37 | 4d | 7 | 1.23mi |
| 545 Vanderbilt Ave Brooklyn, NY | 2.0 | 1.0 | 600 | $4,910 | $8.18 | 2d | 3 | 1.30mi |
| 95 Wall St New York, NY | 2.0 | 1.0–2.0 | 733 | $5,862 | $8.00 | 1d | 39 | 1.37mi |
| 25 Water St Unit 707 New York, NY | — | 1.0 | 550 | $3,950 | $7.18 | 24d | 1 | 1.40mi |
| 25 Water St Apt 706 New York, NY | — | 1.0 | 550 | $3,990 | $7.25 | 24d | 1 | 1.40mi |
| 75 Wall St Unit 251 New York, NY | 1.0 | 1.5 | 653 | $6,580 | $10.08 | 24d | 1 | 1.41mi |
| 75 Wall St New York, NY | 3.0 | 1.0–3.0 | 452 | $7,598 | $16.81 | 15d | 16 | 1.41mi |
| 10 Hanover Sq New York, NY | 2.0 | 1.0–2.0 | 790 | $5,948 | $7.53 | 2d | 25 | 1.41mi |
| 180 Water St #537 New York, NY | 1.0–2.0 | 1.0–2.0 | 728 | $8,040 | $11.04 | 2d | 2 | 1.43mi |
| 67 Wall St #13 New York, NY | 1.0–2.0 | 1.0 | 636 | $5,750 | $9.03 | 2d | 2 | 1.44mi |
| 3 Hanover Sq New York, NY | 3.0 | 1.0–2.0 | 600 | $4,534 | $7.56 | 24d | 5 | 1.45mi |
| 63 Wall St #1971 New York, NY | — | 1.0 | 489 | $5,190 | $10.61 | 20d | 1 | 1.46mi |
HOA detail condo
- Monthly dues
- $0 · $0/yr
- Likely covers
- gymdoorman
- Assessments
- None detected in remarks — confirm with the listing agent.
Listing history 6 events
-
2026-02-15status Pending
-
2026-02-06price $485,000
-
2025-09-23$670,000 Active
-
2025-08-07price $670,000
-
2025-07-17price $649,000
-
2025-06-03price $675,000
ⓘ Source: listings_history table (triggers on properties + properties_extension) + one-shot
backfill from property_details.listing_events for pre-trigger history.
Tax reassessment forecast NY · Partial reset (capped growth)
- Current annual tax
- $9,549 · $796/mo
- Projected year-2 tax
- $9,549 · $796/mo
- Expected delta
- $0/yr ($0/mo · 0.0%)
ⓘ Screening estimate from a state-policy table — verify with the county assessor before closing.
Climate risk First Street
- Flood 1/10 Low FEMA zone X (unshaded) · 0% chance over 30 yrs
- Wildfire 1/10 Low
- Heat 7/10 Severe 7 d/yr ≥99°F today · 15 d/yr by 30 yrs out
- Wind 6/10 Major 27% chance of damaging wind over 30 yrs
- Air quality 4/10 Moderate 5 unhealthy d/yr today · 7 by 30 yrs out
Nearby sold comps map
Loading sold comps map…
Walkable amenities ~0.75 mi
Loading nearby amenities…
Taxation est. · year 1
- Rental income
- $59,749
- − Mortgage interest
- −$27,168
- − Property taxes
- −$9,549
- − Insurance
- −$2,425
- − Repairs & maintenance
- −$4,780
- − Management
- −$4,780
- − HOA
- −$8,016
- − Depreciation
- −$14,109
- Taxable loss
- −$11,077
- Est. tax savings @ 24.0%
- +$2,659
- After-tax cash flow
- $-650/yr
For passive investors: Depreciation is non-cash, so a rental often shows a tax loss while cash-flowing — sheltering income. Rental losses are passive: they offset passive income freely, and up to $25,000/yr can offset ordinary (W-2) income if you actively participate and your MAGI is under $100k (phasing out to $0 by $150k); unused losses carry forward. On sale, claimed depreciation is recaptured at up to 25%, and gains may owe capital-gains tax (a 1031 exchange can defer both). Figures are a year-1 estimate at your 24.0% rate — not tax advice; consult a CPA.
Schools (NCES district)
No district data.
Livability — New York
- Score
- 75/100
- State rank
- #268
- US rank
- #4188
Category grades
Schools grade is shown separately in the Schools card above.
Census & demographics
- Census place
- New York, NY
- County
- Kings County · 2,614,986 people
- City population
- 7,731,280
- Metro
- New York-Newark-Jersey City, NY-NJ-PA
- Population (ZIP)
- 70,674
- Household income
- $173,136
- Rent vs Own
- Severe rent burden
- 4080.0
Population outlook (Kings County) Hauer SSP2
- Today (2025)
- 2,847,441 people
- By 2030
- 2,937,006 · +3.1%
- By 2040
- 3,095,491 · +8.7%
- By 2050
- 3,228,968 · +13.4%
- By 2075
- 3,321,723 · +16.7%
- By 2100
- 3,111,387 · +9.3%
Race, ethnicity, and origin ACS 2023
- Neighborhood character
- Diverse neighborhood (Simpson 0.62)
- Race & ethnicity
- White 58% Asian 14% Black 12% Hispanic / Latino 11% Two or more races 10%
- Hispanic origin (detail)
- Mexican 1% Puerto Rican 3% Dominican 2%
- Common ancestry
- Romanian 4% Scotch-Irish 3% Lithuanian 3%
- Foreign-born
- 21% · Canada, China, South Korea
- Languages at home
- 75% English-only · Spanish 7% Chinese 6% Other Indo-European 3%
Political lean MEDSL · Kings
- 2024 margin
- Solid D (+44.0) · D 72.0% · R 28.0%
- 2008→2024 swing
- -15.5pp toward R · 2008: 59.4pp · 2024: 44.0pp
- All cycles
- 2024: D+44.0 2020: D+54.8 2016: D+61.8 2012: D+63.9 2008: D+59.4
Not yet ingested
- Civics
- —
Market trends
- HPI YoY
- ▲ 5.97%
- Current HPI
- 321.3623
- Rent YoY
- ▲ 5.39%
- Metro
- New York-Newark-Jersey City, NY-NJ-PA
- State GDP YoY
- ▲ 2.60%
- F500 in state
- 92
Industry mix (Fortune 500 HQ in NY)
| Industry | F500 HQs | Revenue |
|---|---|---|
| Financial Services | 10 | $950B |
|
||
| Consumer Goods | 9 | $162B |
|
||
| Insurance | 4 | $225B |
|
||
| Telecommunications | 2 | $144B |
|
||
| Pharmaceuticals | 2 | $112B |
|
||
| Media / Entertainment | 2 | $69B |
|
||
Price history
-28.1% since first listed6 events — show timeline
- 2026-02-15 Pending — BNYMLS
- 2026-02-06 Price Changed $485,000 BNYMLS
- 2025-09-23 Listed $670,000 BNYMLS
- 2025-08-07 Price Changed $670,000 BNYMLS
- 2025-07-17 Price Changed $649,000 BNYMLS
- 2025-06-03 Price Changed $675,000 BNYMLS
Property tax history
+23.2%/yrLatest (2025): $9,549 · +0.2% YoY. Source: county tax records.
Cash-flow waterfall
monthlySold comps — $/sqft
last 12 mo · ≤1 miLoading sold comps…