 8-Plex
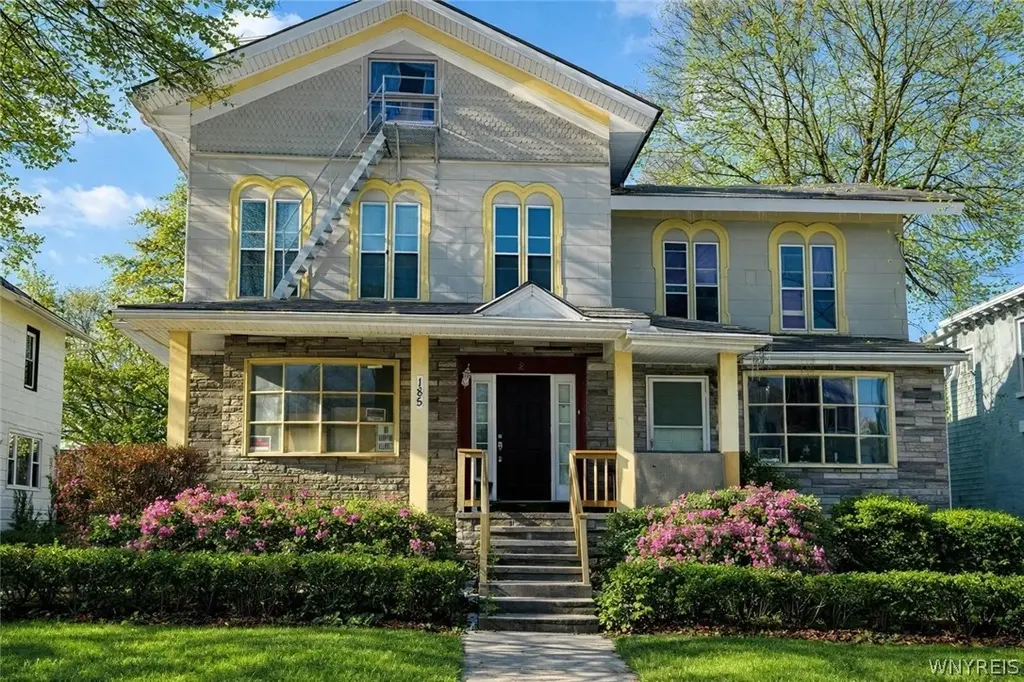
185 Pine St · Lockport, NY
Flood risk 1/10 · Minimal
- FEMA flood zone
- X (unshaded)
- Chance of flooding over 30 yrs
- 0.0%
- Est. flood insurance / yr
- $473 – $860
Fire risk 1/10 · Minimal
- Est. fire insurance / yr
- $691 – $1,283
Heat risk 2/10 · Minimal
- Hot days now (above 95°F)
- 7 days/yr
- Hot days in 30 yrs
- 15 days/yr
Wind risk 1/10 · Minimal
- Chance of severe wind over 30 yrs
- —
Air-quality risk 2/10 · Minimal
- Unhealthy air days now
- 1 days/yr
- Unhealthy air days in 30 yrs
- 2 days/yr
Risk factors via First Street. Map © Google.
Why this score? — see what drove the B grade
The composite is a weighted blend of 9 inputs, each scored 0–100. Each bar is that input's sub-score; the figure is the points it added to the 100-point composite (weight × sub-score).
- Cash flow +30.0/30.0
- 1% rule +10.0/10.0
- DSCR +10.0/10.0
- ARV discount +7.5/15.0
- Schools +3.9/10.0
- Livability +3.8/5.0
- Rent growth +3.4/5.0
- Condition / age +2.5/5.0
- Appreciation +0.0/10.0
$299,900
🖨 Deal sheet 📄 Offer letter ✓ Due diligence
Multi-family units
County records classify this as Multi-Family (5+ Unit). Listing-text estimate: 8 units. confirmed
5+ unit building — per-unit beds/baths from public records are typically unavailable; the breakdown below (if shown) is an estimate from the listing text.
Listing remarks
Ready for an investment opportunity? Eight units gleaming with potential, ready for a new owner. 185 Pine features six units, while 57 and 59 John St consist of a five-car garage with two units above. All properties back up to one another, creating an instant portfolio for the aspiring investor or seasoned conglomerate alike. Storage space is abundant with the five-car garage. Imagine secure space for all of your building materials. Increased profitability by renting out all the spaces? Perhaps. The options are nearly limitless. With some vacant units, the option to reside on premises is instantly accessible if desired. All separate utilities are sure to maximize profitability and provide p
Key facts
- Separate utilities
- Off street parking
- Eight units
Tags
Property features AI
Finance
- Financial info: Owner pays water; rent includes water; Operating expenses include insurance and water/sewer
- HOA & community: Laundry facilities in the community
Exterior
- Parking: One garage space with garage door opener
- Utilities: Public water connected; Sewer connected
- Home design: 3-story building; Resale property
- Construction: Vinyl siding; Asphalt roof; Existing structure
- Exterior features: Covered porch; Gravel driveway; Near public transit; Rectangular lot (66 x 165)
Interior
- Flooring: Ceramic tile; Hardwood; Laminate; Vinyl; Varies
- Heating & cooling: Heat pump; Wall units for cooling; Electric and gas heating; Baseboard heating; Wall furnace
- Interior features: Partial basement; Ceramic tile, hardwood, laminate, vinyl, and varied flooring throughout; Appliances negotiable
- Laundry & utility: Coin-operated laundry facilities; Electric and gas water heaters (water heater on site)
Neighborhood map
What this means for you Summary
Snapshot
- This is a 8 × 2-bed/1-bath units multifamily listed at $300k.
Deal economics
- At list price, monthly cash flow is $5k ($56k/yr) — positive. Per door: $582/mo.
- The deal already cash-flows at list — no discount required.
- Meets the 1% rule at list price ($9k rent vs $300k).
- Recommended offer: $291k (3.0% below list) — sets the bar for market timing.
- Cap rate 24.9% vs local median 4.5% in Lockport — top-decile yield for the area; either an underpriced asset or a hidden risk that comps aren't pricing in. Stress-test before assuming the spread holds.
Location & tenants
- Location reads 76/100 on livability (#232 in NY, #3,669 nationally) — a middle-class / working-renter tenant base. Strengths: amenities A+, cost of living A+, housing A+; Watch: commute D+, crime F, employment D-.
- Lockport City School District (town): math 44% / reading 49% proficiency, ranked #452 of 590 in NY (top 77%) — families likely to look elsewhere, expect single-tenant / working-renter base with shorter leases.
- Market conditions: Rents rising (+3.7%/yr); 357 active listings in the ZIP; solid renter incomes; 167 units permitted in Niagara County in 2024 (0 in 5+ unit buildings).
- At $8,783/mo this rent would consume 140% of the median local household income ($75k/yr) (locally 1112% of renters already pay >50% of income on rent) — very limited rent-growth headroom before tenants either downsize or default.
Forward outlook
- Local home prices are declining (-3.0%/yr); year-one equity from $2k of loan paydown is wiped out by about $9k of value loss. Plan a longer hold.
- Niagara County population projected at -19% by 2050 — secular population decline; favor cash flow + early exit over multi-decade hold.
- At projected returns (-3.0% appreciation + 3.7% rent growth), your $84k cash investment doubles in ~2 years — after that, you're playing with house money.
Negotiation context
- It's been on market 59 days — a 3% lower offer ($291k) is reasonable based on typical stale-listing flexibility.
- 2 sale attempts since 8y ago with the ask held roughly flat each time — persistent listings suggest the price (not the market) is what's stuck; bring a comps-based counter.
- Current owner paid $152k; list at $300k implies a 97% gain — meaningful room to come down on a strong offer.
Risks & watch-outs
- Watch-outs: built in 1880 — expect roof / HVAC / electrical / plumbing capex.
Questions for the listing agent
- It's been on market 59 days. Have you received any prior offers? Is the seller open to a 3% concession, seller financing, or rate buy-down credit?
- Can we see the unit-by-unit rent roll, current vacancy, and any below-market leases? What's the average tenancy length?
- What capital expenditures (roof, boiler, parking lot, exteriors) have been made in the last 5 years, and what's planned in the next 2?
- Built in 1880 — when were the roof, HVAC, electrical panel, plumbing, and water heater last replaced?
- Is there a deadline driving the sale (1031 exchange, divorce, estate, relocation)? That informs how much negotiation room exists.
- Schools are B-rated — typically a magnet for longer-tenancy family renters. What's the average tenant stay here, and is there a school-zone premium baked into asking?
- Crime grade is F in this area — have there been break-ins, vandalism, or insurance claims at this property in the last 3 years? What carrier currently insures it and at what premium?
- What's the average days-on-market for RENTAL listings here right now (not sales)? A rising rental-DOM trend means longer vacancies and softer asking-rent achievability than the comps imply.
- What's the recent tenant-quality profile in this submarket — average credit score on applications, eviction rate, late-payment / NSF rate, and stable-employment percentage? A property-management company in the area should have these aggregated.
- How much new apartment / multifamily construction is in the pipeline within 1–3 miles? Heavy new supply (>2% of stock underway) typically softens rents 12–24 months out; light construction supports rent growth.
Investment metrics
- 1% rule
- 2.93% ✓
- Cap rate
- 24.92%
- Cash-on-cash
- 66.51%
- DSCR
- 3.96
- GRM
- 2.8
CMA / ARV
No comps found within radius.
Projected returns pro-forma
-3.0% appreciation · 3.67% rent growth · sell at horizon
- IRR
- 66.6%
- Equity multiple
- 4.03×
- Total profit
- $254,071
- Equity at exit
- $44,716
- IRR
- 71.1%
- Equity multiple
- 8.49×
- Total profit
- $628,820
- Equity at exit
- $25,930
Cash invested: $83,972 (down + closing). Projections, not guarantees.
Landlord ↔ Tenant lean methodology
- Overall (STATE)
- 15 Strongly Tenant-Friendly
- State New York
- 15 Strongly Tenant-Friendly · D+10
- County
- — inherits STATE
- City
- — inherits STATE
ZIP-level market 14094
- Rents YoY
- 3.7%
- Active inventory
- 357
- Price-to-rent
- 22.8×
Monthly cashflow live
- Estimated rent
- $8,783 medium interval (Pro) →
- Mortgage (P&I)
- −$1,573
- Tax from tax record
- −$586 /mo · $7,037/yr
- Insurance
- −$125
- HOA
- −$0
- Vacancy / Maint / Mgmt
- −$1,844
- Net cashflow
- $4,654
Break-even live
8-unit breakdown (identical units grouped — click to expand)
| Units | Beds | Baths | Est. rent |
|---|---|---|---|
| 8× units | 2 | 1 | $8,784 |
| #1 | 2 | 1 | $1,098 |
| #2 | 2 | 1 | $1,098 |
| #3 | 2 | 1 | $1,098 |
| #4 | 2 | 1 | $1,098 |
| #5 | 2 | 1 | $1,098 |
| #6 | 2 | 1 | $1,098 |
| #7 | 2 | 1 | $1,098 |
| #8 | 2 | 1 | $1,098 |
| Total (8 units) | $8,783 | ||
UW: 25.0% down · 7.5% · 30yr · 1.5% tax · 5.0% vac · 8.0% maint · 8.0% mgmt
Financing live
Cash to close
- Down payment
- $74,975
- Closing costs
- $8,997
- Reserves months
- —
- Total cash needed
- —
Loan-product check · same deal, 3 products live
Conventional
25% down · 7.5% · 30yr
- Down + closing
- —
- Monthly P&I
- —
- Monthly cashflow
- —
- DSCR
- —
- Eligible?
- —
Personal DTI + credit; lowest rate.
DSCR
20% down · 8.5% · 30yr
- Down + closing
- —
- Monthly P&I
- —
- Monthly cashflow
- —
- DSCR
- —
- Eligible?
- —
No personal income docs; deal must DSCR.
Hard money
10% down · 12.0% · 12mo
- Down + closing
- —
- Monthly P&I
- —
- Monthly cashflow
- —
- DSCR
- —
- Eligible?
- —
Short-term bridge; refi at stabilization.
Listing history 19 events
-
2026-06-18days on market $299,900 Active 59 DOM
-
2026-06-17days on market $299,900 Active 58 DOM
-
2026-06-16days on market $299,900 Active 57 DOM
-
2026-06-15days on market $299,900 Active 56 DOM
-
2026-06-13days on market $299,900 Active 54 DOM
-
2026-06-13days on market $299,900 Active 53 DOM
-
2026-06-10days on market $299,900 Active 51 DOM
-
2026-06-09days on market $299,900 Active 50 DOM
-
2026-06-08days on market $299,900 Active 49 DOM
-
2026-06-07days on market $299,900 Active 48 DOM
-
2026-06-05days on market $299,900 Active 45 DOM
-
2026-06-03days on market $299,900 Active 44 DOM
-
2026-06-02days on market $299,900 Active 43 DOM
-
2026-06-01days on market $299,900 Active 42 DOM
-
2026-05-31days on market $299,900 Active 41 DOM
-
2026-04-20$299,900 Active
-
2020-08-30historical
-
2018-09-20$360,000 Active
-
2005-05-26soldstatus $152,000
ⓘ Source: listings_history table (triggers on properties + properties_extension) + one-shot
backfill from property_details.listing_events for pre-trigger history.
Tax reassessment forecast NY · Partial reset (capped growth)
- Current annual tax
- $7,037 · $586/mo
- Projected year-2 tax
- $7,037 · $586/mo
- Expected delta
- $0/yr ($0/mo · 0.0%)
ⓘ Screening estimate from a state-policy table — verify with the county assessor before closing.
Climate risk First Street
- Flood 1/10 Low FEMA zone X (unshaded) · 0% chance over 30 yrs
- Wildfire 1/10 Low
- Heat 2/10 Low 7 d/yr ≥95°F today · 15 d/yr by 30 yrs out
- Wind 1/10 Low
- Air quality 2/10 Low 1 unhealthy d/yr today · 2 by 30 yrs out
Nearby sold comps map
Loading sold comps map…
Walkable amenities ~0.75 mi
Loading nearby amenities…
Taxation est. · year 1
- Rental income
- $105,396
- − Mortgage interest
- −$16,799
- − Property taxes
- −$7,037
- − Insurance
- −$1,500
- − Repairs & maintenance
- −$8,432
- − Management
- −$8,432
- − Depreciation
- −$8,724
- Taxable income
- $54,472
- Est. tax owed @ 24.0%
- −$13,073
- After-tax cash flow
- $42,780/yr
For passive investors: Depreciation is non-cash, so a rental often shows a tax loss while cash-flowing — sheltering income. Rental losses are passive: they offset passive income freely, and up to $25,000/yr can offset ordinary (W-2) income if you actively participate and your MAGI is under $100k (phasing out to $0 by $150k); unused losses carry forward. On sale, claimed depreciation is recaptured at up to 25%, and gains may owe capital-gains tax (a 1031 exchange can defer both). Figures are a year-1 estimate at your 24.0% rate — not tax advice; consult a CPA.
Schools (NCES district)
- District
- Lockport City School District
- NCES district ID
- 3617670
- Math proficiency
- 44% ▼ -7.00%
- Reading proficiency
- 49% ▲ 3.00%
- Median HH income
- $43,793
- Composite
- 39.28/100
- National rank
- #3997
- State rank
- #452 of 590 in NY
Livability — Lockport
- Score
- 76/100
- State rank
- #232
- US rank
- #3669
Category grades
Schools grade is shown separately in the Schools card above.
Census & demographics
- Census place
- Lockport, NY
- County
- Niagara County · 157,377 people
- City population
- 50,153
- Metro
- Buffalo-Cheektowaga, NY
- Population (ZIP)
- 50,153
- Household income
- $75,427
- Rent vs Own
- Severe rent burden
- 1112.0
Population outlook (Niagara County) Hauer SSP2
- Today (2025)
- 204,149 people
- By 2030
- 197,900 · -3.1%
- By 2040
- 182,239 · -10.7%
- By 2050
- 165,198 · -19.1%
- By 2075
- 129,416 · -36.6%
- By 2100
- 96,222 · -52.9%
Race, ethnicity, and origin ACS 2023
- Neighborhood character
- Predominantly White (84%)
- Race & ethnicity
- White 84% Two or more races 6% Black 6% Hispanic / Latino 3%
- Common ancestry
- Romanian 9% Slovak 2% Lithuanian 2%
- Foreign-born
- 3% · Canada
- Languages at home
- 96% English-only · Spanish 1% Russian/Polish/Slavic 1% Other Indo-European 1%
Political lean MEDSL · Niagara
- 2024 margin
- R (+14.9) · D 42.5% · R 57.5%
- 2008→2024 swing
- -15.9pp toward R · 2008: 1.0pp · 2024: -14.9pp
- All cycles
- 2024: R+14.9 2020: R+9.7 2016: R+19.0 2012: D+0.6 2008: D+1.0
Not yet ingested
- Civics
- —
Market trends
- HPI YoY
- ▼ -262.57%
- Current HPI
- 303.6109
- Rent YoY
- ▲ 3.67%
- Metro
- Buffalo-Cheektowaga, NY
- State GDP YoY
- ▲ 2.60%
- F500 in state
- 92
Industry mix (Fortune 500 HQ in NY)
| Industry | F500 HQs | Revenue |
|---|---|---|
| Financial Services | 10 | $950B |
|
||
| Consumer Goods | 9 | $162B |
|
||
| Insurance | 4 | $225B |
|
||
| Telecommunications | 2 | $144B |
|
||
| Pharmaceuticals | 2 | $112B |
|
||
| Media / Entertainment | 2 | $69B |
|
||
Price history
+97.3% since first listed4 events — show timeline
- 2026-04-20 Listed $299,900 WNYREIS
- 2020-08-30 Listing Removed — WNYREIS
- 2018-09-20 Listed $360,000 WNYREIS
- 2005-05-26 Sold (Public Records) $152,000 Public Records
Property tax history
+10.9%/yrLatest (2025): $7,037 · -2.3% YoY. Source: county tax records.
Cash-flow waterfall
monthlySold comps — $/sqft
last 12 mo · ≤1 miLoading sold comps…