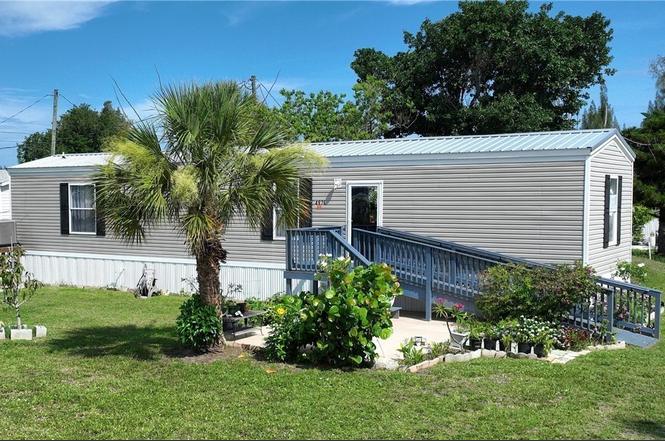
4976 Curlew Dr · St. James City, FL
Flood risk 9/10 · Severe
- FEMA flood zone
- AE
- Chance of flooding over 30 yrs
- 0.99%
- Est. flood insurance / yr
- $1,737 – $8,500
Fire risk 3/10 · Minor
- Est. fire insurance / yr
- $947 – $1,759
Heat risk 10/10 · Severe
- Hot days now (above 107°F)
- 7 days/yr
- Hot days in 30 yrs
- 25 days/yr
Wind risk 10/10 · Severe
- Chance of severe wind over 30 yrs
- 99.0%
Air-quality risk 2/10 · Minimal
- Unhealthy air days now
- 1 days/yr
- Unhealthy air days in 30 yrs
- 1 days/yr
Risk factors via First Street. Map © Google.
Why this score? — see what drove the D grade
The composite is a weighted blend of 9 inputs, each scored 0–100. Each bar is that input's sub-score; the figure is the points it added to the 100-point composite (weight × sub-score).
- Cash flow +19.6/30.0
- DSCR +6.2/10.0
- 1% rule +5.4/10.0
- Schools +4.1/10.0
- Rent growth +2.5/5.0
- Livability +2.5/5.0
- Condition / age +2.5/5.0
- ARV discount +0.0/15.0
- Appreciation +0.0/10.0
$168,000
🖨 Deal sheet 📄 Offer letter ✓ Due diligence
Listing remarks
Welcome to a great waterfront opportunity in St James city, you can own a new home with new A/C and brand new septic field in a community that offers quick access to the open water, community pool and club house, this property also offers a nice deck out back to relax on and enjoy the mornings and evenings.
Key facts
- Community pool
- New a/c
- Club house
Tags
Property features AI
Finance
- Financial info: Pets allowed
- HOA & community: Association amenities: Boat dock, boat ramp, clubhouse; Community features: Boat facilities
Exterior
- Parking: No parking details provided
- Security: Smoke detector(s)
- Utilities: Public water; Septic tank; Cable available
- Home design: Manufactured home; 1 story; Entry level 1; Faces south
- Construction: Vinyl siding; Metal roof
- Exterior features: Deck; Open porch; Fruit trees; No additional exterior features listed
Interior
- Kitchen: Range; Dishwasher; Refrigerator
- Bedrooms: Great Room
- Flooring: Vinyl
- Bathrooms: 2 full bathrooms
- Heating & cooling: Central heating (electric); Central air conditioning (electric)
- Interior features: Unfurnished; Living/Dining room; Tub with shower; Split bedrooms; Single-hung windows
- Laundry & utility: Washer; Dryer
Neighborhood map
What this means for you Summary
Snapshot
- This is a 2-bed/2.0-bath manufactured listed at $168k.
Deal economics
- At list price, monthly cash flow is $-232 ($-3k/yr) — negative.
- To cash-flow at today's rent, offer at most $127k (24.4% below list).
- Meets the 1% rule at list price ($2k rent vs $168k).
- Recommended offer: $127k (24.4% below list) — sets the bar for cash-flow.
- Cap rate 7.7% vs local median 4.9% in St. James City — top-decile yield for the area; either an underpriced asset or a hidden risk that comps aren't pricing in. Stress-test before assuming the spread holds.
Location & tenants
- Location reads: area grade D — affects rentability + tenant quality, not the cash-flow math above.
- Lee (suburban): math 47% / reading 50% proficiency, ranked #42 of 73 in FL (top 58%) — families likely to look elsewhere, expect single-tenant / working-renter base with shorter leases.
- Market conditions: 287 active listings in the ZIP; 2 comparable units currently listed for rent nearby; 15,411 units permitted in Lee County in 2024 (4,686 in 5+ unit buildings).
Forward outlook
- Local home prices are declining (-3.0%/yr); year-one equity from $1k of loan paydown is wiped out by about $5k of value loss. Plan a longer hold.
- Lee County population projected at +44% by 2050 — long-run rental-demand tailwind backs the buy-and-hold thesis.
Negotiation context
- Only 2 days on market — expect competitive offers; lowballing is unlikely to land.
- Current owner paid $17k; list at $168k implies a 888% gain — meaningful room to come down on a strong offer.
Risks & watch-outs
- Watch-outs: flood insurance adds $427/mo.
- Climate carrying-cost: in FEMA flood zone AE (mandatory federal flood insurance); severe wind risk, 99% chance of damaging wind over 30y; extreme-heat days projected 7→25/yr by 2055 (HVAC capex compounding) — expect insurance premiums to compound above CPI over the hold.
Questions for the listing agent
- What do current leases actually rent for vs. the listed asking? Can we see a recent rent roll and the last 12 months of T-12 income?
- What's the actual annual flood-insurance premium (NFIP or private), and is the property in a SFHA with mandatory coverage?
- Is there a deadline driving the sale (1031 exchange, divorce, estate, relocation)? That informs how much negotiation room exists.
- The area grade is low — what's the realistic commute time and amenity access for the typical tenant pool here? Any planned neighborhood developments (good or bad) we should know about?
- What's the average days-on-market for RENTAL listings here right now (not sales)? A rising rental-DOM trend means longer vacancies and softer asking-rent achievability than the comps imply.
- What's the recent tenant-quality profile in this submarket — average credit score on applications, eviction rate, late-payment / NSF rate, and stable-employment percentage? A property-management company in the area should have these aggregated.
- How much new for-sale + rental construction is in the pipeline within 1–3 miles? Heavy new supply typically softens prices + rents 12–24 months out; constrained supply supports both.
Investment metrics
- 1% rule
- 1.04% ✓
- Cap rate
- 7.68%
- Cash-on-cash
- 4.96%
- DSCR
- 1.22
- GRM
- 8.1
CMA / ARV
- ARV (on-the-fly)
- $133,650
- Comps found
- 4
Show comp detail 4 sales within ~0.75 mi
| Address | Dist | Beds/Ba | Sqft | Sold | Price | $/sf | Match |
|---|---|---|---|---|---|---|---|
| 4873 Curlew Dr | 0.12mi | 2/2.0 | 840 (+4%) | 8mo | $180,000 | $214 | 82 |
| 4868 Flamingo Dr | 0.12mi | 2/1.5 | 864 (+7%) | 1mo | $95,000 | $110 | 80 |
| 4940 Pinfish Ln | 0.34mi | 2/2.0 | 862 (+6%) | 2mo | $142,500 | $165 | 72 |
| 7261 Drum Dr | 0.35mi | 2/2.0 | 768 (-5%) | 14mo | $100,000 | $130 | 64 |
Match score weights: distance 35% · size 25% · config 20% · recency 20%. Top-matched comps best support the ARV.
Projected returns pro-forma
-3.0% appreciation · 3.0% rent growth · sell at horizon
- IRR
- -26.2%
- Equity multiple
- 0.11×
- Total profit
- $-41,710
- Equity at exit
- $25,049
- IRR
- -22.3%
- Equity multiple
- -0.15×
- Total profit
- $-54,142
- Equity at exit
- $14,526
Cash invested: $47,040 (down + closing). Projections, not guarantees.
Landlord ↔ Tenant lean methodology
- Overall (STATE)
- 87 Strongly Landlord-Friendly
- State Florida
- 87 Strongly Landlord-Friendly · R+3
- County
- — inherits STATE
- City
- — inherits STATE
ZIP-level market 33956
- Home prices YoY
- -16.3%
- Active inventory
- 287
- Price-to-rent
- 8.1×
Monthly cashflow live
- Estimated rent
- $1,739 medium interval (Pro) →
- Mortgage (P&I)
- −$881
- Tax from tax record
- −$228 /mo · $2,740/yr
- Insurance
- −$70
- Flood insurance flood zone
- −$427 /mo · $5,118/yr
- HOA
- −$0
- Vacancy / Maint / Mgmt
- −$365
- Net cashflow
- $-232
Break-even live
UW: 25.0% down · 7.5% · 30yr · 1.5% tax · 5.0% vac · 8.0% maint · 8.0% mgmt
Financing live
Cash to close
- Down payment
- $42,000
- Closing costs
- $5,040
- Reserves months
- —
- Total cash needed
- —
Loan-product check · same deal, 3 products live
Conventional
25% down · 7.5% · 30yr
- Down + closing
- —
- Monthly P&I
- —
- Monthly cashflow
- —
- DSCR
- —
- Eligible?
- —
Personal DTI + credit; lowest rate.
DSCR
20% down · 8.5% · 30yr
- Down + closing
- —
- Monthly P&I
- —
- Monthly cashflow
- —
- DSCR
- —
- Eligible?
- —
No personal income docs; deal must DSCR.
Hard money
10% down · 12.0% · 12mo
- Down + closing
- —
- Monthly P&I
- —
- Monthly cashflow
- —
- DSCR
- —
- Eligible?
- —
Short-term bridge; refi at stabilization.
Rent comps 2 comps
| Address | Beds | Baths | Sqft | Rent | $/sqft | DOM | Units | Dist |
|---|---|---|---|---|---|---|---|---|
| 4944 Porky Ln Saint James City, FL | 2.0 | 2.0 | 831 | $1,600 | $1.93 | 24d | 1 | 0.33mi |
| 7150 Cobiac Dr Saint James City, FL | 2.0 | 2.0 | 826 | $1,950 | $2.36 | 24d | 1 | 0.50mi |
Listing history 3 events
-
2026-06-18days on market $168,000 Active 2 DOM
-
2026-06-16remarks 308-char remark
-
2026-06-16$168,000 Active 1 DOM
ⓘ Source: listings_history table (triggers on properties + properties_extension) + one-shot
backfill from property_details.listing_events for pre-trigger history.
Tax reassessment forecast FL · Resets to sale price
- Current annual tax
- $2,740 · $228/mo
- Projected year-2 tax
- $2,740 · $228/mo
- Expected delta
- $0/yr ($0/mo · 0.0%)
ⓘ Screening estimate from a state-policy table — verify with the county assessor before closing.
Climate risk First Street
- Flood 9/10 Extreme FEMA zone AE · 99% chance over 30 yrs
- Wildfire 3/10 Moderate
- Heat 10/10 Extreme 7 d/yr ≥107°F today · 25 d/yr by 30 yrs out
- Wind 10/10 Extreme 99% chance of damaging wind over 30 yrs
- Air quality 2/10 Low 1 unhealthy d/yr today · 1 by 30 yrs out
Nearby sold comps map
Loading sold comps map…
Walkable amenities ~0.75 mi
Loading nearby amenities…
Taxation est. · year 1
- Rental income
- $20,867
- − Mortgage interest
- −$9,411
- − Property taxes
- −$2,740
- − Insurance
- −$5,958
- − Repairs & maintenance
- −$1,669
- − Management
- −$1,669
- − Depreciation
- −$4,887
- Taxable loss
- −$5,468
- Est. tax savings @ 24.0%
- +$1,312
- After-tax cash flow
- $-1,473/yr
For passive investors: Depreciation is non-cash, so a rental often shows a tax loss while cash-flowing — sheltering income. Rental losses are passive: they offset passive income freely, and up to $25,000/yr can offset ordinary (W-2) income if you actively participate and your MAGI is under $100k (phasing out to $0 by $150k); unused losses carry forward. On sale, claimed depreciation is recaptured at up to 25%, and gains may owe capital-gains tax (a 1031 exchange can defer both). Figures are a year-1 estimate at your 24.0% rate — not tax advice; consult a CPA.
Schools (NCES district)
- District
- Lee
- NCES district ID
- 1201080
- Math proficiency
- 47% ▼ -11.00%
- Reading proficiency
- 50% ▼ -4.00%
- Median HH income
- $49,518
- Composite
- 41.49/100
- National rank
- #3458
- State rank
- #42 of 73 in FL
Livability — St. James City
No livability data for this city. (Only ~50 U.S. cities are tracked.)
Census & demographics
- Census place
- St. James City, FL
- Population (ZIP)
- 3,846
Population outlook (Lee County) Hauer SSP2
- Today (2025)
- 871,946 people
- By 2030
- 955,468 · +9.6%
- By 2040
- 1,113,587 · +27.7%
- By 2050
- 1,256,891 · +44.1%
- By 2075
- 1,560,270 · +78.9%
- By 2100
- 1,726,848 · +98.0%
Race, ethnicity, and origin ACS 2023
- Neighborhood character
- Predominantly White (94%)
- Race & ethnicity
- White 94% Two or more races 3% Pacific Islander 2% Hispanic / Latino 1%
- Common ancestry
- Romanian 6% Slovak 4% Iranian 3%
- Foreign-born
- 5% · Canada
- Languages at home
- 95% English-only · French/Haitian/Cajun 2% German/W. Germanic 2% Russian/Polish/Slavic 1%
Political lean MEDSL · Lee
- 2024 margin
- Strong R (+28.4) · D 35.5% · R 63.9%
- 2008→2024 swing
- -18.0pp toward R · 2008: -10.4pp · 2024: -28.4pp
- All cycles
- 2024: R+28.4 2020: R+19.2 2016: R+20.4 2012: R+16.6 2008: R+10.4
Not yet ingested
- Civics
- —
Market trends
- HPI YoY
- ▼ -58.47%
- Current HPI
- 300.1416
- Rent YoY
- —
- Metro
- —
- State GDP YoY
- ▲ 3.28%
- F500 in state
- 36
Industry mix (Fortune 500 HQ in FL)
| Industry | F500 HQs | Revenue |
|---|---|---|
| Industrial Technology | 2 | $29B |
|
||
| Insurance | 2 | $17B |
|
||
| Retail | 1 | $60B |
|
||
| Technology Distribution | 1 | $58B |
|
||
| Homebuilding | 1 | $35B |
|
||
| Technology Manufacturing | 1 | $35B |
|
||
Price history
+888.2% since first listed2 events — show timeline
- 2026-06-15 Listed $168,000 FORTMLS
- 1978-03-01 Sold (Public Records) $17,000 Public Records
Property tax history
+9.9%/yrLatest (2025): $2,740 · +348.0% YoY. Source: county tax records.
Cash-flow waterfall
monthlySold comps — $/sqft
last 12 mo · ≤1 miLoading sold comps…