126 Via Grande · Olivehurst, CA
Flood risk 4/10 · Minor
- FEMA flood zone
- X
- Chance of flooding over 30 yrs
- 0.24%
- Est. flood insurance / yr
- $507 – $1,088
Fire risk 6/10 · Moderate
- Est. fire insurance / yr
- $659 – $1,223
Heat risk 7/10 · Major
- Hot days now (above 104°F)
- 7 days/yr
- Hot days in 30 yrs
- 16 days/yr
Wind risk 1/10 · Minimal
- Chance of severe wind over 30 yrs
- —
Air-quality risk 10/10 · Severe
- Unhealthy air days now
- 27 days/yr
- Unhealthy air days in 30 yrs
- 31 days/yr
Risk factors via First Street. Map © Google.
Why this score? — see what drove the B grade
The composite is a weighted blend of 9 inputs, each scored 0–100. Each bar is that input's sub-score; the figure is the points it added to the 100-point composite (weight × sub-score).
- Cash flow +30.0/30.0
- ARV discount +10.6/15.0
- 1% rule +10.0/10.0
- DSCR +10.0/10.0
- Livability +2.9/5.0
- Rent growth +2.5/5.0
- Condition / age +2.5/5.0
- Schools +1.8/10.0
- Appreciation +0.0/10.0
$170,000
🖨 Deal sheet 📄 Offer letter ✓ Due diligence
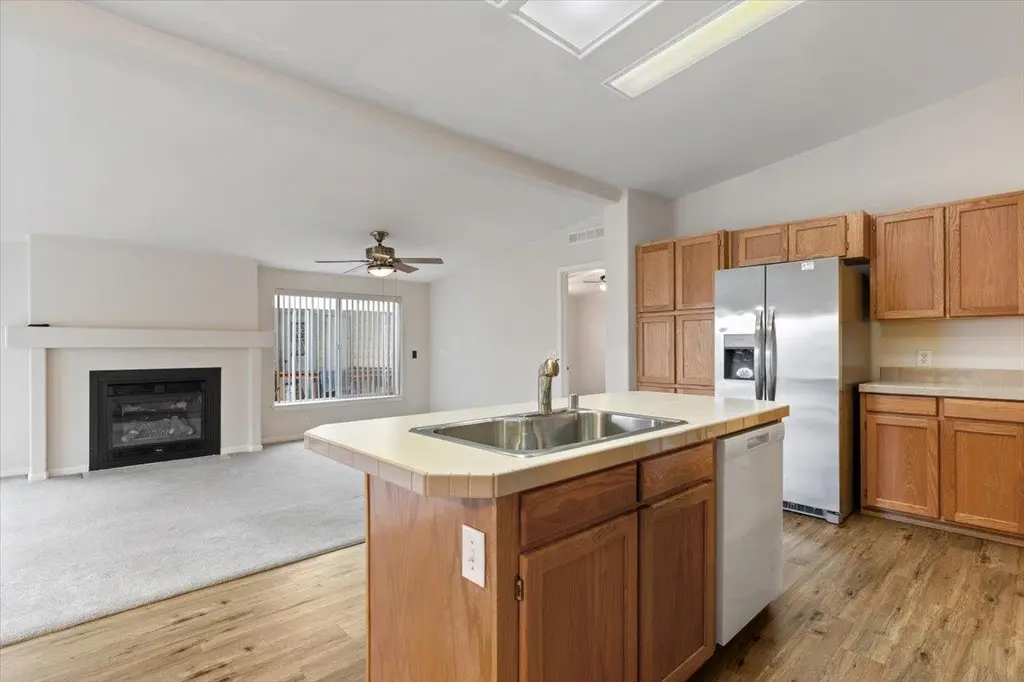
Listing remarks
Welcome to 126 Via Grande in Olivehurst, a spacious 4-bedroom, 2-bathroom triple-wide mobile home located on a corner lot in the all-ages Villa Seville Mobile Home Park. This well-laid-out home offers generous living space and thoughtful features throughout. Enjoy relaxing mornings and quiet evenings on the back porch. Inside, the family room features a cozy fireplace, creating a warm and inviting space for gatherings. The open layout flows seamlessly into the kitchen and dining areas, and all appliances are included, making this home move-in ready. An attached 2-car garage provides secure parking and additional storage. With four bedrooms, there is plenty of room for family, guests, or a h
Key facts
- Attached garage
- Community amenities
- Open layout
Tags
Neighborhood map
What this means for you Summary
Snapshot
- This is a 4-bed/2.0-bath land listed at $170k.
Deal economics
- At list price, monthly cash flow is $1k ($15k/yr) — positive.
- The deal already cash-flows at list — no discount required.
- Meets the 1% rule at list price ($3k rent vs $170k).
- Recommended offer: $155k (9.0% below list) — sets the bar for market timing.
- Cap rate 15.1% vs local median 3.8% in Olivehurst — top-decile yield for the area; either an underpriced asset or a hidden risk that comps aren't pricing in. Stress-test before assuming the spread holds.
Location & tenants
- Location reads 58/100 on livability (#679 in CA) — a working-class tenant base; expect higher turnover. Strengths: housing A+, commute A-; Watch: employment C-, schools F, crime F.
- Marysville Joint Unified (suburban): math 14% / reading 28% proficiency, ranked #455 of 517 in CA (top 88%) — low school quality limits family demand, transient renter base, plan for 1-2y turnover; 68% free/reduced lunch — lower-income household profile, screen leases tightly.
- Market conditions: 315 active listings in the ZIP; 2 comparable units currently listed for rent nearby; solid renter incomes; 750 units permitted in Yuba County in 2024 (41 in 5+ unit buildings).
- This rent runs 38% of the median local income ($90k/yr) — at the standard rent-burdened threshold; future hikes will face affordability resistance.
Forward outlook
- Local home prices are declining (-3.0%/yr); year-one equity from $1k of loan paydown is wiped out by about $5k of value loss. Plan a longer hold.
- Yuba County population projected to shrink 3% by 2050 — rents likely to lag national; underwrite the cash flow, not the appreciation.
- At projected returns (-3.0% appreciation + 3.0% rent growth), your $48k cash investment doubles in ~4 years — after that, you're playing with house money.
Negotiation context
- It's been on market 119 days — a 9% lower offer ($155k) is reasonable based on typical stale-listing flexibility.
Risks & watch-outs
- Climate carrying-cost: major wildfire risk; extreme-heat days projected 7→16/yr by 2055 (HVAC capex compounding) — expect insurance premiums to compound above CPI over the hold.
Questions for the listing agent
- It's been on market 119 days. Have you received any prior offers? Is the seller open to a 9% concession, seller financing, or rate buy-down credit?
- Why hasn't it sold? Are there any deal-killer items the seller is aware of (foundation, flood, title, zoning, code violations)?
- Is there a deadline driving the sale (1031 exchange, divorce, estate, relocation)? That informs how much negotiation room exists.
- Schools are F-rated, which usually means shorter tenancies and higher turnover. Who's the typical renter profile here, and what's been the actual vacancy rate?
- Crime grade is F in this area — have there been break-ins, vandalism, or insurance claims at this property in the last 3 years? What carrier currently insures it and at what premium?
- What's the average days-on-market for RENTAL listings here right now (not sales)? A rising rental-DOM trend means longer vacancies and softer asking-rent achievability than the comps imply.
- What's the recent tenant-quality profile in this submarket — average credit score on applications, eviction rate, late-payment / NSF rate, and stable-employment percentage? A property-management company in the area should have these aggregated.
- How much new for-sale + rental construction is in the pipeline within 1–3 miles? Heavy new supply typically softens prices + rents 12–24 months out; constrained supply supports both.
Investment metrics
- 1% rule
- 1.67% ✓
- Cap rate
- 15.06%
- Cash-on-cash
- 31.31%
- DSCR
- 2.39
- GRM
- 5.0
CMA / ARV
- ARV (median comp)
- $182,500
- List price
- $170,000
- Delta
- -6.85%
- Verdict
- FAIR
- Comps
- 4 within 2.0 mi
Projected returns pro-forma
-3.0% appreciation · 3.0% rent growth · sell at horizon
- IRR
- 26.1%
- Equity multiple
- 2.08×
- Total profit
- $51,487
- Equity at exit
- $25,348
- IRR
- 33.8%
- Equity multiple
- 4.08×
- Total profit
- $146,429
- Equity at exit
- $14,698
Cash invested: $47,600 (down + closing). Projections, not guarantees.
Landlord ↔ Tenant lean methodology
- Overall (STATE)
- 18 Strongly Tenant-Friendly
- State California
- 18 Strongly Tenant-Friendly · D+13
- County
- — inherits STATE
- City
- — inherits STATE
ZIP-level market 95961
- Home prices YoY
- -28.2%
- Active inventory
- 315
- Price-to-rent
- 5.0×
Monthly cashflow live
- Estimated rent
- $2,842 medium interval (Pro) →
- Mortgage (P&I)
- −$891
- Tax from tax record
- −$41 /mo · $490/yr
- Insurance
- −$71
- HOA
- −$0
- Vacancy / Maint / Mgmt
- −$597
- Net cashflow
- $1,242
Break-even live
UW: 25.0% down · 7.5% · 30yr · 1.5% tax · 5.0% vac · 8.0% maint · 8.0% mgmt
Financing live
Cash to close
- Down payment
- $42,500
- Closing costs
- $5,100
- Reserves months
- —
- Total cash needed
- —
Loan-product check · same deal, 3 products live
Conventional
25% down · 7.5% · 30yr
- Down + closing
- —
- Monthly P&I
- —
- Monthly cashflow
- —
- DSCR
- —
- Eligible?
- —
Personal DTI + credit; lowest rate.
DSCR
20% down · 8.5% · 30yr
- Down + closing
- —
- Monthly P&I
- —
- Monthly cashflow
- —
- DSCR
- —
- Eligible?
- —
No personal income docs; deal must DSCR.
Hard money
10% down · 12.0% · 12mo
- Down + closing
- —
- Monthly P&I
- —
- Monthly cashflow
- —
- DSCR
- —
- Eligible?
- —
Short-term bridge; refi at stabilization.
Rent comps 2 comps
| Address | Beds | Baths | Sqft | Rent | $/sqft | DOM | Units | Dist |
|---|---|---|---|---|---|---|---|---|
| 1746 Barney Ave Olivehurst, CA | 4.0 | 2.0 | 1915 | $2,328 | $1.22 | 13d | 1 | 1.13mi |
| 1726 Valley Meadows Dr Unit A2 Olivehurst, CA | 3.0 | 2.0 | 1245 | $2,099 | $1.69 | 13d | 1 | 1.45mi |
Tax reassessment forecast CA · Resets to sale price
- Current annual tax
- $490 · $41/mo
- Projected year-2 tax
- $1,292 · $108/mo
- Expected delta
- +$802/yr (+$67/mo · 163.8%)
ⓘ Screening estimate from a state-policy table — verify with the county assessor before closing.
Climate risk First Street
- Flood 4/10 Moderate FEMA zone X · 24% chance over 30 yrs
- Wildfire 6/10 Major
- Heat 7/10 Severe 7 d/yr ≥104°F today · 16 d/yr by 30 yrs out
- Wind 1/10 Low
- Air quality 10/10 Extreme 27 unhealthy d/yr today · 31 by 30 yrs out
Nearby sold comps map
Loading sold comps map…
Walkable amenities ~0.75 mi
Loading nearby amenities…
Taxation est. · year 1
- Rental income
- $34,102
- − Mortgage interest
- −$9,523
- − Property taxes
- −$490
- − Insurance
- −$850
- − Repairs & maintenance
- −$2,728
- − Management
- −$2,728
- − Depreciation
- −$4,945
- Taxable income
- $12,838
- Est. tax owed @ 24.0%
- −$3,081
- After-tax cash flow
- $11,822/yr
For passive investors: Depreciation is non-cash, so a rental often shows a tax loss while cash-flowing — sheltering income. Rental losses are passive: they offset passive income freely, and up to $25,000/yr can offset ordinary (W-2) income if you actively participate and your MAGI is under $100k (phasing out to $0 by $150k); unused losses carry forward. On sale, claimed depreciation is recaptured at up to 25%, and gains may owe capital-gains tax (a 1031 exchange can defer both). Figures are a year-1 estimate at your 24.0% rate — not tax advice; consult a CPA.
Schools (NCES district)
- District
- Marysville Joint Unified
- NCES district ID
- 0624090
- Math proficiency
- 14% ▼ -13.00%
- Reading proficiency
- 28% ▼ -10.00%
- Median HH income
- $44,598
- Composite
- 18.18/100
- National rank
- #8961
- State rank
- #455 of 517 in CA
Livability — Olivehurst
- Score
- 58/100
- State rank
- #679
- US rank
- #20829
Category grades
Schools grade is shown separately in the Schools card above.
Census & demographics
- Census place
- Olivehurst, CA
- County
- Yuba County · 71,731 people
- City population
- 33,999
- Metro
- Yuba City, CA
- Population (ZIP)
- 33,999
- Household income
- $89,561
- Rent vs Own
- Severe rent burden
- 461.0
Population outlook (Yuba County) Hauer SSP2
- Today (2025)
- 75,432 people
- By 2030
- 75,358 · -0.1%
- By 2040
- 74,643 · -1.0%
- By 2050
- 72,937 · -3.3%
- By 2075
- 66,368 · -12.0%
- By 2100
- 54,524 · -27.7%
Race, ethnicity, and origin ACS 2023
- Neighborhood character
- Diverse neighborhood (Simpson 0.67)
- Race & ethnicity
- White 42% Hispanic / Latino 39% Two or more races 18% Asian 8% Black 4% Native American 1%
- Hispanic origin (detail)
- Mexican 32% Puerto Rican 2%
- Common ancestry
- Lithuanian 1% Slovak 1% Italian 1%
- Foreign-born
- 12% · Canada
- Languages at home
- 69% English-only · Spanish 23% Other Asian/Pacific 5% Russian/Polish/Slavic 1%
Political lean MEDSL · Yuba
- 2024 margin
- Strong R (+25.8) · D 35.7% · R 61.5% · Other 2.8%
- 2008→2024 swing
- -11.2pp toward R · 2008: -14.7pp · 2024: -25.8pp
- All cycles
- 2024: R+25.8 2020: R+21.6 2016: R+24.1 2012: R+19.5 2008: R+14.7
Not yet ingested
- Civics
- —
Market trends
- HPI YoY
- ▼ -87.37%
- Current HPI
- 222.3191
- Rent YoY
- —
- Metro
- Yuba City, CA
- State GDP YoY
- ▲ 3.21%
- F500 in state
- 116
Industry mix (Fortune 500 HQ in CA)
| Industry | F500 HQs | Revenue |
|---|---|---|
| Technology | 27 | $1,492B |
|
||
| Financial Services | 3 | $174B |
|
||
| Retail | 3 | $44B |
|
||
| Insurance | 3 | $26B |
|
||
| Media / Entertainment | 2 | $115B |
|
||
| Pharmaceuticals / Biotech | 2 | $62B |
|
||
Property tax history
+0.5%/yrLatest (2025): $490 · +55.4% YoY. Source: county tax records.
Cash-flow waterfall
monthlySold comps — $/sqft
last 12 mo · ≤1 miLoading sold comps…