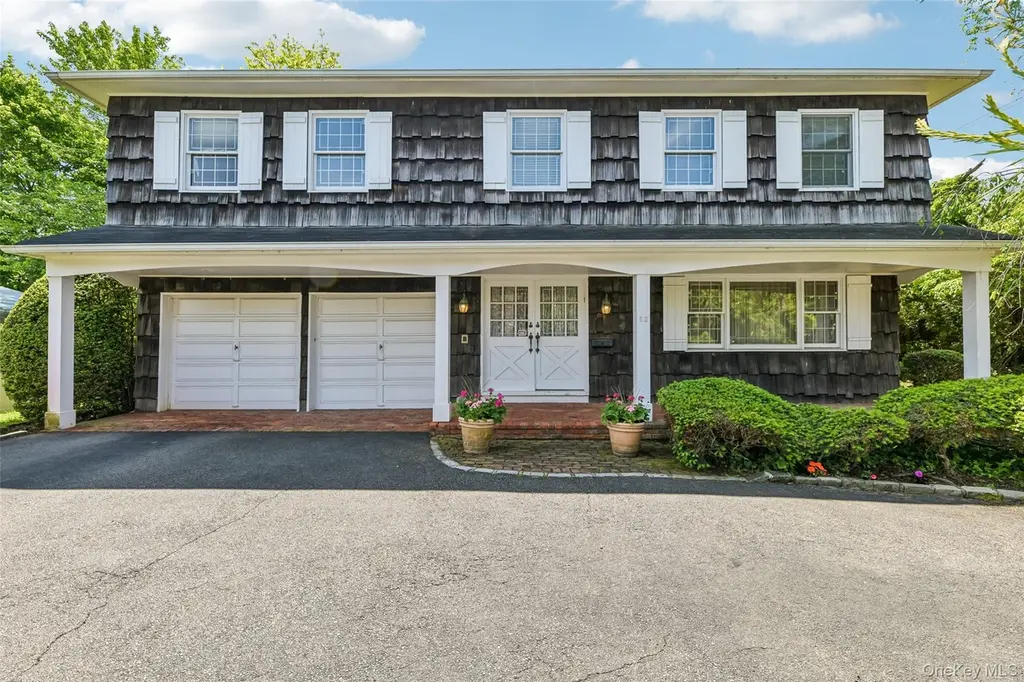
62 Larch Hill Rd · Lawrence, NY
Flood risk 1/10 · Minimal
- FEMA flood zone
- X (unshaded)
- Chance of flooding over 30 yrs
- 0.0%
- Est. flood insurance / yr
- $473 – $860
Fire risk 2/10 · Minimal
- Est. fire insurance / yr
- $691 – $1,283
Heat risk 6/10 · Moderate
- Hot days now (above 95°F)
- 7 days/yr
- Hot days in 30 yrs
- 16 days/yr
Wind risk 6/10 · Moderate
- Chance of severe wind over 30 yrs
- 77.0%
Air-quality risk 4/10 · Minor
- Unhealthy air days now
- 4 days/yr
- Unhealthy air days in 30 yrs
- 6 days/yr
Risk factors via First Street. Map © Google.
Why this score? — see what drove the D grade
The composite is a weighted blend of 9 inputs, each scored 0–100. Each bar is that input's sub-score; the figure is the points it added to the 100-point composite (weight × sub-score).
- Cash flow +13.5/30.0
- Appreciation +10.0/10.0
- Schools +4.2/10.0
- DSCR +4.1/10.0
- Livability +3.0/5.0
- 1% rule +2.8/10.0
- Rent growth +2.5/5.0
- Condition / age +2.5/5.0
- ARV discount +0.0/15.0
$2,998,000
🖨 Deal sheet 📄 Offer letter ✓ Due diligence
Listing remarks
Large Center Hall Colonial in a prime Lawrence location. Set on a very private, quiet street, this beautiful home offers the perfect combination of space, privacy, and convenience. Close to everything Lawrence has to offer, the home features a classic center hall layout with generous rooms, great flow, and endless potential. A rare opportunity to own a substantial home in one of Lawrence’s most desirable locations.
Key facts
- 0.28 acre lot
- 2 garage spots
- Pool
Property features AI
Exterior
- Parking: Attached garage; 2 garage spaces; No carport
- Utilities: Public sewer; Electric service by PSEG; Cable available; Electricity available; Natural gas available; Phone available
- Home design: Single family residence
- Construction: Frame construction
- Exterior features: Private pool; Not waterfront
Interior
- Kitchen: Dishwasher; Gas cooktop; Refrigerator; Stainless steel appliances; Granite countertops; Pantry; Eat-in kitchen
- Bedrooms: Includes a bedroom on the first floor
- Bathrooms: 4 full bathrooms; 1 half bathroom
- Heating & cooling: Hot water heating; Natural gas heating; Central air conditioning
- Interior features: First-floor bedroom; Double vanity; Eat-in kitchen; Formal dining room; Granite counters; Pantry; Primary bathroom; Storage; Washer/dryer hookup; Finished full basement with storage; Partial attic; Total of 8 rooms; One fireplace
- Laundry & utility: Washer included; Washer/dryer hookup
Neighborhood map
What this means for you Summary
Snapshot
- This is a 5-bed/4.5-bath single-family listed at $3.00M.
Deal economics
- At list price, monthly cash flow is $95 ($1k/yr) — positive.
- The deal already cash-flows at list — no discount required.
- To meet the 1% rule (rent ≥ 1% of price), the offer needs to be $2.34M (21.8% below list).
- Recommended offer: $2.34M (21.8% below list) — sets the bar for 1% rule.
- Cap rate 6.3% vs local median 2.8% in Lawrence — top-decile yield for the area; either an underpriced asset or a hidden risk that comps aren't pricing in. Stress-test before assuming the spread holds.
Location & tenants
- Location reads 60/100 on livability (#981 in NY) — a middle-class / working-renter tenant base. Strengths: crime A+, employment A+; Watch: housing C-, amenities F, commute F.
- Lawrence Union Free School District (suburban): math 43% / reading 46% proficiency, ranked #399 of 590 in NY (top 68%) — families likely to look elsewhere, expect single-tenant / working-renter base with shorter leases.
- Zoned schools: Lawrence Early Childhood Center At #4 School (145 students, 94% FRL); Lawrence Middle School At Broadway Campus (math 12% / reading 37%, grade F, #611 of 729 statewide, top 88%, 405 students, 79% FRL); Lawrence Senior High School (math 87% / reading 30%, grade C, #877 of 1,100 statewide, top 80%, 770 students, 70% FRL) — zoned schools average 81% FRL vs 52% district-wide (29 pts higher); higher-poverty schools than district average — tighter screening recommended.
- Market conditions: 53 active listings in the ZIP; 3 comparable units currently listed for rent nearby; rentals leasing fast (median 2d on market — plan ~1-2 weeks tenant-placement turnaround); 824 units permitted in Nassau County in 2024 (153 in 5+ unit buildings).
Forward outlook
- In year one you build about $321k of equity ($21k loan paydown + $300k appreciation (10.0% local appreciation)).
- Nassau County population projected at +7% by 2050 — modest demand growth; plan on rents tracking national, not racing it.
- At projected returns (10.0% appreciation + 3.0% rent growth), your $839k cash investment doubles in ~3 years — after that, you're playing with house money.
- By year 2, paydown + projected appreciation supports a ~$515k cash-out refi (75% LTV) — recoverable capital for the next deal without selling this one.
Negotiation context
- Only 8 days on market — expect competitive offers; lowballing is unlikely to land.
- 2 sale attempts since 12y ago with the ask held roughly flat each time — persistent listings suggest the price (not the market) is what's stuck; bring a comps-based counter.
- Current owner paid $135k; list at $3.00M implies a 2121% gain — meaningful room to come down on a strong offer.
Risks & watch-outs
- Climate carrying-cost: major wind risk, 77% chance of damaging wind over 30y; extreme-heat days projected 7→16/yr by 2055 (HVAC capex compounding) — expect insurance premiums to compound above CPI over the hold.
Questions for the listing agent
- Built in 1970 — when were the roof, HVAC, electrical panel, plumbing, and water heater last replaced?
- Is there a deadline driving the sale (1031 exchange, divorce, estate, relocation)? That informs how much negotiation room exists.
- The area grade is low — what's the realistic commute time and amenity access for the typical tenant pool here? Any planned neighborhood developments (good or bad) we should know about?
- What's the average days-on-market for RENTAL listings here right now (not sales)? A rising rental-DOM trend means longer vacancies and softer asking-rent achievability than the comps imply.
- What's the recent tenant-quality profile in this submarket — average credit score on applications, eviction rate, late-payment / NSF rate, and stable-employment percentage? A property-management company in the area should have these aggregated.
- How much new for-sale + rental construction is in the pipeline within 1–3 miles? Heavy new supply typically softens prices + rents 12–24 months out; constrained supply supports both.
Investment metrics
- 1% rule
- 0.78% ✗
- Cap rate
- 6.33%
- Cash-on-cash
- 0.14%
- DSCR
- 1.01
- GRM
- 10.7
CMA / ARV
- ARV (on-the-fly)
- $2,477,552
- Comps found
- 5
Show comp detail 5 sales within ~0.75 mi
| Address | Dist | Beds/Ba | Sqft | Sold | Price | $/sf | Match |
|---|---|---|---|---|---|---|---|
| 202 Broadway | 0.29mi | 5/3.0 | 4,302 (+7%) | 4mo | $2,650,000 | $616 | 65 |
| 190 Pond Xing | 0.61mi | 5/4.5 | 4,055 (+1%) | 7mo | $2,535,000 | $625 | 64 |
| 54 Barrett Rd | 0.44mi | 6/6.5 (+1) | 3,981 (-1%) | 10mo | $3,100,000 | $779 | 56 |
| 8 Sterling Pl | 0.48mi | 6/3.5 (+1) | 4,177 (+4%) | 10mo | $2,100,000 | $503 | 54 |
| 21 Bayberry Rd | 0.39mi | 6/3.5 (+1) | 3,968 (-1%) | 21mo | $1,625,000 | $410 | 53 |
Match score weights: distance 35% · size 25% · config 20% · recency 20%. Top-matched comps best support the ARV.
Projected returns pro-forma
10.0% appreciation · 3.0% rent growth · sell at horizon
- IRR
- 24.4%
- Equity multiple
- 2.95×
- Total profit
- $1,637,811
- Equity at exit
- $2,700,836
- IRR
- 21.6%
- Equity multiple
- 6.74×
- Total profit
- $4,816,211
- Equity at exit
- $5,824,455
Cash invested: $839,440 (down + closing). Projections, not guarantees.
Landlord ↔ Tenant lean methodology
- Overall (STATE)
- 15 Strongly Tenant-Friendly
- State New York
- 15 Strongly Tenant-Friendly · D+10
- County
- — inherits STATE
- City
- — inherits STATE
ZIP-level market 11559
- Home prices YoY
- 4.1%
- Active inventory
- 53
- Price-to-rent
- 10.7×
Monthly cashflow live
- Estimated rent
- $23,448 medium interval (Pro) →
- Mortgage (P&I)
- −$15,722
- Tax from tax record
- −$1,458 /mo · $17,490/yr
- Insurance
- −$1,249
- HOA
- −$0
- Vacancy / Maint / Mgmt
- −$4,924
- Net cashflow
- $95
Break-even live
UW: 25.0% down · 7.5% · 30yr · 1.5% tax · 5.0% vac · 8.0% maint · 8.0% mgmt
Financing live
Cash to close
- Down payment
- $749,500
- Closing costs
- $89,940
- Reserves months
- —
- Total cash needed
- —
Loan-product check · same deal, 3 products live
Conventional
25% down · 7.5% · 30yr
- Down + closing
- —
- Monthly P&I
- —
- Monthly cashflow
- —
- DSCR
- —
- Eligible?
- —
Personal DTI + credit; lowest rate.
DSCR
20% down · 8.5% · 30yr
- Down + closing
- —
- Monthly P&I
- —
- Monthly cashflow
- —
- DSCR
- —
- Eligible?
- —
No personal income docs; deal must DSCR.
Hard money
10% down · 12.0% · 12mo
- Down + closing
- —
- Monthly P&I
- —
- Monthly cashflow
- —
- DSCR
- —
- Eligible?
- —
Short-term bridge; refi at stabilization.
Rent comps 3 comps
| Address | Beds | Baths | Sqft | Rent | $/sqft | DOM | Units | Dist |
|---|---|---|---|---|---|---|---|---|
| 49 Harborview W Lawrence, NY | 4.0 | 4.5 | 3877 | $35,000 | $9.03 | 43d | 1 | 0.51mi |
| 486 Oxford Rd Cedarhurst, NY | 6.0 | 3.5 | 3465 | $8,000 | $2.31 | 2d | 1 | 1.17mi |
| 803 Barberry Ln Woodmere, NY | 6.0 | 3.5 | 4400 | $8,600 | $1.95 | 1d | 1 | 1.32mi |
Listing history 6 events
-
2026-06-07statusdays on market $2,998,000 Pending 8 DOM
-
2026-06-04days on market $2,998,000 Active 7 DOM
-
2026-06-03days on market $2,998,000 Active 6 DOM
-
2026-06-02days on market $2,998,000 Active 5 DOM
-
2026-06-01days on market $2,998,000 Active 4 DOM
-
2026-05-31days on market $2,998,000 Active 3 DOM
ⓘ Source: listings_history table (triggers on properties + properties_extension) + one-shot
backfill from property_details.listing_events for pre-trigger history.
Tax reassessment forecast NY · Partial reset (capped growth)
- Current annual tax
- $17,490 · $1,458/mo
- Projected year-2 tax
- $34,078 · $2,840/mo
- Expected delta
- +$16,588/yr (+$1,382/mo · 94.8%)
ⓘ Screening estimate from a state-policy table — verify with the county assessor before closing.
Climate risk First Street
- Flood 1/10 Low FEMA zone X (unshaded) · 0% chance over 30 yrs
- Wildfire 2/10 Low
- Heat 6/10 Major 7 d/yr ≥95°F today · 16 d/yr by 30 yrs out
- Wind 6/10 Major 77% chance of damaging wind over 30 yrs
- Air quality 4/10 Moderate 4 unhealthy d/yr today · 6 by 30 yrs out
Nearby sold comps map
Loading sold comps map…
Walkable amenities ~0.75 mi
Loading nearby amenities…
Taxation est. · year 1
- Rental income
- $281,376
- − Mortgage interest
- −$167,935
- − Property taxes
- −$17,490
- − Insurance
- −$14,990
- − Repairs & maintenance
- −$22,510
- − Management
- −$22,510
- − Depreciation
- −$87,215
- Taxable loss
- −$51,274
- Est. tax savings @ 24.0%
- +$12,306
- After-tax cash flow
- $13,450/yr
For passive investors: Depreciation is non-cash, so a rental often shows a tax loss while cash-flowing — sheltering income. Rental losses are passive: they offset passive income freely, and up to $25,000/yr can offset ordinary (W-2) income if you actively participate and your MAGI is under $100k (phasing out to $0 by $150k); unused losses carry forward. On sale, claimed depreciation is recaptured at up to 25%, and gains may owe capital-gains tax (a 1031 exchange can defer both). Figures are a year-1 estimate at your 24.0% rate — not tax advice; consult a CPA.
Schools (NCES district)
- District
- Lawrence Union Free School District
- NCES district ID
- 3616830
- Math proficiency
- 43% ▼ -2.00%
- Reading proficiency
- 46% ▼ -8.00%
- Median HH income
- $91,008
- Composite
- 42.14/100
- National rank
- #3307
- State rank
- #399 of 590 in NY
Livability — Lawrence
- Score
- 60/100
- State rank
- #981
- US rank
- #19168
Category grades
Schools grade is shown separately in the Schools card above.
Census & demographics
- Census place
- Lawrence, NY
- City population
- 9,130
- Population (ZIP)
- 9,130
Population outlook (Nassau County) Hauer SSP2
- Today (2025)
- 1,409,302 people
- By 2030
- 1,431,482 · +1.6%
- By 2040
- 1,471,607 · +4.4%
- By 2050
- 1,502,845 · +6.6%
- By 2075
- 1,575,403 · +11.8%
- By 2100
- 1,554,356 · +10.3%
Race, ethnicity, and origin ACS 2023
- Neighborhood character
- Predominantly White (76%)
- Race & ethnicity
- White 76% Hispanic / Latino 17% Black 5% Two or more races 2% Asian 2%
- Hispanic origin (detail)
- Puerto Rican 3% Dominican 2%
- Common ancestry
- Romanian 19% Slovak 3% Hispanic 3%
- Foreign-born
- 20% · Canada
- Languages at home
- 67% English-only · Spanish 11% French/Haitian/Cajun 4% Russian/Polish/Slavic 3%
Political lean MEDSL · Nassau
- 2024 margin
- Toss-up / Even · D 47.9% · R 52.1%
- 2008→2024 swing
- -12.6pp toward R · 2008: 8.4pp · 2024: -4.2pp
- All cycles
- 2024: R+4.2 2020: D+9.5 2016: D+5.3 2012: D+6.7 2008: D+8.4
Not yet ingested
- Civics
- —
Market trends
- HPI YoY
- ▲ 17.24%
- Current HPI
- 436.7253
- Rent YoY
- —
- Metro
- —
- State GDP YoY
- ▲ 2.60%
- F500 in state
- 92
Industry mix (Fortune 500 HQ in NY)
| Industry | F500 HQs | Revenue |
|---|---|---|
| Financial Services | 10 | $950B |
|
||
| Consumer Goods | 9 | $162B |
|
||
| Insurance | 4 | $225B |
|
||
| Telecommunications | 2 | $144B |
|
||
| Pharmaceuticals | 2 | $112B |
|
||
| Media / Entertainment | 2 | $69B |
|
||
Price history
+2120.7% since first listed4 events — show timeline
- 2026-05-28 Listed $2,998,000 OneKey® MLS as Distributed by MLS Grid
- 2015-08-31 Listing Removed — OneKey® MLS as Distributed by MLS Grid
- 2014-08-12 Listed $2,290,000 OneKey® MLS as Distributed by MLS Grid
- 1976-02-01 Sold (Public Records) $135,000 Public Records
Property tax history
+2.0%/yrLatest (2024): $17,490 · +8.7% YoY. Source: county tax records.
Cash-flow waterfall
monthlySold comps — $/sqft
last 12 mo · ≤1 miLoading sold comps…