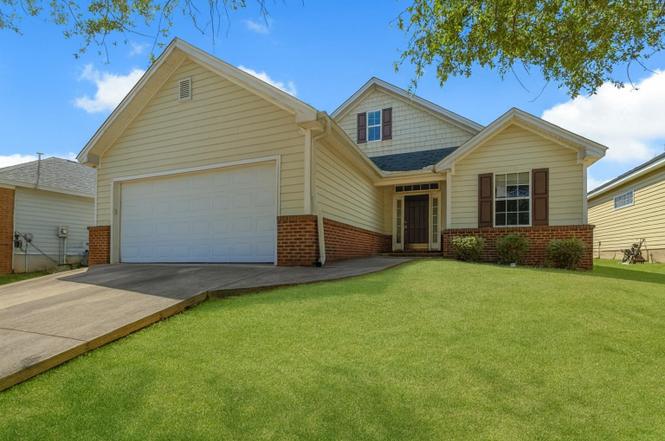
1845 Acorn Ridge Trl · Bradfordville, FL
Flood risk No data
- FEMA flood zone
- —
- Chance of flooding over 30 yrs
- —
- Est. flood insurance / yr
- —
Fire risk No data
- Est. fire insurance / yr
- —
Heat risk No data
- Hot days now (above threshold)
- —
- Hot days in 30 yrs
- —
Wind risk No data
- Chance of severe wind over 30 yrs
- —
Air-quality risk No data
- Unhealthy air days now
- —
- Unhealthy air days in 30 yrs
- —
Risk factors via First Street. Map © Google.
Why this score? — see what drove the D+ grade
The composite is a weighted blend of 9 inputs, each scored 0–100. Each bar is that input's sub-score; the figure is the points it added to the 100-point composite (weight × sub-score).
- ARV discount +15.0/15.0
- Cash flow +13.0/30.0
- Schools +4.3/10.0
- 1% rule +3.9/10.0
- DSCR +3.9/10.0
- Rent growth +3.0/5.0
- Livability +2.5/5.0
- Condition / age +2.5/5.0
- Appreciation +0.0/10.0
$300,000
🖨 Deal sheet (PDF) 📄 Offer letter ✓ Due diligence
Listing remarks
NEW PRICE! NEW GARAGE DOOR! Lovely home now available in Sable Chase: 1845 Acorn Ridge for just $310,000 features 4 bedrooms, 2 baths, an open concept and split floor plan, spacious kitchen, and a large primary suite with double sinks, garden tub, and shower. Includes a screened porch, 2-car garage, and is conveniently located right off Bannerman. Schedule your visit today!
Key facts
- Open concept
- Spacious kitchen
- Screened porch
Tags
Property features AI
Finance
- HOA & community: Monthly association fee of $130 covering common areas
Exterior
- Parking: 2-car garage (detached or attached not specified)
- Utilities: Paved road access
- Home design: Single-story; Brick construction; Slab foundation
- Construction: Brick construction; Slab foundation
- Exterior features: Porch; Screened porch
Interior
- Kitchen: Stove; Microwave; Dishwasher
- Bedrooms: Bedroom 2 (12x12); Bedroom 3 (11x10); Bedroom 4 (11x10)
- Flooring: Plank flooring; Tile flooring; Vinyl flooring
- Bathrooms: 2 full bathrooms
- Heating & cooling: Central heating; Electric heating; Fireplace(s) for heating; Central air conditioning; Electric cooling
- Interior features: Garden tub/Roman tub; Stall shower; Screened porch
Neighborhood map
What this means for you Summary
Snapshot
- This is a 4-bed/2.0-bath single-family listed at $300k.
Deal economics
- At list price, monthly cash flow is $-15 ($-181/yr) — negative.
- To cash-flow at today's rent, offer at most $297k (0.9% below list).
- To meet the 1% rule (rent ≥ 1% of price), the offer needs to be $267k (11.0% below list).
- Recommended offer: $264k (12.0% below list) — sets the bar for market timing.
- Cap rate 6.2% vs local median 3.0% in Bradfordville — top-decile yield for the area; either an underpriced asset or a hidden risk that comps aren't pricing in. Stress-test before assuming the spread holds.
Location & tenants
- Location reads: area grade D — affects rentability + tenant quality, not the cash-flow math above.
- Leon (urban): math 48% / reading 53% proficiency, ranked #33 of 73 in FL (top 45%) — acceptable for families but not a draw, mixed tenant base, ~2y average lease.
- Zoned schools: Killearn Lakes Elementary School (math 74% / reading 78%, grade A, #198 of 2,144 statewide, top 10%, 777 students, 17% FRL); Deerlake Middle School (math 81% / reading 73%, grade A, #28 of 571 statewide, top 5%, 894 students, 16% FRL); Lawton Chiles High School (math 62% / reading 72%, grade B, #69 of 667 statewide, top 11%, 1,900 students, 12% FRL) — zoned schools average 15% FRL vs 45% district-wide (30 pts lower); this property's tenant base skews higher-income than the district average.
- Zoned-school proficiency averages 73% at this address vs 50% district-wide (+23 pts) — the actual schools serving this property are materially stronger than the Leon average implies; a family-tenant draw the district grade alone would hide.
- Market conditions: Rents rising (+1.9%/yr); 192 active listings in the ZIP; 3 comparable units currently listed for rent nearby; rentals at typical pace (median 16d on market — plan ~3-4 weeks tenant-placement turnaround); high-income renter base; 1,765 units permitted in Leon County in 2024 (975 in 5+ unit buildings).
Forward outlook
- Local home prices are declining (-3.0%/yr); year-one equity from $2k of loan paydown is wiped out by about $9k of value loss. Plan a longer hold.
- Leon County population projected at +23% by 2050 — long-run rental-demand tailwind backs the buy-and-hold thesis.
Negotiation context
- It's been on market 264 days — a 12% lower offer ($264k) is reasonable based on typical stale-listing flexibility.
- 3 sale attempts; this cycle's ask has dropped $50k (14%) from the opening price — seller is motivated, your offer sets the floor, not the list.
Questions for the listing agent
- What do current leases actually rent for vs. the listed asking? Can we see a recent rent roll and the last 12 months of T-12 income?
- It's been on market 264 days. Have you received any prior offers? Is the seller open to a 12% concession, seller financing, or rate buy-down credit?
- What does the HOA fee cover, when was the last increase, and are there any pending special assessments or reserve-fund shortfalls?
- Why hasn't it sold? Are there any deal-killer items the seller is aware of (foundation, flood, title, zoning, code violations)?
- Is there a deadline driving the sale (1031 exchange, divorce, estate, relocation)? That informs how much negotiation room exists.
- The area grade is low — what's the realistic commute time and amenity access for the typical tenant pool here? Any planned neighborhood developments (good or bad) we should know about?
- What's the average days-on-market for RENTAL listings here right now (not sales)? A rising rental-DOM trend means longer vacancies and softer asking-rent achievability than the comps imply.
- What's the recent tenant-quality profile in this submarket — average credit score on applications, eviction rate, late-payment / NSF rate, and stable-employment percentage? A property-management company in the area should have these aggregated.
- How much new for-sale + rental construction is in the pipeline within 1–3 miles? Heavy new supply typically softens prices + rents 12–24 months out; constrained supply supports both.
Investment metrics
- 1% rule
- 0.89% ✗
- Cap rate
- 6.23%
- Cash-on-cash
- -0.22%
- DSCR
- 0.99
- GRM
- 9.4
CMA / ARV
- ARV (on-the-fly)
- $432,198
- Comps found
- 12
Show comp detail 12 sales within ~0.75 mi
| Address | Dist | Beds/Ba | Sqft | Sold | Price | $/sf | Match |
|---|---|---|---|---|---|---|---|
| 1841 Acorn Ridge Trl | 0.01mi | 4/2.0 | 1,759 (-5%) | 1mo | $325,000 | $185 | 91 |
| 1795 Acorn Ridge Trl | 0.12mi | 4/2.0 | 1,999 (+8%) | 3mo | $375,000 | $188 | 78 |
| 8760 Greenridge Ln | 0.27mi | 4/3.5 | 2,035 (+10%) | 1mo | $499,000 | $245 | 64 |
| 1442 Landon Hills Dr | 0.30mi | 3/2.5 (-1) | 1,622 (-12%) | 2mo | $401,234 | $247 | 57 |
| 1500 Summerbrooke Dr | 0.70mi | 3/2.5 (-1) | 1,873 (+1%) | 4mo | $535,508 | $286 | 54 |
| 1452 Summerbrooke Dr | 0.70mi | 3/2.5 (-1) | 1,873 (+1%) | 5mo | $521,509 | $278 | 54 |
| 1724 Broken Bow Trail Trl | 0.40mi | 5/3.0 (+1) | 2,098 (+14%) | 3mo | $340,000 | $162 | 47 |
| 1899 Folkstone Rd | 0.68mi | 3/2.0 (-1) | 1,648 (-11%) | 6mo | $332,000 | $201 | 41 |
| 8618 Milford Ct | 0.72mi | 3/2.0 (-1) | 1,617 (-12%) | 1mo | $350,000 | $216 | 40 |
| 7857 Briarcreek Rd | 0.72mi | 4/2.0 | 2,119 (+15%) | 2mo | $495,000 | $234 | 40 |
| 8312 Innsbrook Dr | 0.70mi | 3/2.0 (-1) | 1,628 (-12%) | 4mo | $350,000 | $215 | 39 |
| 1484 Summerbrooke Dr | 0.70mi | 4/3.5 | 2,055 (+11%) | 4mo | $563,244 | $274 | 39 |
Match score weights: distance 35% · size 25% · config 20% · recency 20%. Top-matched comps best support the ARV.
Projected returns pro-forma
-3.0% appreciation · 1.85% rent growth · sell at horizon
- IRR
- -18.0%
- Equity multiple
- 0.37×
- Total profit
- $-52,555
- Equity at exit
- $44,731
- IRR
- -12.5%
- Equity multiple
- 0.30×
- Total profit
- $-58,955
- Equity at exit
- $25,939
Cash invested: $84,000 (down + closing). Projections, not guarantees.
Landlord ↔ Tenant lean methodology
- Overall (STATE)
- 87 Strongly Landlord-Friendly
- State Florida
- 87 Strongly Landlord-Friendly · R+3
- County
- — inherits STATE
- City
- — inherits STATE
ZIP-level market 32312
- Rents YoY
- 1.9%
- Active inventory
- 192
- Price-to-rent
- 9.4×
Monthly cashflow live
- Estimated rent
- $2,670 medium interval (Pro) →
- Mortgage (P&I)
- −$1,573
- Tax from tax record
- −$415 /mo · $4,978/yr
- Insurance
- −$125
- HOA
- −$11
- Vacancy / Maint / Mgmt
- −$561
- Net cashflow
- $-15
Break-even live
Sensitivity live
| Price | -10% $155 | -5% $70 | +0% $-15 | +5% $-100 | +10% $-185 |
|---|---|---|---|---|---|
| Rent | -10% $-226 | -5% $-121 | +0% $-15 | +5% $90 | +10% $196 |
| Rate | -1.0pp $136 | -0.5pp $61 | base $-15 | +0.5pp $-93 | +1.0pp $-172 |
UW: 25.0% down · 7.5% · 30yr · 1.5% tax · 5.0% vac · 8.0% maint · 8.0% mgmt
Financing live
Cash to close
- Down payment
- $75,000
- Closing costs
- $9,000
- Reserves months
- —
- Total cash needed
- —
Loan-product check · same deal, 3 products live
Conventional
25% down · 7.5% · 30yr
- Down + closing
- —
- Monthly P&I
- —
- Monthly cashflow
- —
- DSCR
- —
- Eligible?
- —
Personal DTI + credit; lowest rate.
DSCR
20% down · 8.5% · 30yr
- Down + closing
- —
- Monthly P&I
- —
- Monthly cashflow
- —
- DSCR
- —
- Eligible?
- —
No personal income docs; deal must DSCR.
Hard money
10% down · 12.0% · 12mo
- Down + closing
- —
- Monthly P&I
- —
- Monthly cashflow
- —
- DSCR
- —
- Eligible?
- —
Short-term bridge; refi at stabilization.
Rent comps 3 comps
| Address | Beds | Baths | Sqft | Rent | $/sqft | DOM | Units | Dist |
|---|---|---|---|---|---|---|---|---|
| 8311 Hunters Ridge Trl Tallahassee, FL | 3.0 | 2.0 | 1400 | $2,399 | $1.71 | 15d | 1 | 0.32mi |
| 9306 Tuscany Dr Unit NA Tallahassee, FL | 3.0 | 2.0 | 1472 | $2,700 | $1.83 | 23d | 1 | 0.91mi |
| 7720 Bass Ridge Trl Tallahassee, FL | 3.0 | 2.0 | 1583 | $1,950 | $1.23 | 15d | 1 | 1.38mi |
HOA detail
- Monthly dues
- $11 · $132/yr
Listing history 26 events
-
2026-06-22days on market $300,000 Active 264 DOM
-
2026-06-18days on market $300,000 Active 261 DOM
-
2026-06-17days on market $300,000 Active 260 DOM
-
2026-06-16days on market $300,000 Active 259 DOM
-
2026-06-15days on market $300,000 Active 258 DOM
-
2026-06-14days on market $300,000 Active 256 DOM
-
2026-06-10days on market $300,000 Active 253 DOM
-
2026-06-09days on market $300,000 Active 252 DOM
-
2026-06-08days on market $300,000 Active 251 DOM
-
2026-06-07days on market $300,000 Active 250 DOM
-
2026-06-05days on market $300,000 Active 247 DOM
-
2026-06-03days on market $300,000 Active 246 DOM
-
2026-06-02days on market $300,000 Active 245 DOM
-
2026-06-01days on market $300,000 Active 244 DOM
-
2026-05-31days on market $300,000 Active 243 DOM
-
2026-05-30days on market $300,000 Active 242 DOM
-
2026-05-18price $300,000
-
2026-04-15price $310,000
-
2026-03-10price $320,000
-
2026-02-05price $330,000
-
2025-12-26status Active
-
2025-12-22historical
-
2025-12-07status Active
-
2025-12-07historical
-
2025-11-11price $340,000
-
2025-09-26$350,000 Active
ⓘ Source: listings_history table (triggers on properties + properties_extension) + one-shot
backfill from property_details.listing_events for pre-trigger history.
Tax reassessment forecast FL · Resets to sale price
- Current annual tax
- $4,978 · $415/mo
- Projected year-2 tax
- $4,978 · $415/mo
- Expected delta
- $0/yr ($0/mo · 0.0%)
ⓘ Screening estimate from a state-policy table — verify with the county assessor before closing.
Nearby sold comps map
Loading sold comps map…
Walkable amenities ~0.75 mi
Loading nearby amenities…
Taxation est. · year 1
- Rental income
- $32,035
- − Mortgage interest
- −$16,805
- − Property taxes
- −$4,978
- − Insurance
- −$1,500
- − Repairs & maintenance
- −$2,563
- − Management
- −$2,563
- − HOA
- −$132
- − Depreciation
- −$8,727
- Taxable loss
- −$5,232
- Est. tax savings @ 24.0%
- +$1,256
- After-tax cash flow
- $1,075/yr
For passive investors: Depreciation is non-cash, so a rental often shows a tax loss while cash-flowing — sheltering income. Rental losses are passive: they offset passive income freely, and up to $25,000/yr can offset ordinary (W-2) income if you actively participate and your MAGI is under $100k (phasing out to $0 by $150k); unused losses carry forward. On sale, claimed depreciation is recaptured at up to 25%, and gains may owe capital-gains tax (a 1031 exchange can defer both). Figures are a year-1 estimate at your 24.0% rate — not tax advice; consult a CPA.
Schools (NCES district)
- District
- Leon
- NCES district ID
- 1201110
- Math proficiency
- 48% ▼ -13.00%
- Reading proficiency
- 53% ▼ -5.00%
- Median HH income
- $46,339
- Composite
- 42.84/100
- National rank
- #3131
- State rank
- #33 of 73 in FL
Livability — Bradfordville
No livability data for this city. (Only ~50 U.S. cities are tracked.)
Census & demographics
- Census place
- Bradfordville, FL
- County
- Leon County · 294,472 people
- City population
- 31,966
- Metro
- Tallahassee, FL
- Population (ZIP)
- 32,216
- Household income
- $123,032
- Rent vs Own
- Severe rent burden
- 630.0
Population outlook (Leon County) Hauer SSP2
- Today (2025)
- 315,507 people
- By 2030
- 330,677 · +4.8%
- By 2040
- 358,465 · +13.6%
- By 2050
- 386,804 · +22.6%
- By 2075
- 465,480 · +47.5%
- By 2100
- 519,959 · +64.8%
Race, ethnicity, and origin ACS 2023
- Neighborhood character
- Predominantly White (75%)
- Race & ethnicity
- White 75% Black 11% Hispanic / Latino 6% Two or more races 5% Asian 5%
- Hispanic origin (detail)
- Mexican 2%
- Common ancestry
- Slovak 4% Italian 4% Serbian 2%
- Foreign-born
- 9% · Canada, China
- Languages at home
- 90% English-only · Spanish 3% Chinese 2% Other Asian/Pacific 1%
Political lean MEDSL · Leon
- 2024 margin
- Strong D (+21.8) · D 60.3% · R 38.5% · Other 1.2%
- 2008→2024 swing
- -2.5pp toward R · 2008: 24.3pp · 2024: 21.8pp
- All cycles
- 2024: D+21.8 2020: D+28.3 2016: D+25.1 2012: D+23.6 2008: D+24.3
Not yet ingested
- Civics
- —
Market trends
- HPI YoY
- ▼ -211.79%
- Current HPI
- 240.8961
- Rent YoY
- ▲ 1.85%
- Metro
- Tallahassee, FL
- State GDP YoY
- ▲ 3.28%
- F500 in state
- 36
Industry mix (Fortune 500 HQ in FL)
| Industry | F500 HQs | Revenue |
|---|---|---|
| Industrial Technology | 2 | $29B |
|
||
| Insurance | 2 | $17B |
|
||
| Retail | 1 | $60B |
|
||
| Technology Distribution | 1 | $58B |
|
||
| Homebuilding | 1 | $35B |
|
||
| Technology Manufacturing | 1 | $35B |
|
||
Price history
-14.3% since first listed10 events — show timeline
- 2026-05-18 Price Changed $300,000 CATRS
- 2026-04-15 Price Changed $310,000 CATRS
- 2026-03-10 Price Changed $320,000 CATRS
- 2026-02-05 Price Changed $330,000 CATRS
- 2025-12-26 Relisted — CATRS
- 2025-12-22 Listing Removed — CATRS
- 2025-12-07 Relisted — CATRS
- 2025-12-07 Listing Removed — CATRS
- 2025-11-11 Price Changed $340,000 CATRS
- 2025-09-26 Listed $350,000 CATRS
Cash-flow waterfall
monthlySold comps — $/sqft
last 12 mo · ≤1 miLoading sold comps…