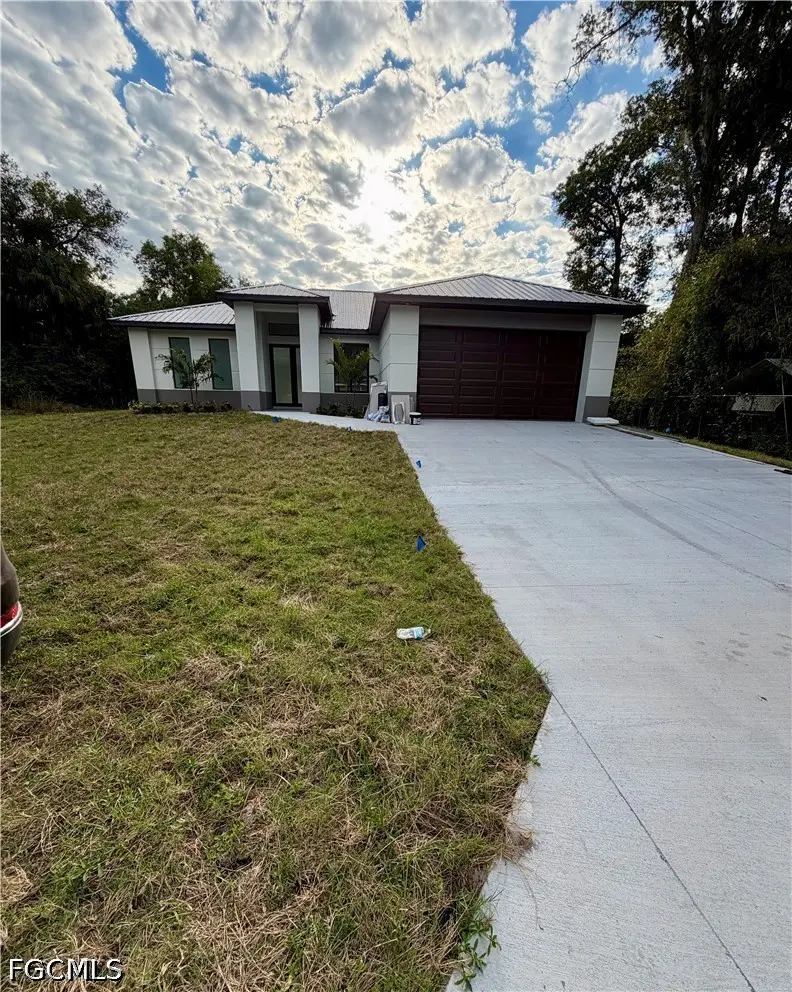
490 Christopher Ct · LaBelle, FL
Flood risk 4/10 · Minor
- FEMA flood zone
- AE
- Chance of flooding over 30 yrs
- 0.22%
- Est. flood insurance / yr
- $1,737 – $8,500
Fire risk 3/10 · Minor
- Est. fire insurance / yr
- $947 – $1,759
Heat risk 9/10 · Severe
- Hot days now (above 109°F)
- 7 days/yr
- Hot days in 30 yrs
- 24 days/yr
Wind risk 10/10 · Severe
- Chance of severe wind over 30 yrs
- 99.0%
Air-quality risk 2/10 · Minimal
- Unhealthy air days now
- 2 days/yr
- Unhealthy air days in 30 yrs
- 2 days/yr
Risk factors via First Street. Map © Google.
Why this score? — see what drove the F grade
The composite is a weighted blend of 9 inputs, each scored 0–100. Each bar is that input's sub-score; the figure is the points it added to the 100-point composite (weight × sub-score).
- Appreciation +10.0/10.0
- ARV discount +7.5/15.0
- Cash flow +4.3/30.0
- Livability +3.6/5.0
- Schools +3.1/10.0
- Rent growth +2.5/5.0
- Condition / age +2.5/5.0
- 1% rule +0.4/10.0
- DSCR +0.0/10.0
$374,900
🖨 Deal sheet 📄 Offer letter ✓ Due diligence
Listing remarks MLS
0.22 cleared located at the end of a cul-de-sac in Belmond Woods Subdivision within city limits. Build to suit. Central water and sewer. Don't miss this opportunity to build in a growing city with mild climate and sun year-round. Parks and shopping nearby as well ST RD 80/Hickpochee. Water hookup located right front of property.
Key facts
- Expansive driveway
- New construction
- No flood zone
Tags
Property features AI
Finance
- Financial info: Pets allowed
- HOA & community: Non-gated community; No association fee
Exterior
- Parking: Attached 2-car garage with garage door opener; 2 covered spaces
- Security: Security/high-impact doors; Smoke detector(s)
- Utilities: Public water; Septic tank sewer; Cable available; Municipal irrigation
- Home design: Single-story; New construction; Entry level 1; Faces south; Lot exposures to the north; Rectangular lot; Lot dimensions approximately 100 x 84 x 100 x 110
- Construction: Built with block, concrete and stucco; Metal roof; New construction
- Exterior features: Outdoor kitchen; Open porch; Porch; Security/high-impact doors; Smoke detectors
Interior
- Kitchen: Dishwasher; Microwave; Range; Refrigerator; Self-cleaning oven; Breakfast bar
- Bedrooms: Den; Great room
- Flooring: Concrete
- Bathrooms: 2 full bathrooms; Dual sinks; Shower only; Separate shower
- Heating & cooling: Central heating (electric); Central air conditioning (electric); Ceiling fans
- Interior features: Impact glass windows; Breakfast bar; Cathedral ceilings; Separate/formal dining room; Dual sinks; Separate shower; Shower only; Walk-in closet(s); Unfurnished
- Laundry & utility: Washer hookup; Dryer hookup; Laundry tub
Neighborhood map
What this means for you Summary
Snapshot
- This is a 3-bed/2.0-bath land listed at $375k.
Deal economics
- At list price, monthly cash flow is $-1k ($-17k/yr) — negative.
- To cash-flow at today's rent, offer at most $169k (54.9% below list).
- To meet the 1% rule (rent ≥ 1% of price), the offer needs to be $202k (46.2% below list).
- Recommended offer: $169k (54.9% below list) — sets the bar for cash-flow.
- Cap rate 3.1% vs local median 4.8% in LaBelle — below-typical yield; the buyer is paying a premium for something (appreciation thesis, condition, location) that the cap rate doesn't capture.
Location & tenants
- Location reads 72/100 on livability (#324 in FL) — a middle-class / working-renter tenant base. Strengths: cost of living A+, housing A+, health & safety A+; Watch: schools C-, commute F, employment F.
- Hendry (town): math 35% / reading 40% proficiency, ranked #65 of 73 in FL (top 89%) — families likely to look elsewhere, expect single-tenant / working-renter base with shorter leases; 75% free/reduced lunch — lower-income household profile, screen leases tightly.
- Market conditions: 942 active listings in the ZIP; 8 comparable units currently listed for rent nearby; rentals at typical pace (median 24d on market — plan ~3-4 weeks tenant-placement turnaround); 557 units permitted in Hendry County in 2024 (45 in 5+ unit buildings).
- This rent runs 42% of the median local income ($57k/yr) — at the standard rent-burdened threshold; future hikes will face affordability resistance.
Forward outlook
- In year one you build about $40k of equity ($3k loan paydown + $37k appreciation (10.0% local appreciation)).
- Hendry County population projected to shrink 7% by 2050 — rents likely to lag national; underwrite the cash flow, not the appreciation.
- By year 2, paydown + projected appreciation supports a ~$64k cash-out refi (75% LTV) — recoverable capital for the next deal without selling this one.
Negotiation context
- It's been on market 52 days — a 3% lower offer ($364k) is reasonable based on typical stale-listing flexibility.
- 4 sale attempts since 7y ago with the ask held roughly flat each time — persistent listings suggest the price (not the market) is what's stuck; bring a comps-based counter.
- Current owner paid $46k; list at $375k implies a 706% gain — meaningful room to come down on a strong offer.
Risks & watch-outs
- Watch-outs: flood insurance adds $427/mo.
- Climate carrying-cost: in FEMA flood zone AE (mandatory federal flood insurance); severe wind risk, 99% chance of damaging wind over 30y; extreme-heat days projected 7→24/yr by 2055 (HVAC capex compounding) — expect insurance premiums to compound above CPI over the hold.
Questions for the listing agent
- What do current leases actually rent for vs. the listed asking? Can we see a recent rent roll and the last 12 months of T-12 income?
- It's been on market 52 days. Have you received any prior offers? Is the seller open to a 55% concession, seller financing, or rate buy-down credit?
- What's the actual annual flood-insurance premium (NFIP or private), and is the property in a SFHA with mandatory coverage?
- Is there a deadline driving the sale (1031 exchange, divorce, estate, relocation)? That informs how much negotiation room exists.
- The area grade is low — what's the realistic commute time and amenity access for the typical tenant pool here? Any planned neighborhood developments (good or bad) we should know about?
- What's the average days-on-market for RENTAL listings here right now (not sales)? A rising rental-DOM trend means longer vacancies and softer asking-rent achievability than the comps imply.
- What's the recent tenant-quality profile in this submarket — average credit score on applications, eviction rate, late-payment / NSF rate, and stable-employment percentage? A property-management company in the area should have these aggregated.
- How much new for-sale + rental construction is in the pipeline within 1–3 miles? Heavy new supply typically softens prices + rents 12–24 months out; constrained supply supports both.
Investment metrics
- 1% rule
- 0.54% ✗
- Cap rate
- 3.10%
- Cash-on-cash
- -11.40%
- DSCR
- 0.49
- GRM
- 15.5
CMA / ARV
No comps found within radius.
Projected returns pro-forma
10.0% appreciation · 3.0% rent growth · sell at horizon
- IRR
- 13.0%
- Equity multiple
- 2.08×
- Total profit
- $113,813
- Equity at exit
- $337,740
- IRR
- 13.4%
- Equity multiple
- 4.88×
- Total profit
- $407,036
- Equity at exit
- $728,348
Cash invested: $104,972 (down + closing). Projections, not guarantees.
Landlord ↔ Tenant lean methodology
- Overall (STATE)
- 87 Strongly Landlord-Friendly
- State Florida
- 87 Strongly Landlord-Friendly · R+3
- County
- — inherits STATE
- City
- — inherits STATE
ZIP-level market 33935
- Home prices YoY
- 16.3%
- Active inventory
- 942
- Price-to-rent
- 15.5×
Monthly cashflow live
- Estimated rent
- $2,018 high interval (Pro) →
- Mortgage (P&I)
- −$1,966
- Tax est. 1.5%
- −$469 /mo · $5,624/yr
- Insurance
- −$156
- Flood insurance flood zone
- −$427 /mo · $5,118/yr
- HOA
- −$0
- Vacancy / Maint / Mgmt
- −$424
- Net cashflow
- $-1,423
Break-even live
UW: 25.0% down · 7.5% · 30yr · 1.5% tax · 5.0% vac · 8.0% maint · 8.0% mgmt
Financing live
Cash to close
- Down payment
- $93,725
- Closing costs
- $11,247
- Reserves months
- —
- Total cash needed
- —
Loan-product check · same deal, 3 products live
Conventional
25% down · 7.5% · 30yr
- Down + closing
- —
- Monthly P&I
- —
- Monthly cashflow
- —
- DSCR
- —
- Eligible?
- —
Personal DTI + credit; lowest rate.
DSCR
20% down · 8.5% · 30yr
- Down + closing
- —
- Monthly P&I
- —
- Monthly cashflow
- —
- DSCR
- —
- Eligible?
- —
No personal income docs; deal must DSCR.
Hard money
10% down · 12.0% · 12mo
- Down + closing
- —
- Monthly P&I
- —
- Monthly cashflow
- —
- DSCR
- —
- Eligible?
- —
Short-term bridge; refi at stabilization.
Rent comps 8 comps
| Address | Beds | Baths | Sqft | Rent | $/sqft | DOM | Units | Dist |
|---|---|---|---|---|---|---|---|---|
| 335 4th Ave Labelle, FL | 3.0 | 2.0 | 1710 | $2,000 | $1.17 | 23d | 1 | 0.21mi |
| 343 3rd Ave Labelle, FL | 3.0 | 2.0 | 1050 | $1,400 | $1.33 | 23d | 1 | 0.27mi |
| 345 3rd Ave LaBelle, FL | 3.0 | 2.0 | 1050 | $1,400 | $1.33 | 23d | 1 | 0.27mi |
| 184 Village Cir Labelle, FL | 2.0 | 2.0 | 1239 | $2,000 | $1.61 | 3d | 1 | 0.48mi |
| 174 Village Cir Labelle, FL | 2.0 | 2.0 | 1224 | $1,600 | $1.31 | 23d | 1 | 0.49mi |
| 878 Friendship Cir Labelle, FL | 3.0 | 2.0 | 1576 | $1,850 | $1.17 | 16d | 1 | 0.86mi |
| 858 Friendship Cir Labelle, FL | 3.0 | 2.0 | 1576 | $2,000 | $1.27 | 23d | 1 | 0.94mi |
| 3020 N Lakewood Rd Labelle, FL | 4.0 | 2.0 | 1499 | $1,950 | $1.30 | 23d | 1 | 1.48mi |
Listing history 26 events
-
2026-06-18days on market $374,900 Active 52 DOM
-
2026-06-17days on market $374,900 Active 51 DOM
-
2026-06-16days on market $374,900 Active 50 DOM
-
2026-06-15days on market $374,900 Active 49 DOM
-
2026-06-13days on market $374,900 Active 47 DOM
-
2026-06-13days on market $374,900 Active 46 DOM
-
2026-06-10days on market $374,900 Active 44 DOM
-
2026-06-09days on market $374,900 Active 43 DOM
-
2026-06-08days on market $374,900 Active 42 DOM
-
2026-06-07days on market $374,900 Active 41 DOM
-
2026-06-03days on market $374,900 Active 37 DOM
-
2026-06-02days on market $374,900 Active 36 DOM
-
2026-06-01days on market $374,900 Active 35 DOM
-
2026-05-31days on market $374,900 Active 34 DOM
-
2026-04-24$374,900 Active
-
2024-09-04soldstatus $46,500
-
2024-08-30soldstatus $46,500 Closed 330-char remark
Show marketing remark (330 chars)
0.22 cleared located at the end of a cul-de-sac in Belmond Woods Subdivision within city limits. Build to suit. Central water and sewer. Don't miss this opportunity to build in a growing city with mild climate and sun year-round. Parks and shopping nearby as well ST RD 80/Hickpochee. Water hookup located right front of property.
-
2024-08-06status Pending 330-char remark
Show marketing remark (330 chars)
0.22 cleared located at the end of a cul-de-sac in Belmond Woods Subdivision within city limits. Build to suit. Central water and sewer. Don't miss this opportunity to build in a growing city with mild climate and sun year-round. Parks and shopping nearby as well ST RD 80/Hickpochee. Water hookup located right front of property.
-
2024-07-10$60,000 Active 330-char remark
Show marketing remark (330 chars)
0.22 cleared located at the end of a cul-de-sac in Belmond Woods Subdivision within city limits. Build to suit. Central water and sewer. Don't miss this opportunity to build in a growing city with mild climate and sun year-round. Parks and shopping nearby as well ST RD 80/Hickpochee. Water hookup located right front of property.
-
2020-08-10soldstatus $14,000 Closed
-
2020-07-30status Pending
-
2020-04-16$18,000 Active
-
2020-01-24historical
-
2019-02-08$17,000 Active
-
2005-05-04soldstatus $35,000
-
2002-05-07soldstatus $36,000
ⓘ Source: listings_history table (triggers on properties + properties_extension) + one-shot
backfill from property_details.listing_events for pre-trigger history.
Climate risk First Street
- Flood 4/10 Moderate FEMA zone AE · 22% chance over 30 yrs
- Wildfire 3/10 Moderate
- Heat 9/10 Extreme 7 d/yr ≥109°F today · 24 d/yr by 30 yrs out
- Wind 10/10 Extreme 99% chance of damaging wind over 30 yrs
- Air quality 2/10 Low 2 unhealthy d/yr today · 2 by 30 yrs out
Nearby sold comps map
Loading sold comps map…
Walkable amenities ~0.75 mi
Loading nearby amenities…
Taxation est. · year 1
- Rental income
- $24,212
- − Mortgage interest
- −$21,000
- − Property taxes
- −$5,624
- − Insurance
- −$6,993
- − Repairs & maintenance
- −$1,937
- − Management
- −$1,937
- − Depreciation
- −$10,906
- Taxable loss
- −$24,185
- Est. tax savings @ 24.0%
- +$5,804
- After-tax cash flow
- $-11,277/yr
For passive investors: Depreciation is non-cash, so a rental often shows a tax loss while cash-flowing — sheltering income. Rental losses are passive: they offset passive income freely, and up to $25,000/yr can offset ordinary (W-2) income if you actively participate and your MAGI is under $100k (phasing out to $0 by $150k); unused losses carry forward. On sale, claimed depreciation is recaptured at up to 25%, and gains may owe capital-gains tax (a 1031 exchange can defer both). Figures are a year-1 estimate at your 24.0% rate — not tax advice; consult a CPA.
Schools (NCES district)
- District
- Hendry
- NCES district ID
- 1200780
- Math proficiency
- 35% ▼ -11.00%
- Reading proficiency
- 40% ▼ -4.00%
- Median HH income
- $37,043
- Composite
- 31.16/100
- National rank
- #6054
- State rank
- #65 of 73 in FL
Livability — LaBelle
- Score
- 72/100
- State rank
- #324
- US rank
- #5736
Category grades
Schools grade is shown separately in the Schools card above.
Census & demographics
- Census place
- LaBelle, FL
- County
- Hendry County · 23,186 people
- City population
- 23,186
- Metro
- Clewiston, FL
- Population (ZIP)
- 23,186
- Household income
- $57,009
- Rent vs Own
- Severe rent burden
- 498.0
Population outlook (Hendry County) Hauer SSP2
- Today (2025)
- 38,866 people
- By 2030
- 38,558 · -0.8%
- By 2040
- 37,743 · -2.9%
- By 2050
- 36,117 · -7.1%
- By 2075
- 30,070 · -22.6%
- By 2100
- 21,966 · -43.5%
Race, ethnicity, and origin ACS 2023
- Neighborhood character
- Majority Hispanic (56%)
- Race & ethnicity
- Hispanic / Latino 56% White 39% Two or more races 21% Black 2% Native American 2%
- Hispanic origin (detail)
- Mexican 40% Puerto Rican 3% Cuban 5%
- Common ancestry
- Lithuanian 2% Serbian 2% Slovak 1%
- Foreign-born
- 27% · Canada, Jamaica
- Languages at home
- 50% English-only · Spanish 50%
Political lean MEDSL · Hendry
- 2024 margin
- Solid R (+38.3) · D 30.4% · R 68.7%
- 2008→2024 swing
- -31.1pp toward R · 2008: -7.2pp · 2024: -38.3pp
- All cycles
- 2024: R+38.3 2020: R+23.0 2016: R+14.2 2012: R+5.9 2008: R+7.2
Not yet ingested
- Civics
- —
Market trends
- HPI YoY
- ▲ 75.20%
- Current HPI
- 537.4928
- Rent YoY
- —
- Metro
- Clewiston, FL
- State GDP YoY
- ▲ 3.28%
- F500 in state
- 36
Industry mix (Fortune 500 HQ in FL)
| Industry | F500 HQs | Revenue |
|---|---|---|
| Industrial Technology | 2 | $29B |
|
||
| Insurance | 2 | $17B |
|
||
| Retail | 1 | $60B |
|
||
| Technology Distribution | 1 | $58B |
|
||
| Homebuilding | 1 | $35B |
|
||
| Technology Manufacturing | 1 | $35B |
|
||
Price history
+941.4% since first listed12 events — show timeline
- 2026-04-24 Listed $374,900 FORTMLS
- 2024-09-04 Sold (Public Records) $46,500 Public Records
- 2024-08-30 Sold (MLS) $46,500 FORTMLS
- 2024-08-06 Pending — FORTMLS
- 2024-07-10 Listed $60,000 FORTMLS
- 2020-08-10 Sold (MLS) $14,000 FORTMLS
- 2020-07-30 Pending — FORTMLS
- 2020-04-16 Listed $18,000 FORTMLS
- 2020-01-24 Listing Removed — FORTMLS
- 2019-02-08 Listed $17,000 FORTMLS
- 2005-05-04 Sold (Public Records) $35,000 Public Records
- 2002-05-07 Sold (Public Records) $36,000 Public Records
Property tax history
+4.9%/yrLatest (2025): $647 · +32.3% YoY. Source: county tax records.
Cash-flow waterfall
monthlySold comps — $/sqft
last 12 mo · ≤1 miLoading sold comps…