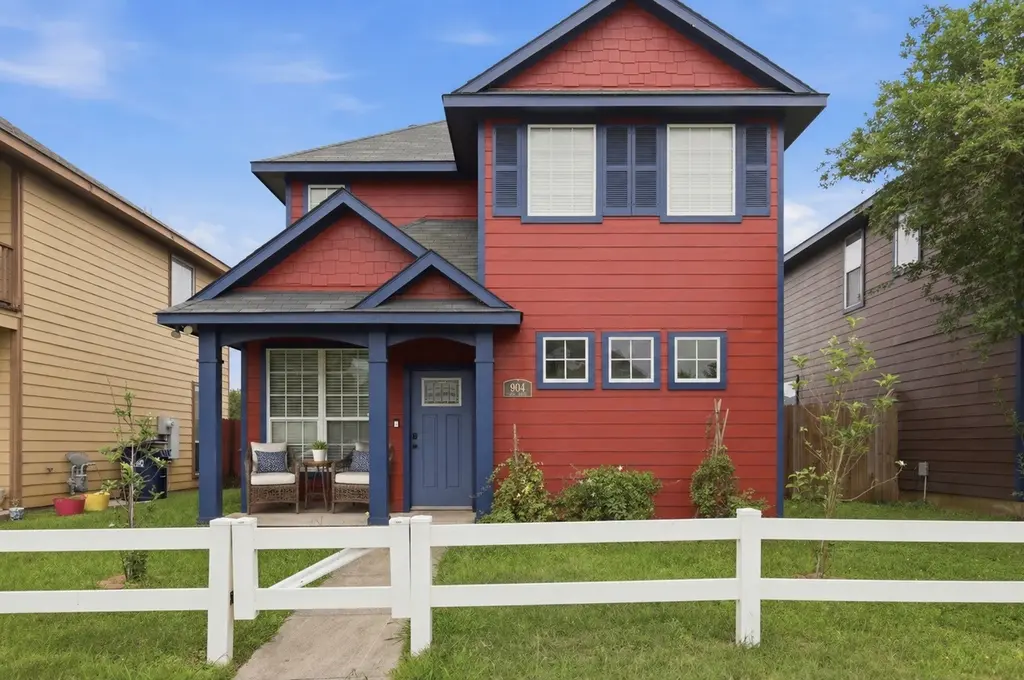
904 Eagle Ave · College Station, TX
Flood risk 1/10 · Minimal
- FEMA flood zone
- X (unshaded)
- Chance of flooding over 30 yrs
- 0.0%
- Est. flood insurance / yr
- $507 – $1,088
Fire risk 5/10 · Moderate
- Est. fire insurance / yr
- $1,222 – $2,270
Heat risk 8/10 · Major
- Hot days now (above 110°F)
- 7 days/yr
- Hot days in 30 yrs
- 24 days/yr
Wind risk 8/10 · Major
- Chance of severe wind over 30 yrs
- 91.0%
Air-quality risk 1/10 · Minimal
- Unhealthy air days now
- 0 days/yr
- Unhealthy air days in 30 yrs
- 0 days/yr
Risk factors via First Street. Map © Google.
Why this score? — see what drove the D- grade
The composite is a weighted blend of 9 inputs, each scored 0–100. Each bar is that input's sub-score; the figure is the points it added to the 100-point composite (weight × sub-score).
- ARV discount +10.9/15.0
- Cash flow +8.2/30.0
- Schools +4.7/10.0
- Livability +4.2/5.0
- Rent growth +3.3/5.0
- 1% rule +3.1/10.0
- Condition / age +2.5/5.0
- DSCR +2.2/10.0
- Appreciation +0.0/10.0
$270,000
🖨 Deal sheet 📄 Offer letter ✓ Due diligence
Listing remarks MLS
Nestled in one of College Station's most convenient locations, this home offers an impressive list of upgrades at an unbeatable price point. With the primary bedroom and a half bath downstairs, two bedrooms upstairs with a flexible bonus space, the layout makes great use of every square foot. The kitchen shines with brand-new stainless appliances and a recently remodeled half-bath adds a polished touch for guests. Step outside to a backyard designed for real life: a mix of patio, artificial turf, and grass gives you flexibility for entertaining, pets, or play and all with minimal upkeep. Green thumbs will love the raised garden beds and mature apple trees. This is the kind of centrally located, move-in-ready home that rarely comes available under $300,000, you don't want to miss it.
Key facts
- 3,576 sq ft lot
- Garage
- Built 2007
Property features AI
Finance
- HOA & community: Part of Westfield Village association; Annual association fee of $180
Exterior
- Parking: Attached garage (1 car)
- Utilities: Public water; Public sewer
- Home design: Residential property; Built in 2007; Slab foundation
- Construction: Composition roof
- Exterior features: Fenced backyard; Private yard; Subdivision setting
Interior
- Kitchen: Dishwasher; Disposal; Gas range; Microwave
- Bedrooms: Primary bedroom on the first floor; Two additional bedrooms on the second floor
- Flooring: Carpet; Plank flooring; Vinyl
- Bathrooms: 2 full bathrooms; 1 half bathroom
- Heating & cooling: Central heating (gas); Central air (electric)
- Interior features: Granite counters; Ceiling fans
- Laundry & utility: Washer hookup; Electric dryer hookup
Neighborhood map
What this means for you Summary
Snapshot
- This is a 3-bed/2.0-bath single-family listed at $270k.
Deal economics
- At list price, monthly cash flow is $-256 ($-3k/yr) — negative.
- To cash-flow at today's rent, offer at most $225k (16.7% below list).
- To meet the 1% rule (rent ≥ 1% of price), the offer needs to be $218k (19.3% below list).
- Recommended offer: $218k (19.3% below list) — sets the bar for 1% rule.
- Cap rate 5.2% vs local median 3.3% in College Station — top-decile yield for the area; either an underpriced asset or a hidden risk that comps aren't pricing in. Stress-test before assuming the spread holds.
Location & tenants
- Location reads 83/100 on livability (#11 in TX, #994 nationally) — a professional / high-income tenant draw. Strengths: amenities A+, commute A+, crime A-; Watch: employment C-.
- College Station ISD (urban): math 58% / reading 54% proficiency, ranked #113 of 826 in TX (top 14%) — acceptable for families but not a draw, mixed tenant base, ~2y average lease.
- Zoned schools: Creek View El (math 47% / reading 42%, grade F, #1,155 of 4,322 statewide, top 29%, 476 students, 55% FRL); College Station Middle (math 51% / reading 56%, grade C+, #275 of 1,662 statewide, top 17%, 645 students, 46% FRL); College Station H S (math 78% / reading 61%, grade B, #119 of 1,632 statewide, top 9%, 2,134 students, 35% FRL) — zoned schools average 45% FRL vs 24% district-wide (21 pts higher); higher-poverty schools than district average — tighter screening recommended.
- Market conditions: Rents rising (+3.1%/yr); 1168 active listings in the ZIP; 36 comparable units currently listed for rent nearby; rentals at typical pace (median 21d on market — plan ~3-4 weeks tenant-placement turnaround); 47% of comp listings sitting > 30 days — soft ceiling on asking rent; solid renter incomes; 2,211 units permitted in Brazos County in 2024 (768 in 5+ unit buildings).
Forward outlook
- Local home prices are declining (-3.0%/yr); year-one equity from $2k of loan paydown is wiped out by about $8k of value loss. Plan a longer hold.
- Brazos County population projected at +55% by 2050 — long-run rental-demand tailwind backs the buy-and-hold thesis.
Negotiation context
- It's been on market 49 days — a 3% lower offer ($262k) is reasonable based on typical stale-listing flexibility.
- 6 sale attempts since 12y ago with the ask held roughly flat each time — persistent listings suggest the price (not the market) is what's stuck; bring a comps-based counter.
Risks & watch-outs
- Climate carrying-cost: severe wind risk, 91% chance of damaging wind over 30y; moderate wildfire risk; extreme-heat days projected 7→24/yr by 2055 (HVAC capex compounding) — expect insurance premiums to compound above CPI over the hold.
Questions for the listing agent
- What do current leases actually rent for vs. the listed asking? Can we see a recent rent roll and the last 12 months of T-12 income?
- It's been on market 49 days. Have you received any prior offers? Is the seller open to a 19% concession, seller financing, or rate buy-down credit?
- What does the HOA fee cover, when was the last increase, and are there any pending special assessments or reserve-fund shortfalls?
- Is there a deadline driving the sale (1031 exchange, divorce, estate, relocation)? That informs how much negotiation room exists.
- Schools are B-rated — typically a magnet for longer-tenancy family renters. What's the average tenant stay here, and is there a school-zone premium baked into asking?
- The area grade is low — what's the realistic commute time and amenity access for the typical tenant pool here? Any planned neighborhood developments (good or bad) we should know about?
- What's the average days-on-market for RENTAL listings here right now (not sales)? A rising rental-DOM trend means longer vacancies and softer asking-rent achievability than the comps imply.
- What's the recent tenant-quality profile in this submarket — average credit score on applications, eviction rate, late-payment / NSF rate, and stable-employment percentage? A property-management company in the area should have these aggregated.
- How much new for-sale + rental construction is in the pipeline within 1–3 miles? Heavy new supply typically softens prices + rents 12–24 months out; constrained supply supports both.
Investment metrics
- 1% rule
- 0.81% ✗
- Cap rate
- 5.16%
- Cash-on-cash
- -4.06%
- DSCR
- 0.82
- GRM
- 10.3
CMA / ARV
- ARV (median comp)
- $292,117
- List price
- $270,000
- Delta
- -7.57%
- Verdict
- FAIR
- Comps
- 20 within 1.0 mi
Show comp detail 12 sales within ~0.75 mi
| Address | Dist | Beds/Ba | Sqft | Sold | Price | $/sf | Match |
|---|---|---|---|---|---|---|---|
| 3801 Snowdance Ct | 0.11mi | 3/2.0 | 1,704 (+6%) | 0mo | $335,000 | $197 | 85 |
| 3807 Snowdance Ct | 0.08mi | 3/2.0 | 1,508 (-6%) | 6mo | $295,000 | $196 | 81 |
| 14105 Renee Ln | 0.33mi | 3/2.0 | 1,745 (+8%) | 0mo | $380,000 | $218 | 70 |
| 904 Turtle Dove | 0.54mi | 3/2.0 | 1,596 (-1%) | 4mo | $314,000 | $197 | 70 |
| 3902 Bridgeberry Ct | 0.07mi | 3/2.0 | 1,851 (+15%) | 3mo | $300,000 | $162 | 70 |
| 600 Harvest Dr | 0.25mi | 3/2.0 | 1,428 (-11%) | 5mo | $309,000 | $216 | 65 |
| 1723 Creekside Cir | 0.64mi | 3/2.0 | 1,545 (-4%) | 1mo | $335,000 | $217 | 63 |
| 14107 Renee Ln | 0.34mi | 4/2.0 (+1) | 1,745 (+8%) | 5mo | $309,900 | $178 | 62 |
| 1303 Skyline Ct | 0.65mi | 3/2.0 | 1,683 (+4%) | 3mo | $317,000 | $188 | 60 |
| 905 Whitewing Ln | 0.58mi | 3/2.0 | 1,714 (+6%) | 3mo | $319,000 | $186 | 60 |
| 3729 Dove Crossing Ln | 0.71mi | 3/2.0 | 1,631 (+1%) | 8mo | $317,900 | $195 | 58 |
| 3618 Graz Dr | 0.73mi | 3/2.0 | 1,450 (-10%) | 1mo | $279,000 | $192 | 49 |
Match score weights: distance 35% · size 25% · config 20% · recency 20%. Top-matched comps best support the ARV.
Projected returns pro-forma
-3.0% appreciation · 3.13% rent growth · sell at horizon
- IRR
- -22.9%
- Equity multiple
- 0.21×
- Total profit
- $-59,660
- Equity at exit
- $40,258
- IRR
- -16.9%
- Equity multiple
- 0.06×
- Total profit
- $-71,350
- Equity at exit
- $23,345
Cash invested: $75,600 (down + closing). Projections, not guarantees.
Landlord ↔ Tenant lean methodology
- Overall (STATE)
- 87 Strongly Landlord-Friendly
- State Texas
- 87 Strongly Landlord-Friendly · R+5
- County
- — inherits STATE
- City
- — inherits STATE
ZIP-level market 77845
- Rents YoY
- 3.1%
- Active inventory
- 1168
- Price-to-rent
- 10.3×
Monthly cashflow live
- Estimated rent
- $2,178 high interval (Pro) →
- Mortgage (P&I)
- −$1,416
- Tax from tax record
- −$433 /mo · $5,194/yr
- Insurance
- −$112
- HOA
- −$15
- Vacancy / Maint / Mgmt
- −$457
- Net cashflow
- $-256
Break-even live
UW: 25.0% down · 7.5% · 30yr · 1.5% tax · 5.0% vac · 8.0% maint · 8.0% mgmt
Financing live
Cash to close
- Down payment
- $67,500
- Closing costs
- $8,100
- Reserves months
- —
- Total cash needed
- —
Loan-product check · same deal, 3 products live
Conventional
25% down · 7.5% · 30yr
- Down + closing
- —
- Monthly P&I
- —
- Monthly cashflow
- —
- DSCR
- —
- Eligible?
- —
Personal DTI + credit; lowest rate.
DSCR
20% down · 8.5% · 30yr
- Down + closing
- —
- Monthly P&I
- —
- Monthly cashflow
- —
- DSCR
- —
- Eligible?
- —
No personal income docs; deal must DSCR.
Hard money
10% down · 12.0% · 12mo
- Down + closing
- —
- Monthly P&I
- —
- Monthly cashflow
- —
- DSCR
- —
- Eligible?
- —
Short-term bridge; refi at stabilization.
Rent comps 36 comps
| Address | Beds | Baths | Sqft | Rent | $/sqft | DOM | Units | Dist |
|---|---|---|---|---|---|---|---|---|
| 3815 Snowdance Ct College Station, TX | 3.0 | 2.0 | 1654 | $2,100 | $1.27 | 43d | 1 | 0.06mi |
| 1002 Crested Point Dr College Station, TX | 3.0 | 2.0 | 1265 | $2,200 | $1.74 | 43d | 1 | 0.07mi |
| 1001 Fallbrook Loop College Station, TX | 3.0 | 2.0 | 1414 | $2,000 | $1.41 | 43d | 1 | 0.09mi |
| 916 Crested Point Dr College Station, TX | 3.0 | 2.0 | 1183 | $2,000 | $1.69 | 20d | 1 | 0.10mi |
| 3824 Springfield Dr Unit 1328078P College Station, TX | 3.0 | 2.0 | 1711 | $5,011 | $2.93 | 13d | 1 | 0.14mi |
| 1027 Fallbrook Loop College Station, TX | 3.0 | 2.0 | 1566 | $2,000 | $1.28 | 44d | 1 | 0.18mi |
| 1029 Fallbrook Loop College Station, TX | 3.0 | 2.0 | 1314 | $2,000 | $1.52 | 13d | 1 | 0.18mi |
| 2506 Leyla Ln College Station, TX | 4.0 | 2.0 | 1660 | $2,300 | $1.39 | 44d | 1 | 0.31mi |
| 2545 Leyla Ln College Station, TX | 4.0 | 3.0 | 1998 | $2,950 | $1.48 | 20d | 1 | 0.39mi |
| 2547 Leyla Ln College Station, TX | 3.0 | 2.5 | 1718 | $2,800 | $1.63 | 20d | 1 | 0.39mi |
| 114 Rugen Ln College Station, TX | 3.0 | 2.0 | 1627 | $2,200 | $1.35 | 43d | 1 | 0.43mi |
| 913 Delrey Dr College Station, TX | 4.0 | 2.5 | 2103 | $2,700 | $1.28 | 13d | 1 | 0.48mi |
| 3709 Oldenburg Ln College Station, TX | 3.0 | 3.0 | 1338 | $1,600 | $1.20 | 43d | 1 | 0.51mi |
| 903 Crepe Myrtle St College Station, TX | 3.0 | 3.0 | 1335 | $1,800 | $1.35 | 20d | 1 | 0.56mi |
| 144 Roucourt Loop College Station, TX | 3.0 | 2.0 | 1670 | $2,250 | $1.35 | 43d | 1 | 0.58mi |
| 922 Turtle Dove Trl College Station, TX | 4.0 | 3.0 | 1764 | $2,200 | $1.25 | 43d | 1 | 0.60mi |
| 1001 Emerald Dove Ave College Station, TX | 4.0 | 2.0 | 2180 | $2,380 | $1.09 | 43d | 1 | 0.61mi |
| 3608 Glenna Ct Unit 3610 College Station, TX | 3.0 | 2.0 | 1390 | $1,300 | $0.94 | 20d | 1 | 0.69mi |
| 3717 Dove Crossing Ln College Station, TX | 4.0 | 3.0 | 1692 | $2,100 | $1.24 | 43d | 1 | 0.71mi |
| 2802 Silver Oak Dr College Station, TX | 3.0 | 2.0 | 1353 | $1,950 | $1.44 | 43d | 1 | 0.79mi |
| 1407 Front Royal Dr College Station, TX | 3.0 | 2.0 | 1479 | $2,000 | $1.35 | 43d | 1 | 0.80mi |
| 438 William D Fitch Pkwy College Station, TX | 3.0 | 2.5 | 1836 | $2,900 | $1.58 | 13d | 1 | 0.89mi |
| 1505 Richland Ct N College Station, TX | 4.0 | 2.0 | 1610 | $2,250 | $1.40 | 20d | 1 | 0.90mi |
| 1202 Harrisonburg Ln College Station, TX | 4.0 | 2.0 | 1915 | $2,500 | $1.31 | 43d | 1 | 0.92mi |
| 4009 Hunter Creek Dr College Station, TX | 4.0 | 2.0 | 1787 | $2,000 | $1.12 | 20d | 1 | 1.04mi |
| 1216 Bridgewater Dr College Station, TX | 4.0 | 2.5 | 2187 | $2,450 | $1.12 | 13d | 1 | 1.11mi |
| 4011 Windswept Dr College Station, TX | 3.0 | 2.0 | 1314 | $2,000 | $1.52 | 43d | 1 | 1.18mi |
| 2301 Norham Dr College Station, TX | 3.0 | 2.0 | 1411 | $2,250 | $1.59 | 13d | 1 | 1.21mi |
| 4011 Texas 6 Frontage Rd College Station, TX | 2.0 | 2.0 | 1107 | $1,100 | $0.99 | 43d | 1 | 1.23mi |
| 3904 Brownway Ct College Station, TX | 4.0 | 2.0 | 1740 | $2,650 | $1.52 | 44d | 1 | 1.29mi |
| 4232 Rocky Rhodes Dr College Station, TX | 4.0 | 2.0 | 1818 | $2,600 | $1.43 | 13d | 1 | 1.32mi |
| 4307 Spring Hill Dr College Station, TX | 3.0 | 3.0 | 1882 | $2,200 | $1.17 | 20d | 1 | 1.39mi |
| 2515 Warkworth Ln College Station, TX | 3.0 | 2.0 | 1973 | $720 | $0.36 | 13d | 1 | 1.41mi |
| 4340 Decatur Dr College Station, TX | 1.0–2.0 | 1.0–2.0 | 895 | $1,760 | $1.97 | 1d | 53 | 1.43mi |
| 3013 Normand Dr College Station, TX | 3.0 | 1.5 | 1479 | $1,600 | $1.08 | 13d | 1 | 1.47mi |
| 156 Sunset Trl College Station, TX | 4.0 | 2.0 | 1474 | $1,999 | $1.36 | 20d | 1 | 1.48mi |
HOA detail
- Monthly dues
- $15 · $180/yr
Listing history 25 events
-
2026-06-18days on market $270,000 Active 49 DOM
-
2026-06-17days on market $270,000 Active 48 DOM
-
2026-06-16days on market $270,000 Active 47 DOM
-
2026-06-15days on market $270,000 Active 46 DOM
-
2026-06-14days on market $270,000 Active 44 DOM
-
2026-06-13days on market $270,000 Active 43 DOM
-
2026-06-10days on market $270,000 Active 41 DOM
-
2026-06-09days on market $270,000 Active 40 DOM
-
2026-06-08days on market $270,000 Active 39 DOM
-
2026-06-07days on market $270,000 Active 38 DOM
-
2026-06-05days on market $270,000 Active 35 DOM
-
2026-06-02days on market $270,000 Active 33 DOM
-
2026-06-01days on market $270,000 Active 32 DOM
-
2026-05-31days on market $270,000 Active 31 DOM
-
2026-05-30days on market $270,000 Active 30 DOM
-
2026-04-30$270,000 Active 793-char remark
Show marketing remark (793 chars)
Nestled in one of College Station's most convenient locations, this home offers an impressive list of upgrades at an unbeatable price point. With the primary bedroom and a half bath downstairs, two bedrooms upstairs with a flexible bonus space, the layout makes great use of every square foot. The kitchen shines with brand-new stainless appliances and a recently remodeled half-bath adds a polished touch for guests. Step outside to a backyard designed for real life: a mix of patio, artificial turf, and grass gives you flexibility for entertaining, pets, or play and all with minimal upkeep. Green thumbs will love the raised garden beds and mature apple trees. This is the kind of centrally located, move-in-ready home that rarely comes available under $300,000, you don't want to miss it.
-
2020-06-23soldstatus
-
2020-06-22soldstatus
-
2020-04-22$189,900
-
2015-01-15soldstatus
-
2015-01-12soldstatus
-
2014-07-24$150,000
-
2014-06-30$150,000
-
2014-01-22$150,000
ⓘ Source: listings_history table (triggers on properties + properties_extension) + one-shot
backfill from property_details.listing_events for pre-trigger history.
Tax reassessment forecast TX · Resets to sale price
- Current annual tax
- $5,194 · $433/mo
- Projected year-2 tax
- $5,194 · $433/mo
- Expected delta
- $0/yr ($0/mo · 0.0%)
ⓘ Screening estimate from a state-policy table — verify with the county assessor before closing.
Climate risk First Street
- Flood 1/10 Low FEMA zone X (unshaded) · 0% chance over 30 yrs
- Wildfire 5/10 Major
- Heat 8/10 Severe 7 d/yr ≥110°F today · 24 d/yr by 30 yrs out
- Wind 8/10 Severe 91% chance of damaging wind over 30 yrs
- Air quality 1/10 Low 0 unhealthy d/yr today · 0 by 30 yrs out
Nearby sold comps map
Loading sold comps map…
Walkable amenities ~0.75 mi
Loading nearby amenities…
Taxation est. · year 1
- Rental income
- $26,133
- − Mortgage interest
- −$15,124
- − Property taxes
- −$5,194
- − Insurance
- −$1,350
- − Repairs & maintenance
- −$2,091
- − Management
- −$2,091
- − HOA
- −$180
- − Depreciation
- −$7,855
- Taxable loss
- −$7,751
- Est. tax savings @ 24.0%
- +$1,860
- After-tax cash flow
- $-1,210/yr
For passive investors: Depreciation is non-cash, so a rental often shows a tax loss while cash-flowing — sheltering income. Rental losses are passive: they offset passive income freely, and up to $25,000/yr can offset ordinary (W-2) income if you actively participate and your MAGI is under $100k (phasing out to $0 by $150k); unused losses carry forward. On sale, claimed depreciation is recaptured at up to 25%, and gains may owe capital-gains tax (a 1031 exchange can defer both). Figures are a year-1 estimate at your 24.0% rate — not tax advice; consult a CPA.
Schools (NCES district)
- District
- College Station ISD
- NCES district ID
- 4807350
- Math proficiency
- 58% ▼ -4.00%
- Reading proficiency
- 54% ▼ -2.00%
- Median HH income
- $36,991
- Composite
- 46.54/100
- National rank
- #2428
- State rank
- #113 of 826 in TX
Livability — College Station
- Score
- 83/100
- State rank
- #11
- US rank
- #994
Category grades
Schools grade is shown separately in the Schools card above.
Census & demographics
- Census place
- College Station, TX
- County
- Brazos County · 233,400 people
- City population
- 131,628
- Metro
- College Station-Bryan, TX
- Population (ZIP)
- 76,764
- Household income
- $88,851
- Rent vs Own
- Severe rent burden
- 3329.0
Population outlook (Brazos County) Hauer SSP2
- Today (2025)
- 267,942 people
- By 2030
- 296,630 · +10.7%
- By 2040
- 354,560 · +32.3%
- By 2050
- 414,616 · +54.7%
- By 2075
- 562,158 · +109.8%
- By 2100
- 678,828 · +153.3%
Race, ethnicity, and origin ACS 2023
- Neighborhood character
- Predominantly White (69%)
- Race & ethnicity
- White 69% Hispanic / Latino 16% Two or more races 9% Asian 8% Black 5%
- Hispanic origin (detail)
- Mexican 12%
- Common ancestry
- Lithuanian 2% Romanian 2% Italian 2%
- Foreign-born
- 11% · Canada, China, South Korea
- Languages at home
- 83% English-only · Spanish 8% Other Indo-European 3% Chinese 2%
Political lean MEDSL · Brazos
- 2024 margin
- Strong R (+24.9) · D 36.9% · R 61.7% · Other 1.4%
- 2008→2024 swing
- +4.1pp toward D · 2008: -28.9pp · 2024: -24.9pp
- All cycles
- 2024: R+24.9 2020: R+14.3 2016: R+23.7 2012: R+35.3 2008: R+28.9
Not yet ingested
- Civics
- —
Market trends
- HPI YoY
- ▼ -133.31%
- Current HPI
- 175.9669
- Rent YoY
- ▲ 3.13%
- Metro
- College Station-Bryan, TX
- State GDP YoY
- ▲ 3.95%
- F500 in state
- 110
Industry mix (Fortune 500 HQ in TX)
| Industry | F500 HQs | Revenue |
|---|---|---|
| Energy | 16 | $1,198B |
|
||
| Technology | 5 | $198B |
|
||
| Engineering / Construction | 4 | $72B |
|
||
| Energy Services | 3 | $60B |
|
||
| Utilities | 3 | $41B |
|
||
| Healthcare | 2 | $330B |
|
||
Price history
+80.0% since first listed10 events — show timeline
- 2026-04-30 Listed $270,000 HARMLS
- 2026-04-30 Listed $270,000 BCSRMLS
- 2020-06-23 Sold (Public Records) — Public Records
- 2020-06-22 Sold (MLS) — BCSRMLS
- 2020-04-22 Listed $189,900 BCSRMLS
- 2015-01-15 Sold (Public Records) — Public Records
- 2015-01-12 Sold (MLS) — BCSRMLS
- 2014-07-24 Listed $150,000 BCSRMLS
- 2014-06-30 Listed $150,000 BCSRMLS
- 2014-01-22 Listed $150,000 BCSRMLS
Property tax history
+4.8%/yrLatest (2025): $5,194 · -1.0% YoY. Source: county tax records.
Cash-flow waterfall
monthlySold comps — $/sqft
last 12 mo · ≤1 miLoading sold comps…