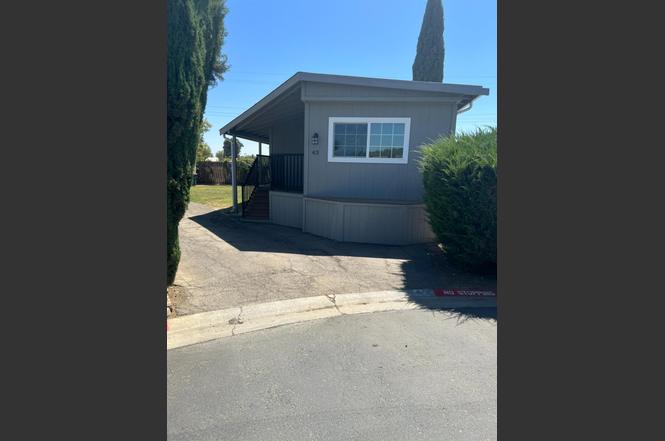
14530 Byron Hwy #43 · Byron, CA
Flood risk 6/10 · Moderate
- FEMA flood zone
- X (shaded)
- Chance of flooding over 30 yrs
- 0.72%
- Est. flood insurance / yr
- $507 – $1,088
Fire risk 7/10 · Major
- Est. fire insurance / yr
- $659 – $1,223
Heat risk 6/10 · Moderate
- Hot days now (above 102°F)
- 7 days/yr
- Hot days in 30 yrs
- 14 days/yr
Wind risk 1/10 · Minimal
- Chance of severe wind over 30 yrs
- —
Air-quality risk 9/10 · Severe
- Unhealthy air days now
- 20 days/yr
- Unhealthy air days in 30 yrs
- 21 days/yr
Risk factors via First Street. Map © Google.
Why this score? — see what drove the C- grade
The composite is a weighted blend of 9 inputs, each scored 0–100. Each bar is that input's sub-score; the figure is the points it added to the 100-point composite (weight × sub-score).
- Cash flow +16.6/30.0
- ARV discount +6.5/15.0
- Appreciation +5.8/10.0
- DSCR +5.1/10.0
- Schools +5.0/10.0
- 1% rule +4.5/10.0
- Rent growth +2.5/5.0
- Livability +2.5/5.0
- Condition / age +2.5/5.0
$178,900
🖨 Deal sheet 📄 Offer letter ✓ Due diligence
Listing remarks MLS
Nice cozy home located in a family park. Well maintained 2 bdrm, 1.5 bath, with pop out. Huge lot with long driveway, play area and garden. Covered patio. Close to schools. Hurry, won't last long.
Key facts
- Play area
- Renovated outside
- Wood shed
Tags
Property features AI
Finance
- HOA & community: No homeowners association; Not a senior community; Land lease: no (listed land lease amount present but not included per exclusions)
Exterior
- Parking: Assigned parking (no garage)
- Utilities: Public water; Private sewer
- Home design: Manufactured home in park (single wide); Single-story (manufactured); Built in 1971; Updated/Remodeled condition
- Construction: Composition roof; Wood skirting; Manufactured (FUQUA make)
- Exterior features: Storage shed(s); Other lot features
Interior
- Kitchen: Stone countertops; Free-standing gas range; Free-standing refrigerator; Dishwasher; Microwave; Dining space in kitchen
- Bedrooms: 3 bedrooms
- Flooring: Laminate flooring
- Bathrooms: 1 full bathroom with tub/shower over
- Heating & cooling: Central heating; Central cooling; Ceiling fans
- Interior features: Updated/remodeled interior; Covered patio and porch; Storage area (interior/exterior)
- Laundry & utility: Washer/dryer hookups only; 220-volt outlet in laundry
Neighborhood map
What this means for you Summary
Snapshot
- This is a 3-bed/1.0-bath manufactured listed at $179k.
Deal economics
- At list price, monthly cash flow is $108 ($1k/yr) — positive.
- The deal already cash-flows at list — no discount required.
- To meet the 1% rule (rent ≥ 1% of price), the offer needs to be $170k (4.9% below list).
- Recommended offer: $157k (12.0% below list) — sets the bar for market timing.
Location & tenants
- Location reads 50/100 on livability (#1,139 in CA) — a working-class tenant base; expect higher turnover. Strengths: crime A+, employment A-, housing B; Watch: schools D+, amenities F, commute F.
- Liberty Union High (suburban): math 36% / reading 69% proficiency, ranked #320 of 1,400 in CA (top 23%) — acceptable for families but not a draw, mixed tenant base, ~2y average lease.
- Market conditions: 13 active listings in the ZIP; 2,169 units permitted in Contra Costa County in 2024 (896 in 5+ unit buildings).
Forward outlook
- In year one you build about $4k of equity ($1k loan paydown + $3k appreciation (1.6% local appreciation)).
- Contra Costa County population projected at +26% by 2050 — long-run rental-demand tailwind backs the buy-and-hold thesis.
- At projected returns (1.6% appreciation + 3.0% rent growth), your $50k cash investment doubles in ~7 years — after that, you're playing with house money.
- By year 8, paydown + projected appreciation supports a ~$32k cash-out refi (75% LTV) — recoverable capital for the next deal without selling this one.
Negotiation context
- It's been on market 306 days — a 12% lower offer ($157k) is reasonable based on typical stale-listing flexibility.
- 2 sale attempts since 18y ago; this cycle's ask is 616% above the opening price — seller raised mid-cycle; expect resistance to lowballs.
- Current owner paid $18k; list at $179k implies a 894% gain — meaningful room to come down on a strong offer.
Risks & watch-outs
- Climate carrying-cost: major flood risk; major wildfire risk; extreme-heat days projected 7→14/yr by 2055 (HVAC capex compounding) — expect insurance premiums to compound above CPI over the hold.
Questions for the listing agent
- It's been on market 306 days. Have you received any prior offers? Is the seller open to a 12% concession, seller financing, or rate buy-down credit?
- Built in 1971 — when were the roof, HVAC, electrical panel, plumbing, and water heater last replaced?
- Why hasn't it sold? Are there any deal-killer items the seller is aware of (foundation, flood, title, zoning, code violations)?
- Is there a deadline driving the sale (1031 exchange, divorce, estate, relocation)? That informs how much negotiation room exists.
- Schools are D-rated, which usually means shorter tenancies and higher turnover. Who's the typical renter profile here, and what's been the actual vacancy rate?
- What's the average days-on-market for RENTAL listings here right now (not sales)? A rising rental-DOM trend means longer vacancies and softer asking-rent achievability than the comps imply.
- What's the recent tenant-quality profile in this submarket — average credit score on applications, eviction rate, late-payment / NSF rate, and stable-employment percentage? A property-management company in the area should have these aggregated.
- How much new for-sale + rental construction is in the pipeline within 1–3 miles? Heavy new supply typically softens prices + rents 12–24 months out; constrained supply supports both.
Investment metrics
- 1% rule
- 0.95% ✗
- Cap rate
- 7.02%
- Cash-on-cash
- 2.58%
- DSCR
- 1.11
- GRM
- 8.8
CMA / ARV
- ARV (on-the-fly)
- $175,200
- Comps found
- 1
Show comp detail 1 sale within ~0.75 mi
| Address | Dist | Beds/Ba | Sqft | Sold | Price | $/sf | Match |
|---|---|---|---|---|---|---|---|
| 14530 Byron Hwy #44 | 0.00mi | 2/1.0 (-1) | 800 (0%) | 21mo | $175,500 | $219 | 78 |
Match score weights: distance 35% · size 25% · config 20% · recency 20%. Top-matched comps best support the ARV.
Projected returns pro-forma
1.63% appreciation · 3.0% rent growth · sell at horizon
- IRR
- 6.0%
- Equity multiple
- 1.32×
- Total profit
- $15,848
- Equity at exit
- $67,046
- IRR
- 9.7%
- Equity multiple
- 2.27×
- Total profit
- $63,436
- Equity at exit
- $93,915
Cash invested: $50,092 (down + closing). Projections, not guarantees.
Landlord ↔ Tenant lean methodology
- Overall (STATE)
- 18 Strongly Tenant-Friendly
- State California
- 18 Strongly Tenant-Friendly · D+13
- County
- — inherits STATE
- City
- — inherits STATE
ZIP-level market 94514
- Home prices YoY
- 1.1%
- Active inventory
- 13
- Price-to-rent
- 8.8×
Monthly cashflow live
- Estimated rent
- $1,701 medium interval (Pro) →
- Mortgage (P&I)
- −$938
- Tax est. 1.5%
- −$224 /mo · $2,684/yr
- Insurance
- −$75
- HOA
- −$0
- Vacancy / Maint / Mgmt
- −$357
- Net cashflow
- $108
Break-even live
UW: 25.0% down · 7.5% · 30yr · 1.5% tax · 5.0% vac · 8.0% maint · 8.0% mgmt
Financing live
Cash to close
- Down payment
- $44,725
- Closing costs
- $5,367
- Reserves months
- —
- Total cash needed
- —
Loan-product check · same deal, 3 products live
Conventional
25% down · 7.5% · 30yr
- Down + closing
- —
- Monthly P&I
- —
- Monthly cashflow
- —
- DSCR
- —
- Eligible?
- —
Personal DTI + credit; lowest rate.
DSCR
20% down · 8.5% · 30yr
- Down + closing
- —
- Monthly P&I
- —
- Monthly cashflow
- —
- DSCR
- —
- Eligible?
- —
No personal income docs; deal must DSCR.
Hard money
10% down · 12.0% · 12mo
- Down + closing
- —
- Monthly P&I
- —
- Monthly cashflow
- —
- DSCR
- —
- Eligible?
- —
Short-term bridge; refi at stabilization.
Listing history 21 events
-
2026-06-18days on market $178,900 Active 306 DOM
-
2026-06-17days on market $178,900 Active 305 DOM
-
2026-06-16days on market $178,900 Active 304 DOM
-
2026-06-15days on market $178,900 Active 303 DOM
-
2026-06-13days on market $178,900 Active 301 DOM
-
2026-06-13days on market $178,900 Active 300 DOM
-
2026-06-10days on market $178,900 Active 298 DOM
-
2026-06-09days on market $178,900 Active 297 DOM
-
2026-06-08days on market $178,900 Active 296 DOM
-
2026-06-07days on market $178,900 Active 295 DOM
-
2026-06-04days on market $178,900 Active 292 DOM
-
2026-06-03days on market $178,900 Active 291 DOM
-
2026-06-02days on market $178,900 Active 290 DOM
-
2026-06-01days on market $178,900 Active 289 DOM
-
2026-05-31days on market $178,900 Active 288 DOM
-
2010-10-14historical
-
2010-06-30price Price Change
-
2010-05-04New
-
2008-10-27soldstatus $18,000 201-char remark
Show marketing remark (201 chars)
Nice cozy home located in a family park. Well maintained 2 bdrm, 1.5 bath, with pop out. Huge lot with long driveway, play area and garden. Covered patio. Close to schools. Hurry, won't last long.
-
2008-09-24historical 201-char remark
Show marketing remark (201 chars)
Nice cozy home located in a family park. Well maintained 2 bdrm, 1.5 bath, with pop out. Huge lot with long driveway, play area and garden. Covered patio. Close to schools. Hurry, won't last long.
-
2008-08-01$25,000 201-char remark
Show marketing remark (201 chars)
Nice cozy home located in a family park. Well maintained 2 bdrm, 1.5 bath, with pop out. Huge lot with long driveway, play area and garden. Covered patio. Close to schools. Hurry, won't last long.
ⓘ Source: listings_history table (triggers on properties + properties_extension) + one-shot
backfill from property_details.listing_events for pre-trigger history.
Climate risk First Street
- Flood 6/10 Major FEMA zone X (shaded) · 72% chance over 30 yrs
- Wildfire 7/10 Severe
- Heat 6/10 Major 7 d/yr ≥102°F today · 14 d/yr by 30 yrs out
- Wind 1/10 Low
- Air quality 9/10 Extreme 20 unhealthy d/yr today · 21 by 30 yrs out
Nearby sold comps map
Loading sold comps map…
Walkable amenities ~0.75 mi
Loading nearby amenities…
Taxation est. · year 1
- Rental income
- $20,417
- − Mortgage interest
- −$10,021
- − Property taxes
- −$2,684
- − Insurance
- −$894
- − Repairs & maintenance
- −$1,633
- − Management
- −$1,633
- − Depreciation
- −$5,204
- Taxable loss
- −$1,654
- Est. tax savings @ 24.0%
- +$397
- After-tax cash flow
- $1,690/yr
For passive investors: Depreciation is non-cash, so a rental often shows a tax loss while cash-flowing — sheltering income. Rental losses are passive: they offset passive income freely, and up to $25,000/yr can offset ordinary (W-2) income if you actively participate and your MAGI is under $100k (phasing out to $0 by $150k); unused losses carry forward. On sale, claimed depreciation is recaptured at up to 25%, and gains may owe capital-gains tax (a 1031 exchange can defer both). Figures are a year-1 estimate at your 24.0% rate — not tax advice; consult a CPA.
Schools (NCES district)
- District
- Liberty Union High
- NCES district ID
- 0621600
- Math proficiency
- 36% ▲ 5.00%
- Reading proficiency
- 69% ▲ 12.00%
- Median HH income
- $87,001
- Composite
- 50.24/100
- National rank
- #4065
- State rank
- #320 of 1400 in CA
Livability — Byron
- Score
- 50/100
- State rank
- #1139
- US rank
- #25729
Category grades
Schools grade is shown separately in the Schools card above.
Census & demographics
- Census place
- Byron, CA
- Population (ZIP)
- 2,044
Population outlook (Contra Costa County) Hauer SSP2
- Today (2025)
- 1,287,720 people
- By 2030
- 1,364,937 · +6.0%
- By 2040
- 1,506,209 · +17.0%
- By 2050
- 1,624,373 · +26.1%
- By 2075
- 1,853,193 · +43.9%
- By 2100
- 1,901,231 · +47.6%
Race, ethnicity, and origin ACS 2023
- Neighborhood character
- Diverse neighborhood (Simpson 0.56)
- Race & ethnicity
- White 52% Hispanic / Latino 42% Two or more races 16% Asian 5% Native American 1%
- Hispanic origin (detail)
- Mexican 39%
- Common ancestry
- Russian 2% Italian 1% Lithuanian 1%
- Foreign-born
- 22% · Canada
- Languages at home
- 71% English-only · Spanish 24% Other Indo-European 3% Tagalog/Filipino 2%
Political lean MEDSL · Contra Costa
- 2024 margin
- Solid D (+38.0) · D 67.3% · R 29.4% · Other 3.3%
- 2008→2024 swing
- +0.2pp no change · 2008: 37.8pp · 2024: 38.0pp
- All cycles
- 2024: D+38.0 2020: D+45.3 2016: D+43.5 2012: D+33.7 2008: D+37.8
Not yet ingested
- Civics
- —
Market trends
- HPI YoY
- ▲ 1.63%
- Current HPI
- 157.8151
- Rent YoY
- —
- Metro
- —
- State GDP YoY
- ▲ 3.21%
- F500 in state
- 116
Industry mix (Fortune 500 HQ in CA)
| Industry | F500 HQs | Revenue |
|---|---|---|
| Technology | 27 | $1,492B |
|
||
| Financial Services | 3 | $174B |
|
||
| Retail | 3 | $44B |
|
||
| Insurance | 3 | $26B |
|
||
| Media / Entertainment | 2 | $115B |
|
||
| Pharmaceuticals / Biotech | 2 | $62B |
|
||
Price history
-28.0% since first listed6 events — show timeline
- 2010-10-14 Listing Removed — bridgeMLS, Bay East AOR, or Contra Costa AOR
- 2010-06-30 Price Changed — bridgeMLS, Bay East AOR, or Contra Costa AOR
- 2010-05-04 Listed — bridgeMLS, Bay East AOR, or Contra Costa AOR
- 2008-10-27 Sold (MLS) $18,000 bridgeMLS, Bay East AOR, or Contra Costa AOR
- 2008-09-24 Listing Removed — bridgeMLS, Bay East AOR, or Contra Costa AOR
- 2008-08-01 Listed $25,000 bridgeMLS, Bay East AOR, or Contra Costa AOR
Cash-flow waterfall
monthlySold comps — $/sqft
last 12 mo · ≤1 miLoading sold comps…