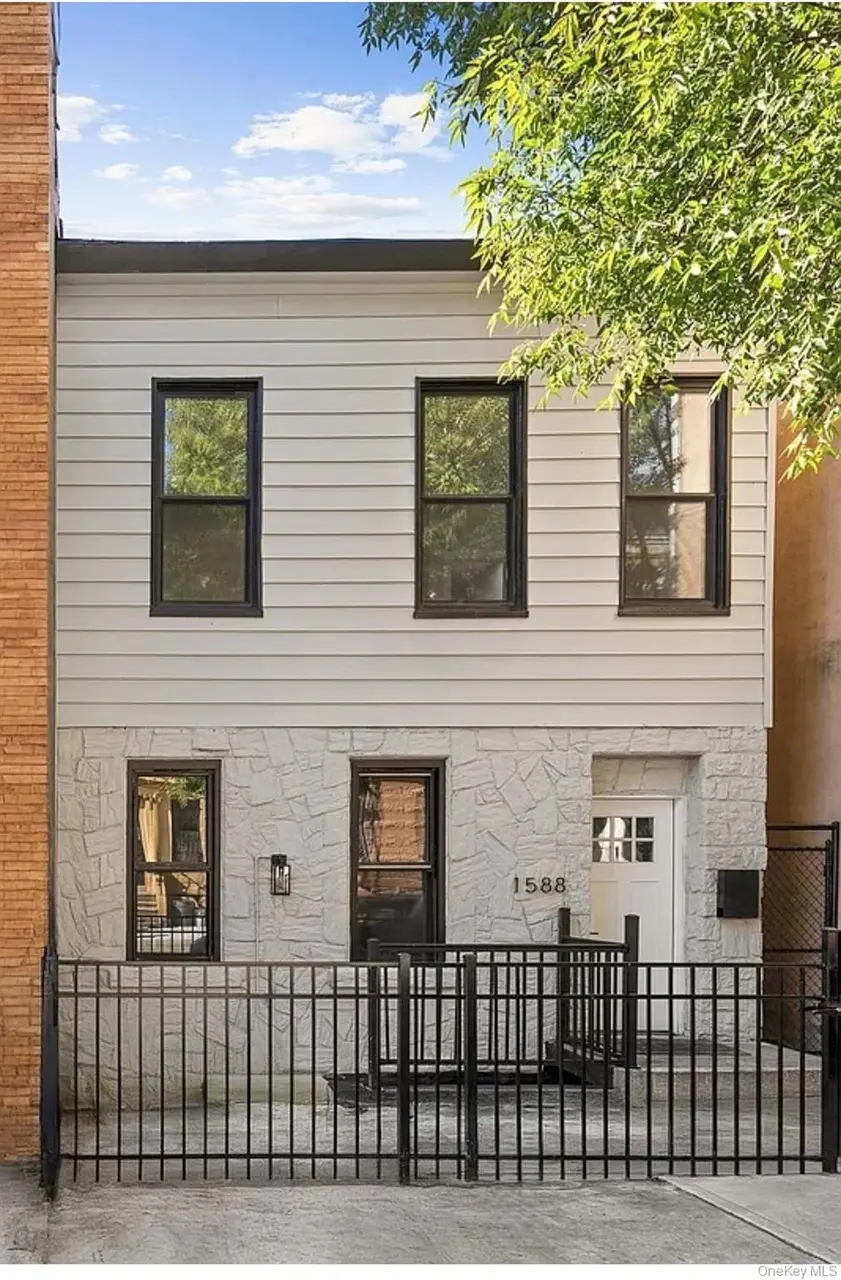
1588 Lincoln Pl · New York, NY
Flood risk 1/10 · Minimal
- FEMA flood zone
- X (unshaded)
- Chance of flooding over 30 yrs
- 0.0%
- Est. flood insurance / yr
- $507 – $1,088
Fire risk 1/10 · Minimal
- Est. fire insurance / yr
- $691 – $1,283
Heat risk 6/10 · Moderate
- Hot days now (above 99°F)
- 7 days/yr
- Hot days in 30 yrs
- 15 days/yr
Wind risk 6/10 · Moderate
- Chance of severe wind over 30 yrs
- 65.0%
Air-quality risk 5/10 · Moderate
- Unhealthy air days now
- 6 days/yr
- Unhealthy air days in 30 yrs
- 8 days/yr
Risk factors via First Street. Map © Google.
Why this score? — see what drove the F grade
The composite is a weighted blend of 9 inputs, each scored 0–100. Each bar is that input's sub-score; the figure is the points it added to the 100-point composite (weight × sub-score).
- Appreciation +10.0/10.0
- Schools +5.0/10.0
- Rent growth +4.1/5.0
- Cash flow +3.9/30.0
- Livability +3.8/5.0
- Condition / age +2.5/5.0
- 1% rule +0.0/10.0
- DSCR +0.0/10.0
- ARV discount +0.0/15.0
$759,000
🖨 Deal sheet (PDF) 📄 Offer letter ✓ Due diligence
Listing remarks MLS
We are proud to offer a cozy 1 family in one of Brooklyn’s hottest areas. This home features 2 large bedrooms over a living room, dining room/kitchen combo all over a full finished basement with a separate entrance. Extra-large private backyard. A short distance to all shopping and transportation..minutes to Manhattan.
Key facts
- Renovated home
- Good size yard
- Finished basement
Tags
Property features AI
Exterior
- Parking: No carport; No designated parking features listed
- Utilities: Con-Edison electric; Public sewer; Cable available; Electricity connected; Natural gas available and connected; Sewer connected; Public trash collection; Water available and connected
- Home design: Single family residence; Updated/remodeled; Bi-level
- Construction: Vinyl siding; Block foundation
- Exterior features: Garden; Mailbox; Back yard fencing
Interior
- Kitchen: Dishwasher; Gas range; Microwave; Oven; Refrigerator; Stainless steel appliances; ENERGY STAR qualified appliances
- Bedrooms: Bi-level layout (bedroom level details not specified)
- Flooring: Hardwood
- Bathrooms: 2 full bathrooms
- Heating & cooling: Baseboard heating; ENERGY STAR qualified heating equipment; Other heating; No cooling
- Interior features: First-floor full bath; Breakfast bar; Chef's kitchen; Double vanity; Eat-in kitchen; ENERGY STAR qualified doors; Entrance foyer; Formal dining room; Kitchen island; Open floorplan; Open kitchen; Quartz/Quartzite counters; Other
- Laundry & utility: Laundry inside; Gas water heater
Neighborhood map
What this means for you Summary
Snapshot
- This is a 3-bed/2.0-bath single-family listed at $759k.
Deal economics
- At list price, monthly cash flow is $-2k ($-26k/yr) — negative.
- To cash-flow at today's rent, offer at most $379k (50.1% below list).
- To meet the 1% rule (rent ≥ 1% of price), the offer needs to be $300k (60.5% below list).
- Recommended offer: $300k (60.5% below list) — sets the bar for 1% rule.
Location & tenants
- Location reads 75/100 on livability (#268 in NY, #4,188 nationally) — a middle-class / working-renter tenant base. Strengths: amenities A+, commute A+, health & safety A; Watch: crime F, cost of living F.
- Zoned schools: Elm Tree Elementary School (math 27% / reading 52%, grade F, #1,444 of 2,108 statewide, top 71%, 806 students, 94% FRL); Jhs 383 Philippa Schuyler (math 32% / reading 67%, grade C, #280 of 729 statewide, top 40%, 822 students, 85% FRL); Midwood High School (math 94% / reading 96%, grade A+, #83 of 1,100 statewide, top 8%, 4,062 students, 73% FRL).
- Market conditions: Rents rising fast (+6.4%/yr); 152 active listings in the ZIP; 14 comparable units currently listed for rent nearby; rentals at typical pace (median 26d on market — plan ~3-4 weeks tenant-placement turnaround); 10,063 units permitted in Kings County in 2024 (9,789 in 5+ unit buildings).
- At $2,997/mo this rent would consume 58% of the median local household income ($62k/yr) (locally 6960% of renters already pay >50% of income on rent) — very limited rent-growth headroom before tenants either downsize or default.
Forward outlook
- In year one you build about $81k of equity ($5k loan paydown + $76k appreciation (10.0% local appreciation)).
- Kings County population projected at +13% by 2050 — modest demand growth; plan on rents tracking national, not racing it.
- By year 2, paydown + projected appreciation supports a ~$130k cash-out refi (75% LTV) — recoverable capital for the next deal without selling this one.
Negotiation context
- It's been on market 69 days — a 6% lower offer ($713k) is reasonable based on typical stale-listing flexibility.
- 2 sale attempts since 2y ago; this cycle's ask has dropped $40k (5%) from the opening price — seller is motivated, your offer sets the floor, not the list.
- Current owner paid $600k; 26% above their basis — modest negotiation headroom, anchor on the comps not their cost.
Risks & watch-outs
- Watch-outs: built in 1899 — expect roof / HVAC / electrical / plumbing capex.
- Climate carrying-cost: major wind risk, 65% chance of damaging wind over 30y; extreme-heat days projected 7→15/yr by 2055 (HVAC capex compounding) — expect insurance premiums to compound above CPI over the hold.
Questions for the listing agent
- What do current leases actually rent for vs. the listed asking? Can we see a recent rent roll and the last 12 months of T-12 income?
- It's been on market 69 days. Have you received any prior offers? Is the seller open to a 61% concession, seller financing, or rate buy-down credit?
- Built in 1899 — when were the roof, HVAC, electrical panel, plumbing, and water heater last replaced?
- Why hasn't it sold? Are there any deal-killer items the seller is aware of (foundation, flood, title, zoning, code violations)?
- Is there a deadline driving the sale (1031 exchange, divorce, estate, relocation)? That informs how much negotiation room exists.
- Schools are B-rated — typically a magnet for longer-tenancy family renters. What's the average tenant stay here, and is there a school-zone premium baked into asking?
- Crime grade is F in this area — have there been break-ins, vandalism, or insurance claims at this property in the last 3 years? What carrier currently insures it and at what premium?
- The area grade is low — what's the realistic commute time and amenity access for the typical tenant pool here? Any planned neighborhood developments (good or bad) we should know about?
- What's the average days-on-market for RENTAL listings here right now (not sales)? A rising rental-DOM trend means longer vacancies and softer asking-rent achievability than the comps imply.
- What's the recent tenant-quality profile in this submarket — average credit score on applications, eviction rate, late-payment / NSF rate, and stable-employment percentage? A property-management company in the area should have these aggregated.
- How much new for-sale + rental construction is in the pipeline within 1–3 miles? Heavy new supply typically softens prices + rents 12–24 months out; constrained supply supports both.
Investment metrics
- 1% rule
- 0.39% ✗
- Cap rate
- 2.89%
- Cash-on-cash
- -12.16%
- DSCR
- 0.46
- GRM
- 21.1
CMA / ARV
- ARV (on-the-fly)
- $615,600
- Comps found
- 6
Show comp detail 6 sales within ~0.75 mi
| Address | Dist | Beds/Ba | Sqft | Sold | Price | $/sf | Match |
|---|---|---|---|---|---|---|---|
| 53 Legion St | 0.35mi | 3/1.5 | 1,116 (-7%) | 5mo | $605,000 | $542 | 66 |
| 20 Suydam Pl Unit 3C | 0.61mi | 4/2.0 (+1) | 1,200 (0%) | 12mo | $350,000 | $292 | 56 |
| 179 Amboy St | 0.60mi | 3/1.5 | 1,116 (-7%) | 9mo | $625,000 | $560 | 51 |
| 242 Legion St | 0.58mi | 3/1.5 | 1,116 (-7%) | 12mo | $573,000 | $513 | 50 |
| 908 Rutland Rd | 0.65mi | 3/2.5 | 1,350 (+12%) | 4mo | $640,000 | $474 | 43 |
| 609 Thomas S Boyland St | 0.65mi | 2/1.5 (-1) | 1,148 (-4%) | 21mo | $495,000 | $431 | 38 |
Match score weights: distance 35% · size 25% · config 20% · recency 20%. Top-matched comps best support the ARV.
Projected returns pro-forma
10.0% appreciation · 6.44% rent growth · sell at horizon
- IRR
- 16.3%
- Equity multiple
- 2.35×
- Total profit
- $286,543
- Equity at exit
- $683,767
- IRR
- 16.1%
- Equity multiple
- 5.59×
- Total profit
- $975,897
- Equity at exit
- $1,474,570
Cash invested: $212,520 (down + closing). Projections, not guarantees.
Landlord ↔ Tenant lean methodology
- Overall (CITY)
- 0 Strongly Tenant-Friendly
- State New York
- 15 Strongly Tenant-Friendly · D+10
- County
- — inherits STATE
- City New York
- 0 Strongly Tenant-Friendly · D+34
ZIP-level market 11233
- Home prices YoY
- 2.9%
- Rents YoY
- 6.4%
- Active inventory
- 152
- Price-to-rent
- 21.1×
Monthly cashflow live
- Estimated rent
- $2,997 high interval (Pro) →
- Mortgage (P&I)
- −$3,980
- Tax from tax record
- −$225 /mo · $2,696/yr
- Insurance
- −$316
- HOA
- −$0
- Vacancy / Maint / Mgmt
- −$629
- Net cashflow
- $-2,154
Break-even live
Sensitivity live
| Price | -10% $-1,724 | -5% $-1,939 | +0% $-2,154 | +5% $-2,368 | +10% $-2,583 |
|---|---|---|---|---|---|
| Rent | -10% $-2,390 | -5% $-2,272 | +0% $-2,154 | +5% $-2,035 | +10% $-1,917 |
| Rate | -1.0pp $-1,771 | -0.5pp $-1,960 | base $-2,154 | +0.5pp $-2,350 | +1.0pp $-2,550 |
UW: 25.0% down · 7.5% · 30yr · 1.5% tax · 5.0% vac · 8.0% maint · 8.0% mgmt
Financing live
Cash to close
- Down payment
- $189,750
- Closing costs
- $22,770
- Reserves months
- —
- Total cash needed
- —
Loan-product check · same deal, 3 products live
Conventional
25% down · 7.5% · 30yr
- Down + closing
- —
- Monthly P&I
- —
- Monthly cashflow
- —
- DSCR
- —
- Eligible?
- —
Personal DTI + credit; lowest rate.
DSCR
20% down · 8.5% · 30yr
- Down + closing
- —
- Monthly P&I
- —
- Monthly cashflow
- —
- DSCR
- —
- Eligible?
- —
No personal income docs; deal must DSCR.
Hard money
10% down · 12.0% · 12mo
- Down + closing
- —
- Monthly P&I
- —
- Monthly cashflow
- —
- DSCR
- —
- Eligible?
- —
Short-term bridge; refi at stabilization.
Rent comps 14 comps
| Address | Beds | Baths | Sqft | Rent | $/sqft | DOM | Units | Dist |
|---|---|---|---|---|---|---|---|---|
| 1266 Park Pl Unit 1A Brooklyn, NY | 2.0 | 1.5 | 886 | $3,250 | $3.67 | 26d | 1 | 0.65mi |
| 819 Saratoga Ave Brooklyn, NY | 3.0 | 1.5 | 1300 | $3,350 | $2.58 | 26d | 1 | 0.75mi |
| 1619 Pacific St Brooklyn, NY | 2.0 | 2.0 | 1300 | $3,300 | $2.54 | 3d | 1 | 0.89mi |
| 338 Chauncey St Unit 3A Brooklyn, NY | 2.0 | 1.0 | 900 | $3,500 | $3.89 | 26d | 1 | 0.90mi |
| 256 E 55th St #1 Brooklyn, NY | 2.0 | 1.0 | 1200 | $2,600 | $2.17 | 26d | 1 | 1.20mi |
| 1437 Pacific St Brooklyn, NY | 2.0 | 1.0 | 1000 | $3,200 | $3.20 | 26d | 1 | 1.20mi |
| 22 Granite St Brooklyn, NY | 4.0 | 2.0 | 586 | $1,150 | $1.96 | 6d | 1 | 1.25mi |
| 448 Empire Blvd Brooklyn, NY | 4.0 | 2.0 | 592 | $1,170 | $1.97 | 7d | 1 | 1.27mi |
| 1066 Putnam Ave Brooklyn, NY | 4.0 | 2.0 | 647 | $1,110 | $1.71 | 7d | 1 | 1.29mi |
| 1083 Thomas S Boyland St Unit 2 Brooklyn, NY | 4.0 | 1.0 | 1100 | $3,600 | $3.27 | 26d | 1 | 1.31mi |
| 951 Madison St Brooklyn, NY | 4.0 | 1.0 | 1000 | $1,260 | $1.26 | 26d | 1 | 1.37mi |
| 705 Saint Marks Ave Brooklyn, NY | 4.0 | 2.0 | 650 | $1,100 | $1.69 | 22d | 1 | 1.41mi |
| 800 Park Pl Unit 3R Brooklyn, NY | 2.0 | 2.0 | 1300 | $6,995 | $5.38 | 26d | 1 | 1.46mi |
| 361 Winthrop St Brooklyn, NY | 3.0 | 4.0 | 500 | $1,510 | $3.02 | 7d | 1 | 1.48mi |
Listing history 20 events
-
2026-06-21days on market $759,000 Active 69 DOM
-
2026-06-18days on market $759,000 Active 66 DOM
-
2026-06-17days on market $759,000 Active 65 DOM
-
2026-06-15days on market $759,000 Active 63 DOM
-
2026-06-13pricedays on market $759,000 Active 61 DOM
-
2026-06-10days on market $769,000 Active 57 DOM
-
2026-06-08days on market $769,000 Active 56 DOM
-
2026-06-08days on market $769,000 Active 55 DOM
-
2026-06-04days on market $769,000 Active 52 DOM
-
2026-06-03days on market $769,000 Active 51 DOM
-
2026-06-01days on market $769,000 Active 49 DOM
-
2026-05-31days on market $769,000 Active 48 DOM
-
2026-04-21price $769,000
-
2026-04-13$799,000 Active
-
2025-07-11price $870,000
-
2025-06-03price $875,000
-
2025-01-30soldstatus $600,000
-
2025-01-23soldstatus $600,000 Sold 326-char remark
Show marketing remark (326 chars)
We are proud to offer a cozy 1 family in one of Brooklyn’s hottest areas. This home features 2 large bedrooms over a living room, dining room/kitchen combo all over a full finished basement with a separate entrance. Extra-large private backyard. A short distance to all shopping and transportation..minutes to Manhattan.
-
2024-11-15status Pending 326-char remark
Show marketing remark (326 chars)
We are proud to offer a cozy 1 family in one of Brooklyn’s hottest areas. This home features 2 large bedrooms over a living room, dining room/kitchen combo all over a full finished basement with a separate entrance. Extra-large private backyard. A short distance to all shopping and transportation..minutes to Manhattan.
-
2024-10-19$695,000 Active 326-char remark
Show marketing remark (326 chars)
We are proud to offer a cozy 1 family in one of Brooklyn’s hottest areas. This home features 2 large bedrooms over a living room, dining room/kitchen combo all over a full finished basement with a separate entrance. Extra-large private backyard. A short distance to all shopping and transportation..minutes to Manhattan.
ⓘ Source: listings_history table (triggers on properties + properties_extension) + one-shot
backfill from property_details.listing_events for pre-trigger history.
Tax reassessment forecast NY · Partial reset (capped growth)
- Current annual tax
- $2,696 · $225/mo
- Projected year-2 tax
- $7,762 · $647/mo
- Expected delta
- +$5,066/yr (+$422/mo · 187.9%)
ⓘ Screening estimate from a state-policy table — verify with the county assessor before closing.
Climate risk First Street
- Flood 1/10 Low FEMA zone X (unshaded) · 0% chance over 30 yrs
- Wildfire 1/10 Low
- Heat 6/10 Major 7 d/yr ≥99°F today · 15 d/yr by 30 yrs out
- Wind 6/10 Major 65% chance of damaging wind over 30 yrs
- Air quality 5/10 Major 6 unhealthy d/yr today · 8 by 30 yrs out
Nearby sold comps map
Loading sold comps map…
Walkable amenities ~0.75 mi
Loading nearby amenities…
Taxation est. · year 1
- Rental income
- $35,964
- − Mortgage interest
- −$42,516
- − Property taxes
- −$2,696
- − Insurance
- −$3,795
- − Repairs & maintenance
- −$2,877
- − Management
- −$2,877
- − Depreciation
- −$22,080
- Taxable loss
- −$40,877
- Est. tax savings @ 24.0%
- +$9,810
- After-tax cash flow
- $-16,032/yr
For passive investors: Depreciation is non-cash, so a rental often shows a tax loss while cash-flowing — sheltering income. Rental losses are passive: they offset passive income freely, and up to $25,000/yr can offset ordinary (W-2) income if you actively participate and your MAGI is under $100k (phasing out to $0 by $150k); unused losses carry forward. On sale, claimed depreciation is recaptured at up to 25%, and gains may owe capital-gains tax (a 1031 exchange can defer both). Figures are a year-1 estimate at your 24.0% rate — not tax advice; consult a CPA.
Schools (NCES district)
No district data.
Livability — New York
- Score
- 75/100
- State rank
- #268
- US rank
- #4188
Category grades
Schools grade is shown separately in the Schools card above.
Census & demographics
- Census place
- New York, NY
- County
- Kings County · 2,614,986 people
- City population
- 7,731,280
- Metro
- New York-Newark-Jersey City, NY-NJ-PA
- Population (ZIP)
- 81,822
- Household income
- $62,411
- Rent vs Own
- Severe rent burden
- 6960.0
Population outlook (Kings County) Hauer SSP2
- Today (2025)
- 2,847,441 people
- By 2030
- 2,937,006 · +3.1%
- By 2040
- 3,095,491 · +8.7%
- By 2050
- 3,228,968 · +13.4%
- By 2075
- 3,321,723 · +16.7%
- By 2100
- 3,111,387 · +9.3%
Race, ethnicity, and origin ACS 2023
- Neighborhood character
- Predominantly Black (65%)
- Race & ethnicity
- Black 65% Hispanic / Latino 16% White 12% Two or more races 8% Asian 2%
- Hispanic origin (detail)
- Puerto Rican 5% Dominican 5%
- Common ancestry
- Hispanic 1% Romanian 1% Lithuanian 1%
- Foreign-born
- 25% · Canada, Mexico, China
- Languages at home
- 80% English-only · Spanish 12% French/Haitian/Cajun 3% Other Indo-European 1%
Political lean MEDSL · Kings
- 2024 margin
- Solid D (+44.0) · D 72.0% · R 28.0%
- 2008→2024 swing
- -15.5pp toward R · 2008: 59.4pp · 2024: 44.0pp
- All cycles
- 2024: D+44.0 2020: D+54.8 2016: D+61.8 2012: D+63.9 2008: D+59.4
Not yet ingested
- Civics
- —
Market trends
- HPI YoY
- ▲ 18.31%
- Current HPI
- 645.4828
- Rent YoY
- ▲ 6.44%
- Metro
- New York-Newark-Jersey City, NY-NJ-PA
- State GDP YoY
- ▲ 2.60%
- F500 in state
- 92
Industry mix (Fortune 500 HQ in NY)
| Industry | F500 HQs | Revenue |
|---|---|---|
| Financial Services | 10 | $950B |
|
||
| Consumer Goods | 9 | $162B |
|
||
| Insurance | 4 | $225B |
|
||
| Telecommunications | 2 | $144B |
|
||
| Pharmaceuticals | 2 | $112B |
|
||
| Media / Entertainment | 2 | $69B |
|
||
Price history
+10.6% since first listed8 events — show timeline
- 2026-04-21 Price Changed $769,000 OneKey® MLS as Distributed by MLS Grid
- 2026-04-13 Listed $799,000 OneKey® MLS as Distributed by MLS Grid
- 2025-07-11 Price Changed $870,000 BNYMLS
- 2025-06-03 Price Changed $875,000 BNYMLS
- 2025-01-30 Sold (Public Records) $600,000 Public Records
- 2025-01-23 Sold (MLS) $600,000 BNYMLS
- 2024-11-15 Pending — BNYMLS
- 2024-10-19 Listed $695,000 BNYMLS
Property tax history
+6.0%/yrLatest (2025): $2,696 · +8.1% YoY. Source: county tax records.
Cash-flow waterfall
monthlySold comps — $/sqft
last 12 mo · ≤1 miLoading sold comps…