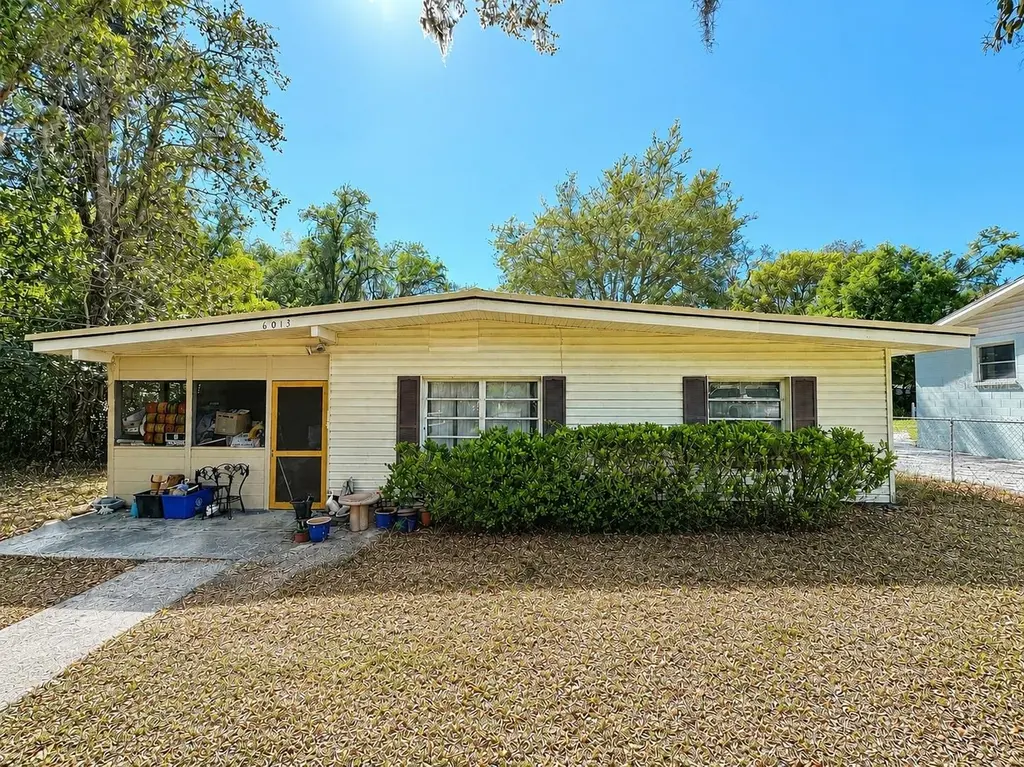
6013 Idle A While Cir · Ridge Manor, FL
Flood risk 6/10 · Moderate
- FEMA flood zone
- AE
- Chance of flooding over 30 yrs
- 0.67%
- Est. flood insurance / yr
- $1,737 – $8,500
Fire risk 5/10 · Moderate
- Est. fire insurance / yr
- $947 – $1,759
Heat risk 9/10 · Severe
- Hot days now (above 108°F)
- 7 days/yr
- Hot days in 30 yrs
- 24 days/yr
Wind risk 9/10 · Severe
- Chance of severe wind over 30 yrs
- 99.0%
Air-quality risk 1/10 · Minimal
- Unhealthy air days now
- 0 days/yr
- Unhealthy air days in 30 yrs
- 0 days/yr
Risk factors via First Street. Map © Google.
Why this score? — see what drove the B+ grade
The composite is a weighted blend of 9 inputs, each scored 0–100. Each bar is that input's sub-score; the figure is the points it added to the 100-point composite (weight × sub-score).
- Cash flow +26.5/30.0
- ARV discount +15.0/15.0
- Appreciation +10.0/10.0
- DSCR +9.0/10.0
- 1% rule +6.1/10.0
- Schools +4.2/10.0
- Livability +3.2/5.0
- Rent growth +2.5/5.0
- Condition / age +2.5/5.0
$179,900
🖨 Deal sheet 📄 Offer letter ✓ Due diligence
Listing remarks
Virtually Staged. PRICE REDUCED!! SELLER IS MOTIVATED!! Additional interior photos added - more photos coming soon. This charming 2 bedroom, 2 bathroom home with tons of potential is ready for its new owners. The home sits on . 35 acres, and backs up to a large retention pond adding an extra level of privacy. As you approach the home, you’re welcomed by a spacious front porch, which also conveniently houses the washer and dryer. Inside, the home offers a functional layout with plenty of potential to make it your own. Recent updates provide peace of mind, including a new HVAC system (2023), partial roof replacement (2026), and a newly replaced well pump and piping (2026). Both bathroom
Key facts
- Renovated bathrooms
- Wood-look tile
- Spacious front porch
Tags
Property features AI
Finance
- Other: Zoning: R1C
- Financial info: No lease restrictions
- HOA & community: No HOA; Pets allowed
Exterior
- Utilities: Well water; Septic tank; Electricity connected
- Home design: Single family residence; Attached property; One story; Faces east; Completed condition; Homestead exempt
- Construction: Vinyl siding and block construction; Metal roof; Slab foundation; Built on a 0.35-acre lot
- Exterior features: Storage; Exterior lighting; Sliding doors; Level lot; Concrete road access
Interior
- Kitchen: Range
- Bedrooms: 2 bedrooms
- Flooring: Ceramic tile; Linoleum
- Bathrooms: 2 full bathrooms
- Heating & cooling: Central heating; Central air conditioning
- Interior features: Solid wood cabinets; Ceiling fans; High ceilings; Thermostat
- Laundry & utility: Washer; Dryer; Laundry located outside
Neighborhood map
What this means for you Summary
Snapshot
- This is a 2-bed/1.0-bath single-family listed at $180k.
Deal economics
- At list price, monthly cash flow is $49 ($584/yr) — positive.
- The deal already cash-flows at list — no discount required.
- Meets the 1% rule at list price ($2k rent vs $180k).
- Recommended offer: $169k (6.0% below list) — sets the bar for market timing.
- Cap rate 9.5% vs local median 4.3% in Ridge Manor — top-decile yield for the area; either an underpriced asset or a hidden risk that comps aren't pricing in. Stress-test before assuming the spread holds.
Location & tenants
- Location reads 63/100 on livability (#736 in FL) — a middle-class / working-renter tenant base. Strengths: cost of living A+, housing A+, crime B+; Watch: health & safety C-, employment D, schools F.
- Hernando (suburban): math 50% / reading 50% proficiency, ranked #38 of 73 in FL (top 52%) — acceptable for families but not a draw, mixed tenant base, ~2y average lease.
- Market conditions: 295 active listings in the ZIP; 2 comparable units currently listed for rent nearby; 2,505 units permitted in Hernando County in 2024 (318 in 5+ unit buildings).
Forward outlook
- In year one you build about $19k of equity ($1k loan paydown + $18k appreciation (10.0% local appreciation)).
- Hernando County population projected at +11% by 2050 — modest demand growth; plan on rents tracking national, not racing it.
- At projected returns (10.0% appreciation + 3.0% rent growth), your $50k cash investment doubles in ~3 years — after that, you're playing with house money.
- By year 2, paydown + projected appreciation supports a ~$31k cash-out refi (75% LTV) — recoverable capital for the next deal without selling this one.
Negotiation context
- It's been on market 66 days — a 6% lower offer ($169k) is reasonable based on typical stale-listing flexibility.
- 8 sale attempts since 13y ago; this cycle's ask has dropped $20k (10%) from the opening price — seller is motivated, your offer sets the floor, not the list.
- Current owner paid $143k; 26% above their basis — modest negotiation headroom, anchor on the comps not their cost.
Risks & watch-outs
- Watch-outs: flood insurance adds $427/mo; built in 1958 — expect roof / HVAC / electrical / plumbing capex.
- Climate carrying-cost: in FEMA flood zone AE (mandatory federal flood insurance); severe wind risk, 99% chance of damaging wind over 30y; moderate wildfire risk; extreme-heat days projected 7→24/yr by 2055 (HVAC capex compounding) — expect insurance premiums to compound above CPI over the hold.
Questions for the listing agent
- It's been on market 66 days. Have you received any prior offers? Is the seller open to a 6% concession, seller financing, or rate buy-down credit?
- Built in 1958 — when were the roof, HVAC, electrical panel, plumbing, and water heater last replaced?
- What's the actual annual flood-insurance premium (NFIP or private), and is the property in a SFHA with mandatory coverage?
- Why hasn't it sold? Are there any deal-killer items the seller is aware of (foundation, flood, title, zoning, code violations)?
- Is there a deadline driving the sale (1031 exchange, divorce, estate, relocation)? That informs how much negotiation room exists.
- Schools are F-rated, which usually means shorter tenancies and higher turnover. Who's the typical renter profile here, and what's been the actual vacancy rate?
- What's the average days-on-market for RENTAL listings here right now (not sales)? A rising rental-DOM trend means longer vacancies and softer asking-rent achievability than the comps imply.
- What's the recent tenant-quality profile in this submarket — average credit score on applications, eviction rate, late-payment / NSF rate, and stable-employment percentage? A property-management company in the area should have these aggregated.
- How much new for-sale + rental construction is in the pipeline within 1–3 miles? Heavy new supply typically softens prices + rents 12–24 months out; constrained supply supports both.
Investment metrics
- 1% rule
- 1.11% ✓
- Cap rate
- 9.46%
- Cash-on-cash
- 11.32%
- DSCR
- 1.50
- GRM
- 7.5
CMA / ARV
- ARV (on-the-fly)
- $234,960
- Comps found
- 7
Show comp detail 7 sales within ~0.75 mi
| Address | Dist | Beds/Ba | Sqft | Sold | Price | $/sf | Match |
|---|---|---|---|---|---|---|---|
| 6114 Idle A While Cir | 0.17mi | 2/1.5 | 1,130 (+6%) | 15mo | $230,000 | $204 | 68 |
| 33486 Westwood Dr | 0.48mi | 2/2.0 | 1,062 (-1%) | 6mo | $270,000 | $254 | 68 |
| 6034 Idle A While Cir | 0.09mi | 3/2.0 (+1) | 1,100 (+3%) | 18mo | $285,000 | $259 | 66 |
| 33241 Westwood Dr | 0.62mi | 2/1.0 | 1,008 (-6%) | 1mo | $207,000 | $205 | 61 |
| 5425 Leisure St | 0.15mi | 2/2.0 | 1,200 (+12%) | 11mo | $220,000 | $183 | 59 |
| 33357 Westwood Dr | 0.45mi | 2/2.0 | 1,000 (-6%) | 11mo | $244,000 | $244 | 55 |
| 33243 Pennsylvania Ave | 0.54mi | 3/2.0 (+1) | 960 (-10%) | 18mo | $211,000 | $220 | 34 |
Match score weights: distance 35% · size 25% · config 20% · recency 20%. Top-matched comps best support the ARV.
Projected returns pro-forma
10.0% appreciation · 3.0% rent growth · sell at horizon
- IRR
- 25.2%
- Equity multiple
- 3.01×
- Total profit
- $101,282
- Equity at exit
- $162,068
- IRR
- 22.2%
- Equity multiple
- 6.88×
- Total profit
- $296,223
- Equity at exit
- $349,506
Cash invested: $50,372 (down + closing). Projections, not guarantees.
Landlord ↔ Tenant lean methodology
- Overall (STATE)
- 87 Strongly Landlord-Friendly
- State Florida
- 87 Strongly Landlord-Friendly · R+3
- County
- — inherits STATE
- City
- — inherits STATE
ZIP-level market 33523
- Home prices YoY
- 3.8%
- Active inventory
- 295
- Price-to-rent
- 7.5×
Monthly cashflow live
- Estimated rent
- $1,991 medium interval (Pro) →
- Mortgage (P&I)
- −$943
- Tax from tax record
- −$79 /mo · $948/yr
- Insurance
- −$75
- Flood insurance flood zone
- −$427 /mo · $5,118/yr
- HOA
- −$0
- Vacancy / Maint / Mgmt
- −$418
- Net cashflow
- $49
Break-even live
UW: 25.0% down · 7.5% · 30yr · 1.5% tax · 5.0% vac · 8.0% maint · 8.0% mgmt
Financing live
Cash to close
- Down payment
- $44,975
- Closing costs
- $5,397
- Reserves months
- —
- Total cash needed
- —
Loan-product check · same deal, 3 products live
Conventional
25% down · 7.5% · 30yr
- Down + closing
- —
- Monthly P&I
- —
- Monthly cashflow
- —
- DSCR
- —
- Eligible?
- —
Personal DTI + credit; lowest rate.
DSCR
20% down · 8.5% · 30yr
- Down + closing
- —
- Monthly P&I
- —
- Monthly cashflow
- —
- DSCR
- —
- Eligible?
- —
No personal income docs; deal must DSCR.
Hard money
10% down · 12.0% · 12mo
- Down + closing
- —
- Monthly P&I
- —
- Monthly cashflow
- —
- DSCR
- —
- Eligible?
- —
Short-term bridge; refi at stabilization.
Rent comps 2 comps
| Address | Beds | Baths | Sqft | Rent | $/sqft | DOM | Units | Dist |
|---|---|---|---|---|---|---|---|---|
| 5431 Tower St Dade City, FL | 2.0 | 1.5 | 1188 | $2,000 | $1.68 | 18d | 1 | 0.13mi |
| 34807 Evergreen Way Dade City, FL | 3.0 | 1.0 | 1000 | $1,900 | $1.90 | 20d | 1 | 1.36mi |
Listing history 39 events
-
2026-06-18days on market $179,900 Active 66 DOM
-
2026-06-17days on market $179,900 Active 65 DOM
-
2026-06-16days on market $179,900 Active 64 DOM
-
2026-06-15days on market $179,900 Active 63 DOM
-
2026-06-13days on market $179,900 Active 61 DOM
-
2026-06-13days on market $179,900 Active 60 DOM
-
2026-06-09days on market $179,900 Active 57 DOM
-
2026-06-08days on market $179,900 Active 56 DOM
-
2026-06-07days on market $179,900 Active 55 DOM
-
2026-06-04days on market $179,900 Active 52 DOM
-
2026-06-03days on market $179,900 Active 51 DOM
-
2026-06-02days on market $179,900 Active 50 DOM
-
2026-06-01days on market $179,900 Active 49 DOM
-
2026-05-31days on market $179,900 Active 48 DOM
-
2026-05-18price $179,900
-
2026-05-06price $189,900
-
2026-04-13$200,000 Active
-
2025-09-02historical
-
2025-09-02historical
-
2025-06-23price $180,000
-
2025-06-23price $180,000
-
2025-05-01$190,000 Active
-
2025-04-30$190,000 Active
-
2024-08-10historical
-
2024-05-28price $165,000
-
2024-02-10$180,000 Active
-
2023-10-23historical
-
2023-10-06price $165,000
-
2023-09-27$175,000 Active
-
2023-08-15historical
-
2023-07-27price $190,000
-
2023-07-17$200,000 Active
-
2022-05-23soldstatus $143,000
-
2020-09-30historical
-
2013-06-19soldstatus $32,000
-
2013-02-27$57,000
-
2013-01-30$39,900
-
2006-02-24soldstatus $115,000
-
1998-09-28soldstatus $35,000
ⓘ Source: listings_history table (triggers on properties + properties_extension) + one-shot
backfill from property_details.listing_events for pre-trigger history.
Tax reassessment forecast FL · Resets to sale price
- Current annual tax
- $948 · $79/mo
- Projected year-2 tax
- $1,493 · $124/mo
- Expected delta
- +$545/yr (+$45/mo · 57.4%)
ⓘ Screening estimate from a state-policy table — verify with the county assessor before closing.
Climate risk First Street
- Flood 6/10 Major FEMA zone AE · 67% chance over 30 yrs
- Wildfire 5/10 Major
- Heat 9/10 Extreme 7 d/yr ≥108°F today · 24 d/yr by 30 yrs out
- Wind 9/10 Extreme 99% chance of damaging wind over 30 yrs
- Air quality 1/10 Low 0 unhealthy d/yr today · 0 by 30 yrs out
Nearby sold comps map
Loading sold comps map…
Walkable amenities ~0.75 mi
Loading nearby amenities…
Taxation est. · year 1
- Rental income
- $23,888
- − Mortgage interest
- −$10,077
- − Property taxes
- −$948
- − Insurance
- −$6,018
- − Repairs & maintenance
- −$1,911
- − Management
- −$1,911
- − Depreciation
- −$5,233
- Taxable loss
- −$2,211
- Est. tax savings @ 24.0%
- +$531
- After-tax cash flow
- $1,115/yr
For passive investors: Depreciation is non-cash, so a rental often shows a tax loss while cash-flowing — sheltering income. Rental losses are passive: they offset passive income freely, and up to $25,000/yr can offset ordinary (W-2) income if you actively participate and your MAGI is under $100k (phasing out to $0 by $150k); unused losses carry forward. On sale, claimed depreciation is recaptured at up to 25%, and gains may owe capital-gains tax (a 1031 exchange can defer both). Figures are a year-1 estimate at your 24.0% rate — not tax advice; consult a CPA.
Schools (NCES district)
- District
- Hernando
- NCES district ID
- 1200810
- Math proficiency
- 50% ▼ -8.00%
- Reading proficiency
- 50% ▼ -4.00%
- Median HH income
- $41,985
- Composite
- 42.03/100
- National rank
- #3329
- State rank
- #38 of 73 in FL
Livability — Ridge Manor
- Score
- 63/100
- State rank
- #736
- US rank
- #15912
Category grades
Schools grade is shown separately in the Schools card above.
Census & demographics
- Census place
- Ridge Manor, FL
- Population (ZIP)
- 19,296
Population outlook (Hernando County) Hauer SSP2
- Today (2025)
- 189,218 people
- By 2030
- 194,367 · +2.7%
- By 2040
- 203,398 · +7.5%
- By 2050
- 209,589 · +10.8%
- By 2075
- 218,452 · +15.4%
- By 2100
- 205,923 · +8.8%
Race, ethnicity, and origin ACS 2023
- Neighborhood character
- Diverse neighborhood (Simpson 0.59)
- Race & ethnicity
- White 57% Hispanic / Latino 28% Black 10% Two or more races 10% Native American 3% Asian 1%
- Hispanic origin (detail)
- Mexican 21% Puerto Rican 2% Cuban 2%
- Common ancestry
- Lithuanian 5% Slovak 1% Romanian 1%
- Foreign-born
- 13% · Canada, China, Jamaica
- Languages at home
- 75% English-only · Spanish 21% Other Indo-European 2% Chinese 1%
Political lean MEDSL · Hernando
- 2024 margin
- Solid R (+37.0) · D 31.1% · R 68.2%
- 2008→2024 swing
- -33.5pp toward R · 2008: -3.6pp · 2024: -37.0pp
- All cycles
- 2024: R+37.0 2020: R+30.2 2016: R+29.0 2012: R+8.5 2008: R+3.6
Not yet ingested
- Civics
- —
Market trends
- HPI YoY
- ▲ 16.36%
- Current HPI
- 448.7
- Rent YoY
- —
- Metro
- —
- State GDP YoY
- ▲ 3.28%
- F500 in state
- 36
Industry mix (Fortune 500 HQ in FL)
| Industry | F500 HQs | Revenue |
|---|---|---|
| Industrial Technology | 2 | $29B |
|
||
| Insurance | 2 | $17B |
|
||
| Retail | 1 | $60B |
|
||
| Technology Distribution | 1 | $58B |
|
||
| Homebuilding | 1 | $35B |
|
||
| Technology Manufacturing | 1 | $35B |
|
||
Price history
+414.0% since first listed25 events — show timeline
- 2026-05-18 Price Changed $179,900 Stellar MLS as Distributed by MLS Grid
- 2026-05-06 Price Changed $189,900 Stellar MLS as Distributed by MLS Grid
- 2026-04-13 Listed $200,000 Stellar MLS as Distributed by MLS Grid
- 2025-09-02 Listing Removed — Stellar MLS as Distributed by MLS Grid
- 2025-09-02 Listing Removed — HCAR
- 2025-06-23 Price Changed $180,000 HCAR
- 2025-06-23 Price Changed $180,000 Stellar MLS as Distributed by MLS Grid
- 2025-05-01 Listed $190,000 HCAR
- 2025-04-30 Listed $190,000 Stellar MLS as Distributed by MLS Grid
- 2024-08-10 Listing Removed — Stellar MLS as Distributed by MLS Grid
- 2024-05-28 Price Changed $165,000 Stellar MLS as Distributed by MLS Grid
- 2024-02-10 Listed $180,000 Stellar MLS as Distributed by MLS Grid
- 2023-10-23 Listing Removed — Stellar MLS as Distributed by MLS Grid
- 2023-10-06 Price Changed $165,000 Stellar MLS as Distributed by MLS Grid
- 2023-09-27 Listed $175,000 Stellar MLS as Distributed by MLS Grid
- 2023-08-15 Listing Removed — Stellar MLS as Distributed by MLS Grid
- 2023-07-27 Price Changed $190,000 Stellar MLS as Distributed by MLS Grid
- 2023-07-17 Listed $200,000 Stellar MLS as Distributed by MLS Grid
- 2022-05-23 Sold (Public Records) $143,000 Public Records
- 2020-09-30 Listing Removed — HCAR
- 2013-06-19 Sold (MLS) $32,000 Stellar MLS as Distributed by MLS Grid
- 2013-02-27 Listed $57,000 HCAR
- 2013-01-30 Listed $39,900 Stellar MLS as Distributed by MLS Grid
- 2006-02-24 Sold (Public Records) $115,000 Public Records
- 1998-09-28 Sold (Public Records) $35,000 Public Records
Property tax history
+0.7%/yrLatest (2025): $948 · -0.6% YoY. Source: county tax records.
Cash-flow waterfall
monthlySold comps — $/sqft
last 12 mo · ≤1 miLoading sold comps…