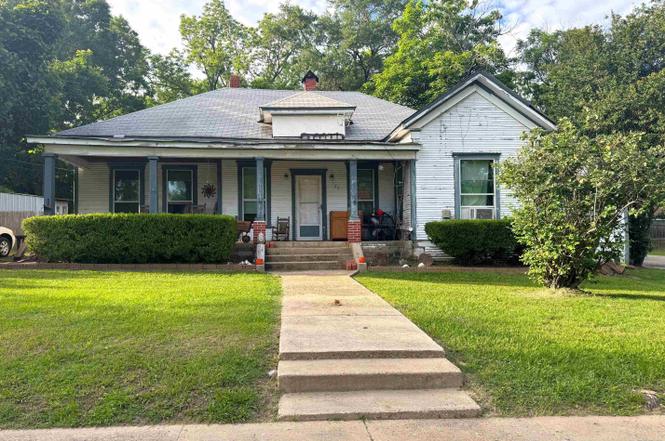
123 E 12th St · Mount Pleasant, TX
Flood risk 1/10 · Minimal
- FEMA flood zone
- X (unshaded)
- Chance of flooding over 30 yrs
- 0.0%
- Est. flood insurance / yr
- $507 – $1,088
Fire risk 5/10 · Moderate
- Est. fire insurance / yr
- $1,222 – $2,270
Heat risk 7/10 · Major
- Hot days now (above 113°F)
- 7 days/yr
- Hot days in 30 yrs
- 23 days/yr
Wind risk 6/10 · Moderate
- Chance of severe wind over 30 yrs
- 27.0%
Air-quality risk 2/10 · Minimal
- Unhealthy air days now
- 1 days/yr
- Unhealthy air days in 30 yrs
- 1 days/yr
Risk factors via First Street. Map © Google.
Why this score? — see what drove the B grade
The composite is a weighted blend of 9 inputs, each scored 0–100. Each bar is that input's sub-score; the figure is the points it added to the 100-point composite (weight × sub-score).
- Cash flow +30.0/30.0
- 1% rule +10.0/10.0
- DSCR +10.0/10.0
- ARV discount +7.5/15.0
- Livability +3.9/5.0
- Schools +3.7/10.0
- Rent growth +2.5/5.0
- Condition / age +2.5/5.0
- Appreciation +0.0/10.0
$115,000
🖨 Deal sheet 📄 Offer letter ✓ Due diligence
Listing remarks MLS
Calling Investors! Spacious 3 bedroom 1 bath home with 1600+SF featuring a large living area with fireplace, formal dining, and office/study or potential 4th bedroom. All sitting on a large 0.41 acre corner lot. Opportunity is knocking!
Key facts
- Formal dining
- Large living area
- Office-study
Tags
Neighborhood map
What this means for you Summary
Snapshot
- This is a 3-bed/1.0-bath single-family listed at $115k.
Deal economics
- At list price, monthly cash flow is $650 ($8k/yr) — positive.
- The deal already cash-flows at list — no discount required.
- Meets the 1% rule at list price ($2k rent vs $115k).
- Recommended offer: $108k (6.0% below list) — sets the bar for market timing.
- Cap rate 13.1% vs local median 3.5% in Mount Pleasant — top-decile yield for the area; either an underpriced asset or a hidden risk that comps aren't pricing in. Stress-test before assuming the spread holds.
Location & tenants
- Location reads 77/100 on livability (#81 in TX, #2,808 nationally) — a middle-class / working-renter tenant base. Strengths: cost of living A+, housing A+, health & safety A+; Watch: employment C-, amenities D-, commute F.
- Mount Pleasant ISD (town): math 45% / reading 44% proficiency, ranked #291 of 826 in TX (top 35%) — families likely to look elsewhere, expect single-tenant / working-renter base with shorter leases; 74% free/reduced lunch — lower-income household profile, screen leases tightly.
- Zoned schools: Vivian Fowler El (math 47% / reading 37%, grade F, #1,335 of 4,322 statewide, top 33%, 404 students, 90% FRL) — zoned schools average 90% FRL vs 74% district-wide (16 pts higher); higher-poverty schools than district average — tighter screening recommended.
- Market conditions: 382 active listings in the ZIP; 2 comparable units currently listed for rent nearby; 47 units permitted in Titus County in 2024 (10 in 5+ unit buildings).
- This rent runs 42% of the median local income ($56k/yr) — at the standard rent-burdened threshold; future hikes will face affordability resistance.
Forward outlook
- Local home prices are declining (-3.0%/yr); year-one equity from $795 of loan paydown is wiped out by about $3k of value loss. Plan a longer hold.
- At projected returns (-3.0% appreciation + 3.0% rent growth), your $32k cash investment doubles in ~5 years — after that, you're playing with house money.
Negotiation context
- It's been on market 61 days — a 6% lower offer ($108k) is reasonable based on typical stale-listing flexibility.
- 7 sale attempts with the ask held roughly flat each time — persistent listings suggest the price (not the market) is what's stuck; bring a comps-based counter.
Risks & watch-outs
- Watch-outs: property tax is 2.8% of price; built in 1931 — expect roof / HVAC / electrical / plumbing capex.
- Climate carrying-cost: major wind risk, 27% chance of damaging wind over 30y; moderate wildfire risk; extreme-heat days projected 7→23/yr by 2055 (HVAC capex compounding) — expect insurance premiums to compound above CPI over the hold.
Questions for the listing agent
- It's been on market 61 days. Have you received any prior offers? Is the seller open to a 6% concession, seller financing, or rate buy-down credit?
- Built in 1931 — when were the roof, HVAC, electrical panel, plumbing, and water heater last replaced?
- Property tax is high relative to price — has the assessment been appealed recently, and will the sale trigger a re-assessment?
- Why hasn't it sold? Are there any deal-killer items the seller is aware of (foundation, flood, title, zoning, code violations)?
- Is there a deadline driving the sale (1031 exchange, divorce, estate, relocation)? That informs how much negotiation room exists.
- Schools are D-rated, which usually means shorter tenancies and higher turnover. Who's the typical renter profile here, and what's been the actual vacancy rate?
- What's the average days-on-market for RENTAL listings here right now (not sales)? A rising rental-DOM trend means longer vacancies and softer asking-rent achievability than the comps imply.
- What's the recent tenant-quality profile in this submarket — average credit score on applications, eviction rate, late-payment / NSF rate, and stable-employment percentage? A property-management company in the area should have these aggregated.
- How much new for-sale + rental construction is in the pipeline within 1–3 miles? Heavy new supply typically softens prices + rents 12–24 months out; constrained supply supports both.
Investment metrics
- 1% rule
- 1.73% ✓
- Cap rate
- 13.08%
- Cash-on-cash
- 24.24%
- DSCR
- 2.08
- GRM
- 4.8
CMA / ARV
- ARV (on-the-fly)
- $252,340
- Comps found
- 2
Show comp detail 2 sales within ~0.75 mi
| Address | Dist | Beds/Ba | Sqft | Sold | Price | $/sf | Match |
|---|---|---|---|---|---|---|---|
| 312 N Florey St | 0.72mi | 3/2.0 | 1,700 (+4%) | 13mo | $169,500 | $100 | 44 |
| 803 E 9th St | 0.61mi | 3/2.0 | 1,401 (-14%) | 11mo | $217,000 | $155 | 35 |
Match score weights: distance 35% · size 25% · config 20% · recency 20%. Top-matched comps best support the ARV.
Projected returns pro-forma
-3.0% appreciation · 3.0% rent growth · sell at horizon
- IRR
- 17.6%
- Equity multiple
- 1.71×
- Total profit
- $22,901
- Equity at exit
- $17,147
- IRR
- 26.1%
- Equity multiple
- 3.29×
- Total profit
- $73,720
- Equity at exit
- $9,943
Cash invested: $32,200 (down + closing). Projections, not guarantees.
Landlord ↔ Tenant lean methodology
- Overall (STATE)
- 87 Strongly Landlord-Friendly
- State Texas
- 87 Strongly Landlord-Friendly · R+5
- County
- — inherits STATE
- City
- — inherits STATE
ZIP-level market 75455
- Home prices YoY
- -27.0%
- Active inventory
- 382
- Price-to-rent
- 4.8×
Monthly cashflow live
- Estimated rent
- $1,987 medium interval (Pro) →
- Mortgage (P&I)
- −$603
- Tax from tax record
- −$268 /mo · $3,215/yr
- Insurance
- −$48
- HOA
- −$0
- Vacancy / Maint / Mgmt
- −$417
- Net cashflow
- $650
Break-even live
UW: 25.0% down · 7.5% · 30yr · 1.5% tax · 5.0% vac · 8.0% maint · 8.0% mgmt
Financing live
Cash to close
- Down payment
- $28,750
- Closing costs
- $3,450
- Reserves months
- —
- Total cash needed
- —
Loan-product check · same deal, 3 products live
Conventional
25% down · 7.5% · 30yr
- Down + closing
- —
- Monthly P&I
- —
- Monthly cashflow
- —
- DSCR
- —
- Eligible?
- —
Personal DTI + credit; lowest rate.
DSCR
20% down · 8.5% · 30yr
- Down + closing
- —
- Monthly P&I
- —
- Monthly cashflow
- —
- DSCR
- —
- Eligible?
- —
No personal income docs; deal must DSCR.
Hard money
10% down · 12.0% · 12mo
- Down + closing
- —
- Monthly P&I
- —
- Monthly cashflow
- —
- DSCR
- —
- Eligible?
- —
Short-term bridge; refi at stabilization.
Rent comps 2 comps
| Address | Beds | Baths | Sqft | Rent | $/sqft | DOM | Units | Dist |
|---|---|---|---|---|---|---|---|---|
| 172 W 17th St Mt Pleasant, TX | 3.0 | 2.5 | 1500 | $2,300 | $1.53 | 21d | 1 | 0.41mi |
| 111 W Holland St Mount Pleasant, TX | 3.0 | 1.0 | 1608 | $1,800 | $1.12 | 21d | 1 | 1.41mi |
Listing history 17 events
-
2025-12-29status Pending
Show marketing remark (236 chars)
Calling Investors! Spacious 3 bedroom 1 bath home with 1600+SF featuring a large living area with fireplace, formal dining, and office/study or potential 4th bedroom. All sitting on a large 0.41 acre corner lot. Opportunity is knocking!
-
2025-12-29status Pending 236-char remark
Show marketing remark (236 chars)
Calling Investors! Spacious 3 bedroom 1 bath home with 1600+SF featuring a large living area with fireplace, formal dining, and office/study or potential 4th bedroom. All sitting on a large 0.41 acre corner lot. Opportunity is knocking!
-
2025-12-16historical Active Option Contract
Show marketing remark (236 chars)
Calling Investors! Spacious 3 bedroom 2 bath home with 1600+SF featuring a large living area with fireplace, formal dining, and office/study or potential 4th bedroom. All sitting on a large 0.41 acre corner lot. Opportunity is knocking!
-
2025-12-16status Pending 236-char remark
Show marketing remark (236 chars)
Calling Investors! Spacious 3 bedroom 2 bath home with 1600+SF featuring a large living area with fireplace, formal dining, and office/study or potential 4th bedroom. All sitting on a large 0.41 acre corner lot. Opportunity is knocking!
-
2025-10-30status Active
Show marketing remark (236 chars)
Calling Investors! Spacious 3 bedroom 2 bath home with 1600+SF featuring a large living area with fireplace, formal dining, and office/study or potential 4th bedroom. All sitting on a large 0.41 acre corner lot. Opportunity is knocking!
-
2025-10-30status Active 236-char remark
Show marketing remark (236 chars)
Calling Investors! Spacious 3 bedroom 2 bath home with 1600+SF featuring a large living area with fireplace, formal dining, and office/study or potential 4th bedroom. All sitting on a large 0.41 acre corner lot. Opportunity is knocking!
-
2025-10-29historical Active Option Contract
Show marketing remark (236 chars)
Calling Investors! Spacious 3 bedroom 2 bath home with 1600+SF featuring a large living area with fireplace, formal dining, and office/study or potential 4th bedroom. All sitting on a large 0.41 acre corner lot. Opportunity is knocking!
-
2025-10-29status Pending 236-char remark
Show marketing remark (236 chars)
Calling Investors! Spacious 3 bedroom 2 bath home with 1600+SF featuring a large living area with fireplace, formal dining, and office/study or potential 4th bedroom. All sitting on a large 0.41 acre corner lot. Opportunity is knocking!
-
2025-10-29$115,000 Active
Show marketing remark (236 chars)
Calling Investors! Spacious 3 bedroom 2 bath home with 1600+SF featuring a large living area with fireplace, formal dining, and office/study or potential 4th bedroom. All sitting on a large 0.41 acre corner lot. Opportunity is knocking!
-
2025-10-21$115,000 Active 236-char remark
Show marketing remark (236 chars)
Calling Investors! Spacious 3 bedroom 1 bath home with 1600+SF featuring a large living area with fireplace, formal dining, and office/study or potential 4th bedroom. All sitting on a large 0.41 acre corner lot. Opportunity is knocking!
-
2025-10-20$115,000 Active 236-char remark
Show marketing remark (236 chars)
Calling Investors! Spacious 3 bedroom 2 bath home with 1600+SF featuring a large living area with fireplace, formal dining, and office/study or potential 4th bedroom. All sitting on a large 0.41 acre corner lot. Opportunity is knocking!
-
2025-10-16historical
-
2025-07-23price $145,000
-
2025-07-23price $145,000
-
2025-07-22price $145,000
-
2025-05-20$160,000 Active
-
2025-05-13$160,000 Active
ⓘ Source: listings_history table (triggers on properties + properties_extension) + one-shot
backfill from property_details.listing_events for pre-trigger history.
Tax reassessment forecast TX · Resets to sale price
- Current annual tax
- $3,215 · $268/mo
- Projected year-2 tax
- $3,215 · $268/mo
- Expected delta
- $0/yr ($0/mo · 0.0%)
ⓘ Screening estimate from a state-policy table — verify with the county assessor before closing.
Climate risk First Street
- Flood 1/10 Low FEMA zone X (unshaded) · 0% chance over 30 yrs
- Wildfire 5/10 Major
- Heat 7/10 Severe 7 d/yr ≥113°F today · 23 d/yr by 30 yrs out
- Wind 6/10 Major 27% chance of damaging wind over 30 yrs
- Air quality 2/10 Low 1 unhealthy d/yr today · 1 by 30 yrs out
Nearby sold comps map
Loading sold comps map…
Walkable amenities ~0.75 mi
Loading nearby amenities…
Taxation est. · year 1
- Rental income
- $23,839
- − Mortgage interest
- −$6,442
- − Property taxes
- −$3,215
- − Insurance
- −$575
- − Repairs & maintenance
- −$1,907
- − Management
- −$1,907
- − Depreciation
- −$3,345
- Taxable income
- $6,447
- Est. tax owed @ 24.0%
- −$1,547
- After-tax cash flow
- $6,258/yr
For passive investors: Depreciation is non-cash, so a rental often shows a tax loss while cash-flowing — sheltering income. Rental losses are passive: they offset passive income freely, and up to $25,000/yr can offset ordinary (W-2) income if you actively participate and your MAGI is under $100k (phasing out to $0 by $150k); unused losses carry forward. On sale, claimed depreciation is recaptured at up to 25%, and gains may owe capital-gains tax (a 1031 exchange can defer both). Figures are a year-1 estimate at your 24.0% rate — not tax advice; consult a CPA.
Schools (NCES district)
- District
- Mount Pleasant ISD
- NCES district ID
- 4831760
- Math proficiency
- 45% ▼ -7.00%
- Reading proficiency
- 44% ▲ 2.00%
- Median HH income
- $40,642
- Composite
- 37.35/100
- National rank
- #4437
- State rank
- #291 of 826 in TX
Livability — Mount Pleasant
- Score
- 77/100
- State rank
- #81
- US rank
- #2808
Category grades
Schools grade is shown separately in the Schools card above.
Census & demographics
- Census place
- Mount Pleasant, TX
- County
- Titus County · 26,903 people
- City population
- 26,903
- Metro
- Mount Pleasant, TX
- Population (ZIP)
- 26,903
- Household income
- $56,163
- Rent vs Own
- Severe rent burden
- 758.0
Population outlook (Titus County) Hauer SSP2
- Today (2025)
- 33,205 people
- By 2030
- 33,187 · -0.1%
- By 2040
- 32,931 · -0.8%
- By 2050
- 32,231 · -2.9%
- By 2075
- 29,507 · -11.1%
- By 2100
- 25,369 · -23.6%
Race, ethnicity, and origin ACS 2023
- Neighborhood character
- Diverse neighborhood (Simpson 0.61)
- Race & ethnicity
- Hispanic / Latino 45% White 42% Two or more races 15% Black 10% Asian 1%
- Hispanic origin (detail)
- Mexican 42%
- Common ancestry
- Lithuanian 1% Slovak 1% Italian 1%
- Foreign-born
- 18% · Canada, Vietnam
- Languages at home
- 61% English-only · Spanish 37% Vietnamese 1%
Political lean MEDSL · Titus
- 2024 margin
- Solid R (+54.7) · D 22.3% · R 77.0%
- 2008→2024 swing
- -23.5pp toward R · 2008: -31.2pp · 2024: -54.7pp
- All cycles
- 2024: R+54.7 2020: R+44.7 2016: R+42.1 2012: R+39.0 2008: R+31.2
Not yet ingested
- Civics
- —
Market trends
- HPI YoY
- ▼ -79.66%
- Current HPI
- 215.4205
- Rent YoY
- —
- Metro
- Mount Pleasant, TX
- State GDP YoY
- ▲ 3.95%
- F500 in state
- 110
Industry mix (Fortune 500 HQ in TX)
| Industry | F500 HQs | Revenue |
|---|---|---|
| Energy | 16 | $1,198B |
|
||
| Technology | 5 | $198B |
|
||
| Engineering / Construction | 4 | $72B |
|
||
| Energy Services | 3 | $60B |
|
||
| Utilities | 3 | $41B |
|
||
| Healthcare | 2 | $330B |
|
||
Price history
-28.1% since first listed17 events — show timeline
- 2025-12-29 Pending — NTREIS
- 2025-12-29 Pending — LAAR
- 2025-12-16 Contingent — NTREIS
- 2025-12-16 Pending — GTAR
- 2025-10-30 Relisted — NTREIS
- 2025-10-30 Relisted — GTAR
- 2025-10-29 Contingent — NTREIS
- 2025-10-29 Pending — GTAR
- 2025-10-29 Listed $115,000 NTREIS
- 2025-10-21 Listed $115,000 LAAR
- 2025-10-20 Listed $115,000 GTAR
- 2025-10-16 Listing Removed — NTREIS
- 2025-07-23 Price Changed $145,000 NTREIS
- 2025-07-23 Price Changed $145,000 LAAR
- 2025-07-22 Price Changed $145,000 GTAR
- 2025-05-20 Listed $160,000 LAAR
- 2025-05-13 Listed $160,000 NTREIS
Property tax history
+5.9%/yrLatest (2025): $3,215 · +56.4% YoY. Source: county tax records.
Cash-flow waterfall
monthlySold comps — $/sqft
last 12 mo · ≤1 miLoading sold comps…