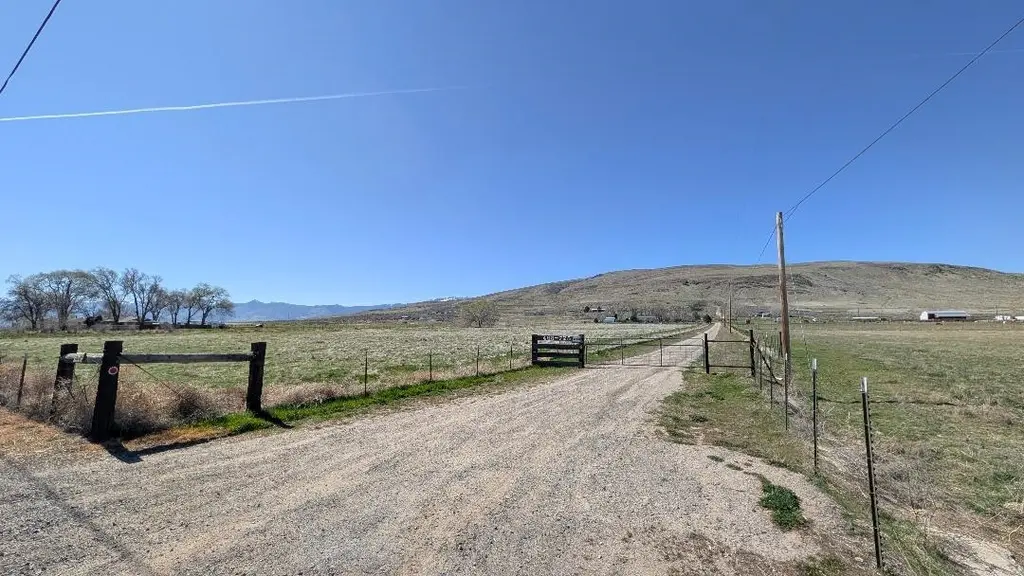
468-725 Standish Buntingville Rd · Janesville, CA
Flood risk 1/10 · Minimal
- FEMA flood zone
- X (unshaded)
- Chance of flooding over 30 yrs
- 0.0%
- Est. flood insurance / yr
- $507 – $1,088
Fire risk 5/10 · Moderate
- Est. fire insurance / yr
- $659 – $1,223
Heat risk 5/10 · Moderate
- Hot days now (above 93°F)
- 8 days/yr
- Hot days in 30 yrs
- 20 days/yr
Wind risk 1/10 · Minimal
- Chance of severe wind over 30 yrs
- —
Air-quality risk 10/10 · Severe
- Unhealthy air days now
- 26 days/yr
- Unhealthy air days in 30 yrs
- 28 days/yr
Risk factors via First Street. Map © Google.
Why this score? — see what drove the D grade
The composite is a weighted blend of 9 inputs, each scored 0–100. Each bar is that input's sub-score; the figure is the points it added to the 100-point composite (weight × sub-score).
- ARV discount +15.0/15.0
- Cash flow +8.0/30.0
- Appreciation +3.8/10.0
- Schools +3.2/10.0
- Livability +2.9/5.0
- Rent growth +2.5/5.0
- Condition / age +2.5/5.0
- 1% rule +2.1/10.0
- DSCR +2.0/10.0
$199,000
🖨 Deal sheet (PDF) 📄 Offer letter ✓ Due diligence
Listing remarks
If you are looking for acreage set up for horses and other farm animals, look no further. This property is perfectly set up for 4H families or anyone looking to live the small farm dream. The just over 9-acre property is fully fenced and cross fenced. The large horse barn is ready for both of your horses and is in great shape. The greenhouse is in the backyard as well as the chicken coop. The detached two car garage is oversized with multiple work benches and set-up for a workshop. If all of this was not enough, there are a few other outbuildings which are perfect for extra storage. The home is in need of extreme remodeling. It has split living with three bedrooms and two bathrooms on one s
Key facts
- Fully fenced
- Cross fenced
- Large horse barn
Tags
Neighborhood map
What this means for you Summary
Snapshot
- This is a 3-bed/3.0-bath single-family listed at $199k.
Deal economics
- At list price, monthly cash flow is $-207 ($-2k/yr) — negative.
- To cash-flow at today's rent, offer at most $162k (18.4% below list).
- To meet the 1% rule (rent ≥ 1% of price), the offer needs to be $141k (29.3% below list).
- Recommended offer: $141k (29.3% below list) — sets the bar for 1% rule.
- Cap rate 5.0% vs local median 2.7% in Janesville — top-decile yield for the area; either an underpriced asset or a hidden risk that comps aren't pricing in. Stress-test before assuming the spread holds.
Location & tenants
- Location reads 58/100 on livability (#686 in CA) — a working-class tenant base; expect higher turnover. Strengths: housing A+, crime A-, employment B; Watch: cost of living D, amenities F, commute F.
- Shaffer Union Elementary (rural): math 30% / reading 35% proficiency, ranked #925 of 1,400 in CA (top 66%) — families likely to look elsewhere, expect single-tenant / working-renter base with shorter leases.
- Zoned schools: Shaffer Elementary (math 32% / reading 27%, grade F, #856 of 1,571 statewide, top 57%, 207 students, 56% FRL); Lassen High (math 12% / reading 47%, grade F, #750 of 1,170 statewide, top 66%, 820 students, 33% FRL).
- Market conditions: 6 active listings in the ZIP; 6 units permitted in Lassen County in 2024 (0 in 5+ unit buildings).
Forward outlook
- Local home prices are declining (-2.4%/yr); year-one equity from $1k of loan paydown is wiped out by about $5k of value loss. Plan a longer hold.
- Lassen County population projected at -14% by 2050 — secular population decline; favor cash flow + early exit over multi-decade hold.
Negotiation context
- It's been on market 26 days — a 2% lower offer ($196k) is reasonable based on typical stale-listing flexibility.
Risks & watch-outs
- Climate carrying-cost: moderate wildfire risk; extreme-heat days projected 8→20/yr by 2055 (HVAC capex compounding) — expect insurance premiums to compound above CPI over the hold.
Questions for the listing agent
- What do current leases actually rent for vs. the listed asking? Can we see a recent rent roll and the last 12 months of T-12 income?
- Is there a deadline driving the sale (1031 exchange, divorce, estate, relocation)? That informs how much negotiation room exists.
- Schools are D-rated, which usually means shorter tenancies and higher turnover. Who's the typical renter profile here, and what's been the actual vacancy rate?
- The area grade is low — what's the realistic commute time and amenity access for the typical tenant pool here? Any planned neighborhood developments (good or bad) we should know about?
- What's the average days-on-market for RENTAL listings here right now (not sales)? A rising rental-DOM trend means longer vacancies and softer asking-rent achievability than the comps imply.
- What's the recent tenant-quality profile in this submarket — average credit score on applications, eviction rate, late-payment / NSF rate, and stable-employment percentage? A property-management company in the area should have these aggregated.
- How much new for-sale + rental construction is in the pipeline within 1–3 miles? Heavy new supply typically softens prices + rents 12–24 months out; constrained supply supports both.
Investment metrics
- 1% rule
- 0.71% ✗
- Cap rate
- 5.04%
- Cash-on-cash
- -4.46%
- DSCR
- 0.80
- GRM
- 11.8
CMA / ARV
- ARV (on-the-fly)
- $361,200
- Comps found
- 1
Show comp detail 1 sale within ~0.75 mi
| Address | Dist | Beds/Ba | Sqft | Sold | Price | $/sf | Match |
|---|---|---|---|---|---|---|---|
| 468-859 Beckett Loop Loop | 0.38mi | 3/2.0 | 1,815 (+8%) | 8mo | $389,900 | $215 | 59 |
Match score weights: distance 35% · size 25% · config 20% · recency 20%. Top-matched comps best support the ARV.
Projected returns pro-forma
-2.36% appreciation · 3.0% rent growth · sell at horizon
- IRR
- -19.3%
- Equity multiple
- 0.28×
- Total profit
- $-40,088
- Equity at exit
- $35,388
- IRR
- -12.5%
- Equity multiple
- 0.15×
- Total profit
- $-47,257
- Equity at exit
- $27,187
Cash invested: $55,720 (down + closing). Projections, not guarantees.
Landlord ↔ Tenant lean methodology
- Overall (STATE)
- 18 Strongly Tenant-Friendly
- State California
- 18 Strongly Tenant-Friendly · D+13
- County
- — inherits STATE
- City
- — inherits STATE
ZIP-level market 96128
- Home prices YoY
- -1.6%
- Active inventory
- 6
- Price-to-rent
- 11.8×
Monthly cashflow live
- Estimated rent
- $1,407 medium interval (Pro) →
- Mortgage (P&I)
- −$1,044
- Tax from tax record
- −$193 /mo · $2,312/yr
- Insurance
- −$83
- HOA
- −$0
- Vacancy / Maint / Mgmt
- −$296
- Net cashflow
- $-207
Break-even live
Sensitivity live
| Price | -10% $-95 | -5% $-151 | +0% $-207 | +5% $-264 | +10% $-320 |
|---|---|---|---|---|---|
| Rent | -10% $-318 | -5% $-263 | +0% $-207 | +5% $-152 | +10% $-96 |
| Rate | -1.0pp $-107 | -0.5pp $-157 | base $-207 | +0.5pp $-259 | +1.0pp $-311 |
UW: 25.0% down · 7.5% · 30yr · 1.5% tax · 5.0% vac · 8.0% maint · 8.0% mgmt
Financing live
Cash to close
- Down payment
- $49,750
- Closing costs
- $5,970
- Reserves months
- —
- Total cash needed
- —
Loan-product check · same deal, 3 products live
Conventional
25% down · 7.5% · 30yr
- Down + closing
- —
- Monthly P&I
- —
- Monthly cashflow
- —
- DSCR
- —
- Eligible?
- —
Personal DTI + credit; lowest rate.
DSCR
20% down · 8.5% · 30yr
- Down + closing
- —
- Monthly P&I
- —
- Monthly cashflow
- —
- DSCR
- —
- Eligible?
- —
No personal income docs; deal must DSCR.
Hard money
10% down · 12.0% · 12mo
- Down + closing
- —
- Monthly P&I
- —
- Monthly cashflow
- —
- DSCR
- —
- Eligible?
- —
Short-term bridge; refi at stabilization.
Listing history 13 events
-
2026-06-22days on market $199,000 Active 26 DOM
-
2026-06-21days on market $199,000 Active 25 DOM
-
2026-06-19days on market $199,000 Active 23 DOM
-
2026-06-18days on market $199,000 Active 22 DOM
-
2026-06-17days on market $199,000 Active 21 DOM
-
2026-06-16days on market $199,000 Active 20 DOM
-
2026-06-15days on market $199,000 Active 19 DOM
-
2026-06-14days on market $199,000 Active 17 DOM
-
2026-06-12days on market $199,000 Active 16 DOM
-
2026-06-09days on market $199,000 Active 13 DOM
-
2026-06-09status $199,000 Active 12 DOM
-
2026-03-31status Pending
-
2026-03-18$199,000 Active
ⓘ Source: listings_history table (triggers on properties + properties_extension) + one-shot
backfill from property_details.listing_events for pre-trigger history.
Tax reassessment forecast CA · Resets to sale price
- Current annual tax
- $2,312 · $193/mo
- Projected year-2 tax
- $2,312 · $193/mo
- Expected delta
- $0/yr ($0/mo · 0.0%)
ⓘ Screening estimate from a state-policy table — verify with the county assessor before closing.
Climate risk First Street
- Flood 1/10 Low FEMA zone X (unshaded) · 0% chance over 30 yrs
- Wildfire 5/10 Major
- Heat 5/10 Major 8 d/yr ≥93°F today · 20 d/yr by 30 yrs out
- Wind 1/10 Low
- Air quality 10/10 Extreme 26 unhealthy d/yr today · 28 by 30 yrs out
Nearby sold comps map
Loading sold comps map…
Walkable amenities ~0.75 mi
Loading nearby amenities…
Taxation est. · year 1
- Rental income
- $16,889
- − Mortgage interest
- −$11,147
- − Property taxes
- −$2,312
- − Insurance
- −$995
- − Repairs & maintenance
- −$1,351
- − Management
- −$1,351
- − Depreciation
- −$5,789
- Taxable loss
- −$6,056
- Est. tax savings @ 24.0%
- +$1,453
- After-tax cash flow
- $-1,034/yr
For passive investors: Depreciation is non-cash, so a rental often shows a tax loss while cash-flowing — sheltering income. Rental losses are passive: they offset passive income freely, and up to $25,000/yr can offset ordinary (W-2) income if you actively participate and your MAGI is under $100k (phasing out to $0 by $150k); unused losses carry forward. On sale, claimed depreciation is recaptured at up to 25%, and gains may owe capital-gains tax (a 1031 exchange can defer both). Figures are a year-1 estimate at your 24.0% rate — not tax advice; consult a CPA.
Schools (NCES district)
- District
- Shaffer Union Elementary
- NCES district ID
- 0636420
- Math proficiency
- 30% ▼ -5.00%
- Reading proficiency
- 35% ▼ -5.00%
- Median HH income
- $55,545
- Composite
- 31.53/100
- National rank
- #11160
- State rank
- #925 of 1400 in CA
Livability — Janesville
- Score
- 58/100
- State rank
- #686
- US rank
- #20909
Category grades
Schools grade is shown separately in the Schools card above.
Census & demographics
- City population
- 2,797
- Population (ZIP)
- 642
Population outlook (Lassen County) Hauer SSP2
- Today (2025)
- 27,112 people
- By 2030
- 26,732 · -1.4%
- By 2040
- 25,536 · -5.8%
- By 2050
- 23,262 · -14.2%
- By 2075
- 18,620 · -31.3%
- By 2100
- 14,679 · -45.9%
Race, ethnicity, and origin ACS 2023
- Neighborhood character
- Predominantly White (83%)
- Race & ethnicity
- White 83% Hispanic / Latino 16% Two or more races 11% Native American 4%
- Hispanic origin (detail)
- Mexican 15%
- Common ancestry
- Italian 17% Russian 14% Lithuanian 2%
- Foreign-born
- 2%
- Languages at home
- 96% English-only · Spanish 4%
Political lean MEDSL · Lassen
- 2024 margin
- Solid R (+54.0) · D 21.8% · R 75.8% · Other 2.4%
- 2008→2024 swing
- -19.8pp toward R · 2008: -34.2pp · 2024: -54.0pp
- All cycles
- 2024: R+54.0 2020: R+51.5 2016: R+51.3 2012: R+39.8 2008: R+34.2
Not yet ingested
- Civics
- —
Market trends
- HPI YoY
- ▼ -2.36%
- Current HPI
- 142.7854
- Rent YoY
- —
- Metro
- —
- State GDP YoY
- ▲ 3.21%
- F500 in state
- 116
Industry mix (Fortune 500 HQ in CA)
| Industry | F500 HQs | Revenue |
|---|---|---|
| Technology | 27 | $1,492B |
|
||
| Financial Services | 3 | $174B |
|
||
| Retail | 3 | $44B |
|
||
| Insurance | 3 | $26B |
|
||
| Media / Entertainment | 2 | $115B |
|
||
| Pharmaceuticals / Biotech | 2 | $62B |
|
||
Price history
2 events — show timeline
- 2026-03-31 Pending — TCAOR
- 2026-03-18 Listed $199,000 TCAOR
Property tax history
+2.4%/yrLatest (2025): $2,312 · +7.4% YoY. Source: county tax records.
Cash-flow waterfall
monthlySold comps — $/sqft
last 12 mo · ≤1 miLoading sold comps…