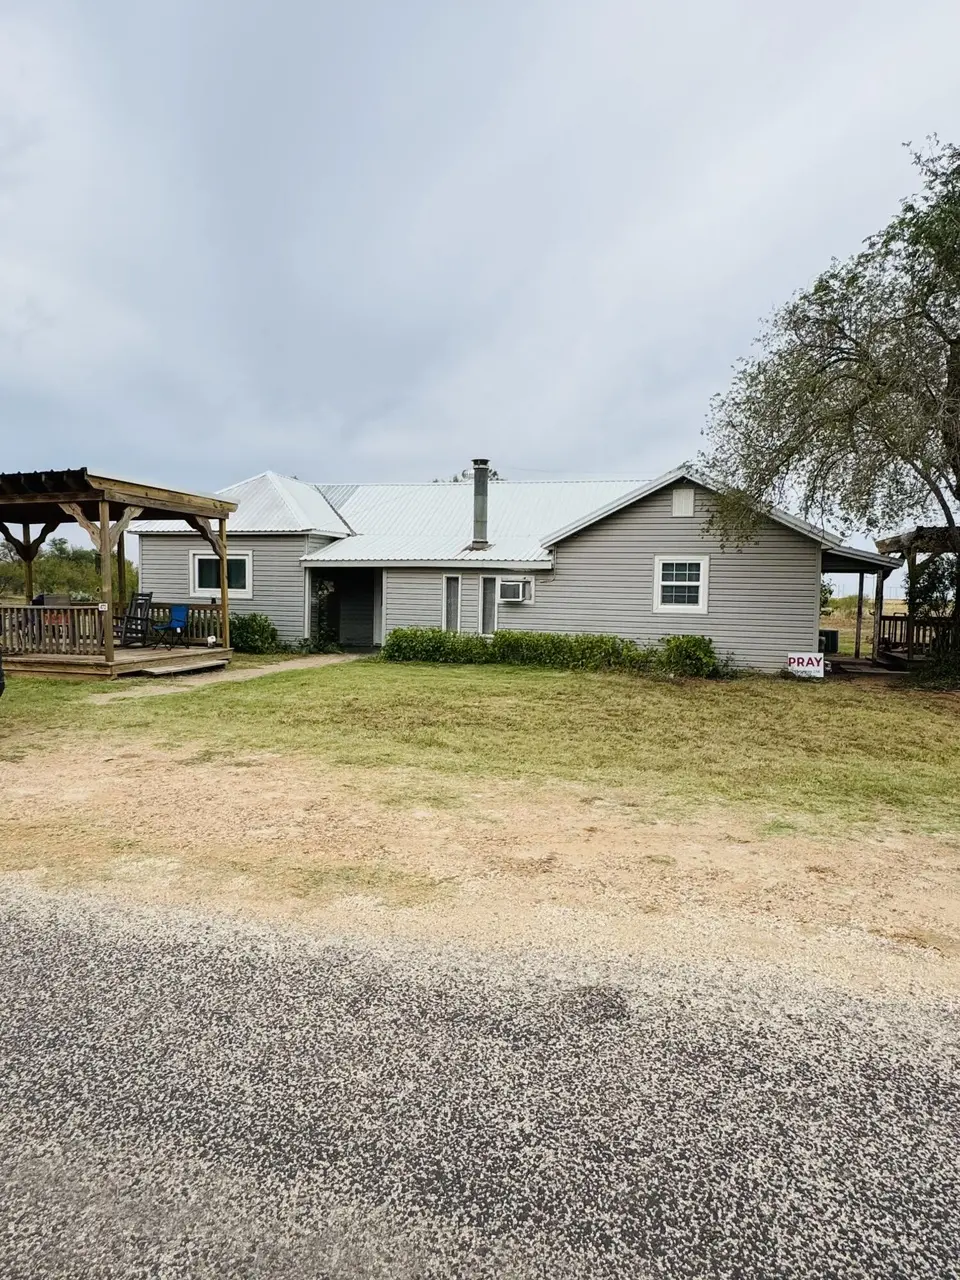
472 S Goodall Ave · Jayton, TX
Flood risk 1/10 · Minimal
- FEMA flood zone
- —
- Chance of flooding over 30 yrs
- 0.0%
- Est. flood insurance / yr
- —
Fire risk 6/10 · Moderate
- Est. fire insurance / yr
- $1,222 – $2,270
Heat risk 7/10 · Major
- Hot days now (above 105°F)
- 7 days/yr
- Hot days in 30 yrs
- 21 days/yr
Wind risk 3/10 · Minor
- Chance of severe wind over 30 yrs
- 6.0%
Air-quality risk 2/10 · Minimal
- Unhealthy air days now
- 1 days/yr
- Unhealthy air days in 30 yrs
- 1 days/yr
Risk factors via First Street. Map © Google.
Why this score? — see what drove the B+ grade
The composite is a weighted blend of 9 inputs, each scored 0–100. Each bar is that input's sub-score; the figure is the points it added to the 100-point composite (weight × sub-score).
- Cash flow +28.7/30.0
- ARV discount +15.0/15.0
- DSCR +10.0/10.0
- 1% rule +7.7/10.0
- Schools +5.4/10.0
- Appreciation +5.0/10.0
- Livability +3.1/5.0
- Rent growth +2.5/5.0
- Condition / age +2.5/5.0
$109,000
🖨 Deal sheet 📄 Offer letter ✓ Due diligence
Listing remarks MLS
This 4 bedroom 2 bath home is located in the highly acclaimed Jayton-Girard ISD. It is 0ver 2000 square feet and includes almost 1 acre (10 lots) of land. The home has a shop and pens for show animals. Plenty of space to garden, roam or add an RV park!! Lots of potential!!
Key facts
- Shop and pens
- Space to garden
- Space to roam
Tags
Neighborhood map
What this means for you Summary
Snapshot
- This is a 4-bed/2.0-bath single-family listed at $109k.
Deal economics
- At list price, monthly cash flow is $364 ($4k/yr) — positive.
- The deal already cash-flows at list — no discount required.
- Meets the 1% rule at list price ($1k rent vs $109k).
- Recommended offer: $99k (9.0% below list) — sets the bar for market timing.
Location & tenants
- Location reads 61/100 on livability (#1,009 in TX) — a middle-class / working-renter tenant base. Strengths: cost of living A+; Watch: employment C-, health & safety C-, crime F.
- Jayton-Girard ISD (rural): math 60% / reading 65% proficiency, ranked #116 of 1,141 in TX (top 10%) — acceptable for families but not a draw, mixed tenant base, ~2y average lease.
- Market conditions: 1 active listings in the ZIP.
Forward outlook
- In year one you build about $4k of equity ($754 loan paydown + $3k appreciation (3.0% local appreciation)).
- Kent County population projected to shrink 5% by 2050 — rents likely to lag national; underwrite the cash flow, not the appreciation.
- At projected returns (3.0% appreciation + 3.0% rent growth), your $31k cash investment doubles in ~4 years — after that, you're playing with house money.
- By year 9, paydown + projected appreciation supports a ~$34k cash-out refi (75% LTV) — recoverable capital for the next deal without selling this one.
Negotiation context
- It's been on market 106 days — a 9% lower offer ($99k) is reasonable based on typical stale-listing flexibility.
Risks & watch-outs
- Climate carrying-cost: major wildfire risk; extreme-heat days projected 7→21/yr by 2055 (HVAC capex compounding) — expect insurance premiums to compound above CPI over the hold.
Questions for the listing agent
- It's been on market 106 days. Have you received any prior offers? Is the seller open to a 9% concession, seller financing, or rate buy-down credit?
- Built in 1960 — when were the roof, HVAC, electrical panel, plumbing, and water heater last replaced?
- Why hasn't it sold? Are there any deal-killer items the seller is aware of (foundation, flood, title, zoning, code violations)?
- Is there a deadline driving the sale (1031 exchange, divorce, estate, relocation)? That informs how much negotiation room exists.
- Crime grade is F in this area — have there been break-ins, vandalism, or insurance claims at this property in the last 3 years? What carrier currently insures it and at what premium?
- What's the average days-on-market for RENTAL listings here right now (not sales)? A rising rental-DOM trend means longer vacancies and softer asking-rent achievability than the comps imply.
- What's the recent tenant-quality profile in this submarket — average credit score on applications, eviction rate, late-payment / NSF rate, and stable-employment percentage? A property-management company in the area should have these aggregated.
- How much new for-sale + rental construction is in the pipeline within 1–3 miles? Heavy new supply typically softens prices + rents 12–24 months out; constrained supply supports both.
Investment metrics
- 1% rule
- 1.27% ✓
- Cap rate
- 10.31%
- Cash-on-cash
- 14.33%
- DSCR
- 1.64
- GRM
- 6.6
CMA / ARV
- ARV (median comp)
- $135,574
- List price
- $109,000
- Delta
- -19.60%
- Verdict
- UNDERPRICED
- Comps
- 2 within 1.0 mi
Show comp detail 1 sale within ~0.75 mi
| Address | Dist | Beds/Ba | Sqft | Sold | Price | $/sf | Match |
|---|---|---|---|---|---|---|---|
| 809 N Main St | 0.68mi | 3/2.0 (-1) | 1,785 (-12%) | 3mo | $139,900 | $78 | 42 |
Match score weights: distance 35% · size 25% · config 20% · recency 20%. Top-matched comps best support the ARV.
Projected returns pro-forma
3.0% appreciation · 3.0% rent growth · sell at horizon
- IRR
- 20.9%
- Equity multiple
- 2.19×
- Total profit
- $36,347
- Equity at exit
- $49,011
- IRR
- 22.0%
- Equity multiple
- 4.17×
- Total profit
- $96,881
- Equity at exit
- $75,532
Cash invested: $30,520 (down + closing). Projections, not guarantees.
Landlord ↔ Tenant lean methodology
- Overall (STATE)
- 87 Strongly Landlord-Friendly
- State Texas
- 87 Strongly Landlord-Friendly · R+5
- County
- — inherits STATE
- City
- — inherits STATE
ZIP-level market 79528
- Active inventory
- 1
- Price-to-rent
- 6.6×
Monthly cashflow live
- Estimated rent
- $1,379 medium interval (Pro) →
- Mortgage (P&I)
- −$572
- Tax from tax record
- −$108 /mo · $1,299/yr
- Insurance
- −$45
- HOA
- −$0
- Vacancy / Maint / Mgmt
- −$290
- Net cashflow
- $364
Break-even live
UW: 25.0% down · 7.5% · 30yr · 1.5% tax · 5.0% vac · 8.0% maint · 8.0% mgmt
Financing live
Cash to close
- Down payment
- $27,250
- Closing costs
- $3,270
- Reserves months
- —
- Total cash needed
- —
Loan-product check · same deal, 3 products live
Conventional
25% down · 7.5% · 30yr
- Down + closing
- —
- Monthly P&I
- —
- Monthly cashflow
- —
- DSCR
- —
- Eligible?
- —
Personal DTI + credit; lowest rate.
DSCR
20% down · 8.5% · 30yr
- Down + closing
- —
- Monthly P&I
- —
- Monthly cashflow
- —
- DSCR
- —
- Eligible?
- —
No personal income docs; deal must DSCR.
Hard money
10% down · 12.0% · 12mo
- Down + closing
- —
- Monthly P&I
- —
- Monthly cashflow
- —
- DSCR
- —
- Eligible?
- —
Short-term bridge; refi at stabilization.
Listing history 16 events
-
2026-06-18days on market $109,000 Active 106 DOM
-
2026-06-17days on market $109,000 Active 105 DOM
-
2026-06-16days on market $109,000 Active 104 DOM
-
2026-06-15days on market $109,000 Active 103 DOM
-
2026-06-13days on market $109,000 Active 101 DOM
-
2026-06-12days on market $109,000 Active 100 DOM
-
2026-06-10days on market $109,000 Active 97 DOM
-
2026-06-08days on market $109,000 Active 96 DOM
-
2026-06-08days on market $109,000 Active 95 DOM
-
2026-06-05days on market $109,000 Active 93 DOM
-
2026-06-03days on market $109,000 Active 91 DOM
-
2026-06-02days on market $109,000 Active 90 DOM
-
2026-06-01days on market $109,000 Active 89 DOM
-
2026-05-31days on market $109,000 Active 88 DOM
-
2026-05-12price $109,000 274-char remark
Show marketing remark (274 chars)
This 4 bedroom 2 bath home is located in the highly acclaimed Jayton-Girard ISD. It is 0ver 2000 square feet and includes almost 1 acre (10 lots) of land. The home has a shop and pens for show animals. Plenty of space to garden, roam or add an RV park!! Lots of potential!!
-
2026-03-03$120,000 Active 274-char remark
Show marketing remark (274 chars)
This 4 bedroom 2 bath home is located in the highly acclaimed Jayton-Girard ISD. It is 0ver 2000 square feet and includes almost 1 acre (10 lots) of land. The home has a shop and pens for show animals. Plenty of space to garden, roam or add an RV park!! Lots of potential!!
ⓘ Source: listings_history table (triggers on properties + properties_extension) + one-shot
backfill from property_details.listing_events for pre-trigger history.
Tax reassessment forecast TX · Resets to sale price
- Current annual tax
- $1,299 · $108/mo
- Projected year-2 tax
- $1,995 · $166/mo
- Expected delta
- +$696/yr (+$58/mo · 53.6%)
ⓘ Screening estimate from a state-policy table — verify with the county assessor before closing.
Climate risk First Street
- Flood 1/10 Low 0% chance over 30 yrs
- Wildfire 6/10 Major
- Heat 7/10 Severe 7 d/yr ≥105°F today · 21 d/yr by 30 yrs out
- Wind 3/10 Moderate 6% chance of damaging wind over 30 yrs
- Air quality 2/10 Low 1 unhealthy d/yr today · 1 by 30 yrs out
Nearby sold comps map
Loading sold comps map…
Walkable amenities ~0.75 mi
Loading nearby amenities…
Taxation est. · year 1
- Rental income
- $16,552
- − Mortgage interest
- −$6,106
- − Property taxes
- −$1,299
- − Insurance
- −$545
- − Repairs & maintenance
- −$1,324
- − Management
- −$1,324
- − Depreciation
- −$3,171
- Taxable income
- $2,784
- Est. tax owed @ 24.0%
- −$668
- After-tax cash flow
- $3,705/yr
For passive investors: Depreciation is non-cash, so a rental often shows a tax loss while cash-flowing — sheltering income. Rental losses are passive: they offset passive income freely, and up to $25,000/yr can offset ordinary (W-2) income if you actively participate and your MAGI is under $100k (phasing out to $0 by $150k); unused losses carry forward. On sale, claimed depreciation is recaptured at up to 25%, and gains may owe capital-gains tax (a 1031 exchange can defer both). Figures are a year-1 estimate at your 24.0% rate — not tax advice; consult a CPA.
Schools (NCES district)
- District
- Jayton-Girard ISD
- NCES district ID
- 4824660
- Math proficiency
- 60% ▬ 0.00%
- Reading proficiency
- 65% ▬ 0.00%
- Median HH income
- $44,625
- Composite
- 54.14/100
- National rank
- #2972
- State rank
- #116 of 1141 in TX
Livability — Jayton
- Score
- 61/100
- State rank
- #1009
- US rank
- #17935
Category grades
Schools grade is shown separately in the Schools card above.
Census & demographics
- Census place
- Jayton, TX
- Population (ZIP)
- 568
Population outlook (Kent County) Hauer SSP2
- Today (2025)
- 767 people
- By 2030
- 777 · +1.3%
- By 2040
- 753 · -1.8%
- By 2050
- 732 · -4.6%
- By 2075
- 750 · -2.2%
- By 2100
- 794 · +3.5%
Race, ethnicity, and origin ACS 2023
- Neighborhood character
- Predominantly White (83%)
- Race & ethnicity
- White 83% Hispanic / Latino 14% Two or more races 8%
- Hispanic origin (detail)
- Mexican 12% Puerto Rican 2%
- Common ancestry
- Slovak 9% Lithuanian 2% Hungarian 1%
- Languages at home
- 91% English-only · Spanish 9%
Political lean MEDSL · Kent
- 2024 margin
- Solid R (+76.4) · D 11.2% · R 87.6% · Other 1.1%
- 2008→2024 swing
- -22.2pp toward R · 2008: -54.2pp · 2024: -76.4pp
- All cycles
- 2024: R+76.4 2020: R+78.8 2016: R+69.5 2012: R+66.3 2008: R+54.2
Not yet ingested
- Civics
- —
Market trends
- HPI YoY
- —
- Current HPI
- —
- Rent YoY
- —
- Metro
- —
- State GDP YoY
- ▲ 3.95%
- F500 in state
- 110
Industry mix (Fortune 500 HQ in TX)
| Industry | F500 HQs | Revenue |
|---|---|---|
| Energy | 16 | $1,198B |
|
||
| Technology | 5 | $198B |
|
||
| Engineering / Construction | 4 | $72B |
|
||
| Energy Services | 3 | $60B |
|
||
| Utilities | 3 | $41B |
|
||
| Healthcare | 2 | $330B |
|
||
Price history
-9.2% since first listed2 events — show timeline
- 2026-05-12 Price Changed $109,000 LARMLS
- 2026-03-03 Listed $120,000 LARMLS
Property tax history
+7.6%/yrLatest (2025): $1,299 · +4.4% YoY. Source: county tax records.
Cash-flow waterfall
monthlySold comps — $/sqft
last 12 mo · ≤1 miLoading sold comps…