60 Fern Cir · Winchendon, MA
Flood risk 1/10 · Minimal
- FEMA flood zone
- X (unshaded)
- Chance of flooding over 30 yrs
- 0.0%
- Est. flood insurance / yr
- $507 – $1,088
Fire risk 1/10 · Minimal
- Est. fire insurance / yr
- $507 – $941
Heat risk 2/10 · Minimal
- Hot days now (above 91°F)
- 7 days/yr
- Hot days in 30 yrs
- 17 days/yr
Wind risk 4/10 · Minor
- Chance of severe wind over 30 yrs
- 17.0%
Air-quality risk 2/10 · Minimal
- Unhealthy air days now
- 1 days/yr
- Unhealthy air days in 30 yrs
- 1 days/yr
Risk factors via First Street. Map © Google.
Why this score? — see what drove the A grade
The composite is a weighted blend of 9 inputs, each scored 0–100. Each bar is that input's sub-score; the figure is the points it added to the 100-point composite (weight × sub-score).
- Cash flow +30.0/30.0
- ARV discount +15.0/15.0
- 1% rule +10.0/10.0
- DSCR +10.0/10.0
- Appreciation +10.0/10.0
- Livability +3.6/5.0
- Schools +2.7/10.0
- Rent growth +2.5/5.0
- Condition / age +2.5/5.0
$100,000
🖨 Deal sheet 📄 Offer letter ✓ Due diligence
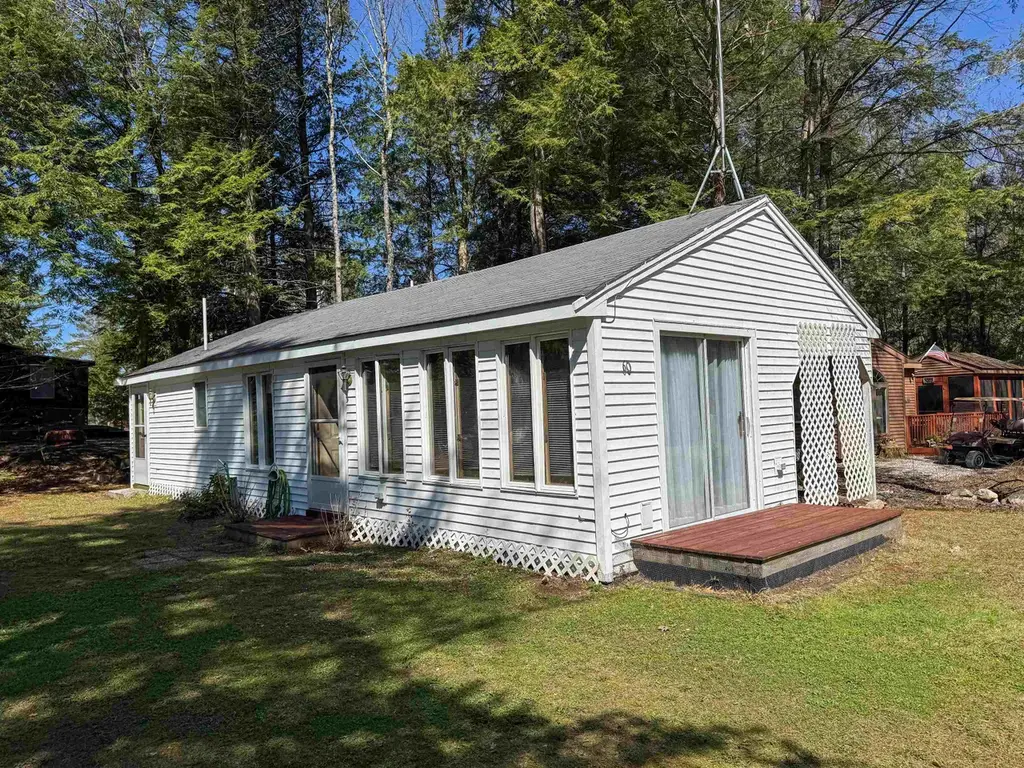
Listing remarks
Welcome to Woodbrook Camp and Tennis Club on Sip Pond in Fitzwilliam, NH where you own the home and the land it’s on! Woodbrook is the place where you can relax and enjoy all that the great outdoors has to offer. This well-cared-for home can be yours starting this summer! While you may never leave the huge front yard there are two bedrooms (one with a separate entrance!) and two bunk beds. The roomy kitchen, dining & living room areas all come completely furnished. BONUS: the Golf Cart, gas grill, tv, and canoe are all included at no additional cost! Woodbrook's amenities include an inground pool, playground, boat rack, showers, tennis, pickleball, bocce, basketball courts and m
Key facts
- Huge front yard
- Tv included
- Golf cart included
Tags
Property features AI
Finance
- Other: Located in the Woodbrook mobile park; Seasonal property; Sale includes equipment, land/building, manufactured home, outbuilding, and furnishings
- HOA & community: Annual association fee of 1850; Association fees may include electric, heat, hot water, landscaping, plowing, recreation, sewer, water, master insurance, clubhouse access, playground and recreation facilities
Exterior
- Utilities: Community water; Community sewer; 100 Amp electric service; High-speed internet available; LP/Bottle gas
- Home design: Manufactured/Mobile home; Pre-construction status; Shingle roof; Entry facing unknown
- Construction: Built in 2006; Wood frame with vinyl siding
- Exterior features: Country setting; Lake access; Wooded lot; Gravel driveway
Interior
- Kitchen: Refrigerator
- Bathrooms: 1 full bathroom
- Heating & cooling: Electric heat
- Interior features: 5 total rooms
Neighborhood map
What this means for you Summary
Snapshot
- This is a 1-bed/1.0-bath manufactured listed at $100k.
Deal economics
- At list price, monthly cash flow is $562 ($7k/yr) — positive.
- The deal already cash-flows at list — no discount required.
- Meets the 1% rule at list price ($2k rent vs $100k).
- Recommended offer: $97k (3.0% below list) — sets the bar for market timing.
- Cap rate 13.0% vs local median 4.2% in Winchendon — top-decile yield for the area; either an underpriced asset or a hidden risk that comps aren't pricing in. Stress-test before assuming the spread holds.
Location & tenants
- Location reads 71/100 on livability (#125 in MA) — a middle-class / working-renter tenant base. Strengths: housing A+, health & safety A+, crime A-; Watch: schools F, amenities F.
- Monadnock Regional School District (rural): math 25% / reading 36% proficiency, ranked #82 of 98 in NH (top 84%) — families likely to look elsewhere, expect single-tenant / working-renter base with shorter leases.
- Market conditions: 166 units permitted in Cheshire County in 2024 (0 in 5+ unit buildings).
Forward outlook
- In year one you build about $11k of equity ($691 loan paydown + $10k appreciation (10.0% local appreciation)).
- Cheshire County population projected at -18% by 2050 — secular population decline; favor cash flow + early exit over multi-decade hold.
- At projected returns (10.0% appreciation + 3.0% rent growth), your $28k cash investment doubles in ~2 years — after that, you're playing with house money.
- By year 4, paydown + projected appreciation supports a ~$38k cash-out refi (75% LTV) — recoverable capital for the next deal without selling this one.
Negotiation context
- It's been on market 54 days — a 3% lower offer ($97k) is reasonable based on typical stale-listing flexibility.
- 2 sale attempts with the ask held roughly flat each time — persistent listings suggest the price (not the market) is what's stuck; bring a comps-based counter.
- Current owner paid $43k; list at $100k implies a 133% gain — meaningful room to come down on a strong offer.
Questions for the listing agent
- It's been on market 54 days. Have you received any prior offers? Is the seller open to a 3% concession, seller financing, or rate buy-down credit?
- What does the HOA fee cover, when was the last increase, and are there any pending special assessments or reserve-fund shortfalls?
- Is there a deadline driving the sale (1031 exchange, divorce, estate, relocation)? That informs how much negotiation room exists.
- Schools are F-rated, which usually means shorter tenancies and higher turnover. Who's the typical renter profile here, and what's been the actual vacancy rate?
- What's the average days-on-market for RENTAL listings here right now (not sales)? A rising rental-DOM trend means longer vacancies and softer asking-rent achievability than the comps imply.
- What's the recent tenant-quality profile in this submarket — average credit score on applications, eviction rate, late-payment / NSF rate, and stable-employment percentage? A property-management company in the area should have these aggregated.
- How much new for-sale + rental construction is in the pipeline within 1–3 miles? Heavy new supply typically softens prices + rents 12–24 months out; constrained supply supports both.
Investment metrics
- 1% rule
- 1.87% ✓
- Cap rate
- 13.04%
- Cash-on-cash
- 24.10%
- DSCR
- 2.07
- GRM
- 4.5
CMA / ARV
- ARV (median comp)
- $129,675
- List price
- $100,000
- Delta
- -22.88%
- Verdict
- UNDERPRICED
- Comps
- 8 within 1.0 mi
Show comp detail 2 sales within ~0.75 mi
| Address | Dist | Beds/Ba | Sqft | Sold | Price | $/sf | Match |
|---|---|---|---|---|---|---|---|
| 76 Lakeside Dr | 0.06mi | 2/1.0 (+1) | 748 (-4%) | 11mo | $65,000 | $87 | 76 |
| 63 Brook Side Rd | 0.26mi | 2/1.0 (+1) | 760 (-3%) | 13mo | $135,000 | $178 | 67 |
Match score weights: distance 35% · size 25% · config 20% · recency 20%. Top-matched comps best support the ARV.
Projected returns pro-forma
10.0% appreciation · 3.0% rent growth · sell at horizon
- IRR
- 42.5%
- Equity multiple
- 4.23×
- Total profit
- $90,444
- Equity at exit
- $90,088
- IRR
- 36.7%
- Equity multiple
- 9.52×
- Total profit
- $238,502
- Equity at exit
- $194,278
Cash invested: $28,000 (down + closing). Projections, not guarantees.
Landlord ↔ Tenant lean methodology
- Overall (STATE)
- 20 Strongly Tenant-Friendly
- State Massachusetts
- 20 Strongly Tenant-Friendly · D+15
- County
- — inherits STATE
- City
- — inherits STATE
ZIP-level market 03447
- Home prices YoY
- 24.0%
- Price-to-rent
- 4.5×
Monthly cashflow live
- Estimated rent
- $1,867 medium interval (Pro) →
- Mortgage (P&I)
- −$524
- Tax from tax record
- −$192 /mo · $2,306/yr
- Insurance
- −$42
- HOA
- −$154
- Vacancy / Maint / Mgmt
- −$392
- Net cashflow
- $562
Break-even live
UW: 25.0% down · 7.5% · 30yr · 1.5% tax · 5.0% vac · 8.0% maint · 8.0% mgmt
Financing live
Cash to close
- Down payment
- $25,000
- Closing costs
- $3,000
- Reserves months
- —
- Total cash needed
- —
Loan-product check · same deal, 3 products live
Conventional
25% down · 7.5% · 30yr
- Down + closing
- —
- Monthly P&I
- —
- Monthly cashflow
- —
- DSCR
- —
- Eligible?
- —
Personal DTI + credit; lowest rate.
DSCR
20% down · 8.5% · 30yr
- Down + closing
- —
- Monthly P&I
- —
- Monthly cashflow
- —
- DSCR
- —
- Eligible?
- —
No personal income docs; deal must DSCR.
Hard money
10% down · 12.0% · 12mo
- Down + closing
- —
- Monthly P&I
- —
- Monthly cashflow
- —
- DSCR
- —
- Eligible?
- —
Short-term bridge; refi at stabilization.
HOA detail
- Monthly dues
- $154 · $1,848/yr
- Likely covers
- gaspool
Listing history 20 events
-
2026-06-19days on market $100,000 Active 54 DOM
-
2026-06-18days on market $100,000 Active 53 DOM
-
2026-06-17days on market $100,000 Active 52 DOM
-
2026-06-16days on market $100,000 Active 51 DOM
-
2026-06-15days on market $100,000 Active 50 DOM
-
2026-06-14days on market $100,000 Active 48 DOM
-
2026-06-12days on market $100,000 Active 47 DOM
-
2026-06-09days on market $100,000 Active 44 DOM
-
2026-06-08days on market $100,000 Active 43 DOM
-
2026-06-07days on market $100,000 Active 42 DOM
-
2026-06-07days on market $100,000 Active 41 DOM
-
2026-06-03days on market $100,000 Active 38 DOM
-
2026-06-02days on market $100,000 Active 37 DOM
-
2026-06-01days on market $100,000 Active 36 DOM
-
2026-05-31days on market $100,000 Active 35 DOM
-
2026-05-30days on market $100,000 Active 34 DOM
-
2026-04-29status Active 1496-char remark
-
2026-04-27status Pending 1496-char remark
-
2026-04-24$100,000 Active 1496-char remark
-
2004-11-19soldstatus $43,000
ⓘ Source: listings_history table (triggers on properties + properties_extension) + one-shot
backfill from property_details.listing_events for pre-trigger history.
Tax reassessment forecast MA · Partial reset (capped growth)
- Current annual tax
- $2,306 · $192/mo
- Projected year-2 tax
- $2,306 · $192/mo
- Expected delta
- $0/yr ($0/mo · 0.0%)
ⓘ Screening estimate from a state-policy table — verify with the county assessor before closing.
Climate risk First Street
- Flood 1/10 Low FEMA zone X (unshaded) · 0% chance over 30 yrs
- Wildfire 1/10 Low
- Heat 2/10 Low 7 d/yr ≥91°F today · 17 d/yr by 30 yrs out
- Wind 4/10 Moderate 17% chance of damaging wind over 30 yrs
- Air quality 2/10 Low 1 unhealthy d/yr today · 1 by 30 yrs out
Nearby sold comps map
Loading sold comps map…
Walkable amenities ~0.75 mi
Loading nearby amenities…
Taxation est. · year 1
- Rental income
- $22,399
- − Mortgage interest
- −$5,602
- − Property taxes
- −$2,306
- − Insurance
- −$500
- − Repairs & maintenance
- −$1,792
- − Management
- −$1,792
- − HOA
- −$1,848
- − Depreciation
- −$2,909
- Taxable income
- $5,651
- Est. tax owed @ 24.0%
- −$1,356
- After-tax cash flow
- $5,392/yr
For passive investors: Depreciation is non-cash, so a rental often shows a tax loss while cash-flowing — sheltering income. Rental losses are passive: they offset passive income freely, and up to $25,000/yr can offset ordinary (W-2) income if you actively participate and your MAGI is under $100k (phasing out to $0 by $150k); unused losses carry forward. On sale, claimed depreciation is recaptured at up to 25%, and gains may owe capital-gains tax (a 1031 exchange can defer both). Figures are a year-1 estimate at your 24.0% rate — not tax advice; consult a CPA.
Schools (NCES district)
- District
- Monadnock Regional School District
- NCES district ID
- 3304890
- Math proficiency
- 25% ▼ -16.00%
- Reading proficiency
- 36% ▼ -6.00%
- Median HH income
- $56,314
- Composite
- 27.18/100
- National rank
- #7024
- State rank
- #82 of 98 in NH
Livability — Winchendon
- Score
- 71/100
- State rank
- #125
- US rank
- #6726
Category grades
Schools grade is shown separately in the Schools card above.
Census & demographics
- Population (ZIP)
- 2,317
Population outlook (Cheshire County) Hauer SSP2
- Today (2025)
- 74,613 people
- By 2030
- 72,495 · -2.8%
- By 2040
- 66,778 · -10.5%
- By 2050
- 60,963 · -18.3%
- By 2075
- 49,511 · -33.6%
- By 2100
- 39,687 · -46.8%
Race, ethnicity, and origin ACS 2023
- Neighborhood character
- Predominantly White (91%)
- Race & ethnicity
- White 91% Two or more races 8% Hispanic / Latino 7%
- Hispanic origin (detail)
- Puerto Rican 6%
- Common ancestry
- Lithuanian 11% Romanian 7% Slovene 4%
- Foreign-born
- 2% · Canada
- Languages at home
- 94% English-only · Spanish 5% French/Haitian/Cajun 1%
Political lean MEDSL · Cheshire
- 2024 margin
- Lean D (+9.8) · D 54.4% · R 44.6% · Other 1.1%
- 2008→2024 swing
- -17.8pp toward R · 2008: 27.6pp · 2024: 9.8pp
- All cycles
- 2024: D+9.8 2020: D+17.2 2016: D+12.6 2012: D+24.8 2008: D+27.6
Not yet ingested
- Civics
- —
Market trends
- HPI YoY
- ▲ 76.42%
- Current HPI
- 394.7824
- Rent YoY
- —
- Metro
- —
- State GDP YoY
- ▲ 2.28%
- F500 in state
- 38
Industry mix (Fortune 500 HQ in MA)
| Industry | F500 HQs | Revenue |
|---|---|---|
| Technology | 3 | $17B |
|
||
| Insurance | 2 | $84B |
|
||
| Retail | 2 | $76B |
|
||
| Life Sciences | 1 | $43B |
|
||
| Energy Technology | 1 | $31B |
|
||
| Aerospace / Defense | 1 | $18B |
|
||
Price history
+132.6% since first listed4 events — show timeline
- 2026-04-29 Relisted — PrimeMLS
- 2026-04-27 Pending — PrimeMLS
- 2026-04-24 Listed $100,000 PrimeMLS
- 2004-11-19 Sold (Public Records) $43,000 Public Records
Property tax history
+5.7%/yrLatest (2024): $2,306 · +8.0% YoY. Source: county tax records.
Cash-flow waterfall
monthlySold comps — $/sqft
last 12 mo · ≤1 miLoading sold comps…