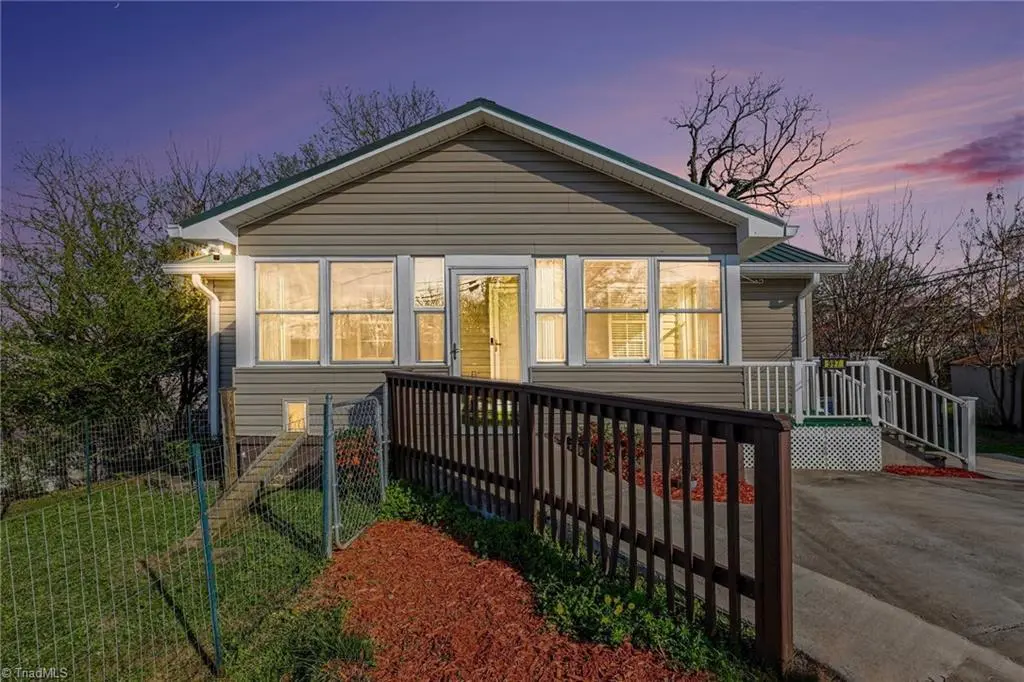
997 Robbins Cir · Lexington, NC
Flood risk 1/10 · Minimal
- FEMA flood zone
- X (unshaded)
- Chance of flooding over 30 yrs
- 0.0%
- Est. flood insurance / yr
- $507 – $1,088
Fire risk 1/10 · Minimal
- Est. fire insurance / yr
- $906 – $1,684
Heat risk 6/10 · Moderate
- Hot days now (above 104°F)
- 7 days/yr
- Hot days in 30 yrs
- 17 days/yr
Wind risk 4/10 · Minor
- Chance of severe wind over 30 yrs
- 13.0%
Air-quality risk 2/10 · Minimal
- Unhealthy air days now
- 1 days/yr
- Unhealthy air days in 30 yrs
- 2 days/yr
Risk factors via First Street. Map © Google.
Why this score? — see what drove the F grade
The composite is a weighted blend of 9 inputs, each scored 0–100. Each bar is that input's sub-score; the figure is the points it added to the 100-point composite (weight × sub-score).
- Cash flow +10.2/30.0
- ARV discount +4.9/15.0
- Livability +3.6/5.0
- DSCR +2.9/10.0
- Rent growth +2.8/5.0
- Schools +2.8/10.0
- Condition / age +2.5/5.0
- 1% rule +1.7/10.0
- Appreciation +0.0/10.0
$169,900
🖨 Deal sheet (PDF) 📄 Offer letter ✓ Due diligence
Listing remarks MLS
Cozy Cottage! 2 Bedroom, 1 bath, in city Nicely Landscaped, Move in ready. Like New
Key facts
- Separate entrance
- Enclosed sunroom
- Own deck
Tags
Property features AI
Finance
- HOA & community: No homeowners association; Located in the Robbins Heights subdivision
Exterior
- Parking: Driveway
- Utilities: Public sewer; Electric water heater
- Home design: Residential stick/site-built house; One-story
- Construction: Built in 1998; Vinyl siding exterior
- Exterior features: Public water source; Public maintained road; Crawl space foundation
Interior
- Kitchen: Electric water heater (appliance listed)
- Bedrooms: Main-level bedroom
- Bathrooms: 2 full bathrooms
- Heating & cooling: Heat pump for heating and cooling; Electric heating fuel
- Interior features: Primary bedroom located on the main level
Neighborhood map
What this means for you Summary
Snapshot
- This is a 2-bed/1.0-bath single-family listed at $170k.
Deal economics
- At list price, monthly cash flow is $-98 ($-1k/yr) — negative.
- To cash-flow at today's rent, offer at most $153k (10.2% below list).
- To meet the 1% rule (rent ≥ 1% of price), the offer needs to be $114k (32.7% below list).
- Recommended offer: $114k (32.7% below list) — sets the bar for 1% rule.
- Cap rate 5.6% vs local median 3.5% in Lexington — top-decile yield for the area; either an underpriced asset or a hidden risk that comps aren't pricing in. Stress-test before assuming the spread holds.
Location & tenants
- Location reads 72/100 on livability (#89 in NC) — a middle-class / working-renter tenant base. Strengths: commute A+, cost of living A+, health & safety A+; Watch: crime F, amenities D-, employment F.
- Lexington City Schools (suburban): math 32% / reading 38% proficiency, ranked #136 of 178 in NC (top 76%) — families likely to look elsewhere, expect single-tenant / working-renter base with shorter leases; 78% free/reduced lunch — lower-income household profile, screen leases tightly.
- Zoned schools: Southwest Elementary Global Academy (math 40% / reading 37%, grade F, #750 of 1,410 statewide, top 54%, 375 students, 99% FRL); Lexington Middle School (math 31% / reading 41%, grade F, #273 of 475 statewide, top 58%, 647 students, 100% FRL); Lexington Senior High School (math 27% / reading 52%, grade F, #393 of 535 statewide, top 75%, 928 students, 99% FRL) — zoned schools average 99% FRL vs 78% district-wide (21 pts higher); higher-poverty schools than district average — tighter screening recommended.
- Market conditions: Rents rising (+1.4%/yr); 403 active listings in the ZIP; 11 comparable units currently listed for rent nearby; rentals at typical pace (median 25d on market — plan ~3-4 weeks tenant-placement turnaround); 990 units permitted in Davidson County in 2024 (54 in 5+ unit buildings).
Forward outlook
- Local home prices are declining (-3.0%/yr); year-one equity from $1k of loan paydown is wiped out by about $5k of value loss. Plan a longer hold.
- Davidson County population projected to shrink 6% by 2050 — rents likely to lag national; underwrite the cash flow, not the appreciation.
Negotiation context
- It's been on market 40 days — a 3% lower offer ($165k) is reasonable based on typical stale-listing flexibility.
- 3 sale attempts since 13y ago; this cycle's ask has dropped $10k (6%) from the opening price — seller is motivated, your offer sets the floor, not the list.
- Current owner paid $125k; 36% above their basis — modest negotiation headroom, anchor on the comps not their cost.
Risks & watch-outs
- Climate carrying-cost: extreme-heat days projected 7→17/yr by 2055 (HVAC capex compounding) — expect insurance premiums to compound above CPI over the hold.
Questions for the listing agent
- What do current leases actually rent for vs. the listed asking? Can we see a recent rent roll and the last 12 months of T-12 income?
- It's been on market 40 days. Have you received any prior offers? Is the seller open to a 33% concession, seller financing, or rate buy-down credit?
- Is there a deadline driving the sale (1031 exchange, divorce, estate, relocation)? That informs how much negotiation room exists.
- Schools are D-rated, which usually means shorter tenancies and higher turnover. Who's the typical renter profile here, and what's been the actual vacancy rate?
- Crime grade is F in this area — have there been break-ins, vandalism, or insurance claims at this property in the last 3 years? What carrier currently insures it and at what premium?
- The area grade is low — what's the realistic commute time and amenity access for the typical tenant pool here? Any planned neighborhood developments (good or bad) we should know about?
- What's the average days-on-market for RENTAL listings here right now (not sales)? A rising rental-DOM trend means longer vacancies and softer asking-rent achievability than the comps imply.
- What's the recent tenant-quality profile in this submarket — average credit score on applications, eviction rate, late-payment / NSF rate, and stable-employment percentage? A property-management company in the area should have these aggregated.
- How much new for-sale + rental construction is in the pipeline within 1–3 miles? Heavy new supply typically softens prices + rents 12–24 months out; constrained supply supports both.
Investment metrics
- 1% rule
- 0.67% ✗
- Cap rate
- 5.60%
- Cash-on-cash
- -2.47%
- DSCR
- 0.89
- GRM
- 12.4
CMA / ARV
- ARV (on-the-fly)
- $160,650
- Comps found
- 12
Show comp detail 12 sales within ~0.75 mi
| Address | Dist | Beds/Ba | Sqft | Sold | Price | $/sf | Match |
|---|---|---|---|---|---|---|---|
| 103 Harrington Ave | 0.47mi | 2/1.0 | 920 (+0%) | 10mo | $155,000 | $168 | 69 |
| 617 Hargrave St | 0.36mi | 2/1.0 | 832 (-9%) | 2mo | $140,000 | $168 | 66 |
| 603 Oak Ave | 0.66mi | 2/1.0 | 970 (+6%) | 7mo | $102,200 | $105 | 53 |
| 404 Carolina Ave | 0.57mi | 2/2.0 | 889 (-3%) | 14mo | $200,000 | $225 | 52 |
| 706 Ford St | 0.32mi | 3/1.0 (+1) | 1,026 (+12%) | 12mo | $110,000 | $107 | 51 |
| 401 Woodsway Dr | 0.75mi | 2/1.0 | 947 (+3%) | 12mo | $175,000 | $185 | 50 |
| 408 Beckner St | 0.65mi | 2/1.0 | 1,050 (+14%) | 3mo | $184,000 | $175 | 43 |
| 212 Mendota Ave | 0.75mi | 2/1.0 | 1,037 (+13%) | 2mo | $75,000 | $72 | 42 |
| 198 Raeford Ave | 0.67mi | 3/1.0 (+1) | 1,018 (+11%) | 4mo | $165,900 | $163 | 42 |
| 415 Dixie St | 0.62mi | 2/1.0 | 814 (-11%) | 14mo | $155,000 | $190 | 40 |
| 5 Crutchfield Ave | 0.75mi | 2/1.0 | 780 (-15%) | 8mo | $175,000 | $224 | 33 |
| 303 E 5th Avenue Ext | 0.64mi | 3/2.0 (+1) | 819 (-11%) | 12mo | $165,000 | $201 | 33 |
Match score weights: distance 35% · size 25% · config 20% · recency 20%. Top-matched comps best support the ARV.
Projected returns pro-forma
-3.0% appreciation · 1.37% rent growth · sell at horizon
- IRR
- -22.0%
- Equity multiple
- 0.25×
- Total profit
- $-35,695
- Equity at exit
- $25,333
- IRR
- -19.8%
- Equity multiple
- 0.02×
- Total profit
- $-46,794
- Equity at exit
- $14,690
Cash invested: $47,572 (down + closing). Projections, not guarantees.
Landlord ↔ Tenant lean methodology
- Overall (STATE)
- 85 Strongly Landlord-Friendly
- State North Carolina
- 85 Strongly Landlord-Friendly · R+3
- County
- — inherits STATE
- City
- — inherits STATE
ZIP-level market 27292
- Home prices YoY
- -22.1%
- Rents YoY
- 1.4%
- Active inventory
- 403
- Price-to-rent
- 12.4×
Monthly cashflow live
- Estimated rent
- $1,143 high interval (Pro) →
- Mortgage (P&I)
- −$891
- Tax from tax record
- −$39 /mo · $469/yr
- Insurance
- −$71
- HOA
- −$0
- Vacancy / Maint / Mgmt
- −$240
- Net cashflow
- $-98
Break-even live
Sensitivity live
| Price | -10% $-2 | -5% $-50 | +0% $-98 | +5% $-146 | +10% $-194 |
|---|---|---|---|---|---|
| Rent | -10% $-188 | -5% $-143 | +0% $-98 | +5% $-53 | +10% $-8 |
| Rate | -1.0pp $-12 | -0.5pp $-55 | base $-98 | +0.5pp $-142 | +1.0pp $-187 |
UW: 25.0% down · 7.5% · 30yr · 1.5% tax · 5.0% vac · 8.0% maint · 8.0% mgmt
Financing live
Cash to close
- Down payment
- $42,475
- Closing costs
- $5,097
- Reserves months
- —
- Total cash needed
- —
Loan-product check · same deal, 3 products live
Conventional
25% down · 7.5% · 30yr
- Down + closing
- —
- Monthly P&I
- —
- Monthly cashflow
- —
- DSCR
- —
- Eligible?
- —
Personal DTI + credit; lowest rate.
DSCR
20% down · 8.5% · 30yr
- Down + closing
- —
- Monthly P&I
- —
- Monthly cashflow
- —
- DSCR
- —
- Eligible?
- —
No personal income docs; deal must DSCR.
Hard money
10% down · 12.0% · 12mo
- Down + closing
- —
- Monthly P&I
- —
- Monthly cashflow
- —
- DSCR
- —
- Eligible?
- —
Short-term bridge; refi at stabilization.
Rent comps 11 comps
| Address | Beds | Baths | Sqft | Rent | $/sqft | DOM | Units | Dist |
|---|---|---|---|---|---|---|---|---|
| 9 Robbins Cir Lexington, NC | 2.0 | 1.0 | 800 | $1,150 | $1.44 | 16d | 1 | 0.03mi |
| 519 Leonford St Lexington, NC | 2.0 | 1.0 | 867 | $1,000 | $1.15 | 25d | 1 | 0.72mi |
| 301 Williamson St Unit B Lexington, NC | 2.0 | 1.0 | 896 | $1,000 | $1.12 | 25d | 1 | 0.76mi |
| 812 Fairview Dr Apt 450A Lexington, NC | 2.0 | 1.5 | 976 | $1,450 | $1.49 | 25d | 1 | 0.92mi |
| 812 Fairview Dr Apt 200D Lexington, NC | 2.0 | 1.5 | 976 | $1,249 | $1.28 | 23d | 1 | 0.92mi |
| 208 Bookington Dr Unit 214-C Lexington, NC | 2.0 | 1.0 | 800 | $825 | $1.03 | 25d | 1 | 1.21mi |
| 420 Salem St Unit H Lexington, NC | 2.0 | 1.5 | 1100 | $875 | $0.80 | 21d | 1 | 1.23mi |
| 27 Hege Dr Lexington, NC | 1.0 | 1.0 | 540 | $950 | $1.76 | 16d | 1 | 1.30mi |
| 706 Zane Perkins Dr Lexington, NC | 2.0 | 1.5 | 700 | $1,200 | $1.71 | 21d | 1 | 1.36mi |
| 110 Ridge Mill Cir Unit 517 Lexington, NC | 2.0 | 2.0 | 864 | $1,225 | $1.42 | 25d | 1 | 1.39mi |
| 137 Crest Cir Unit B Lexington, NC | 2.0 | 1.0 | 855 | $1,150 | $1.35 | 25d | 1 | 1.47mi |
Listing history 14 events
-
2026-04-29status Pending
-
2026-04-26price $169,900
-
2026-03-19$179,900 Active
-
2026-02-26soldstatus $125,000
-
2016-10-07soldstatus $57,500 Sold 83-char remark
Show marketing remark (83 chars)
Cozy Cottage! 2 Bedroom, 1 bath, in city Nicely Landscaped, Move in ready. Like New
-
2016-10-07soldstatus $57,500
Show marketing remark (83 chars)
Cozy Cottage! 2 Bedroom, 1 bath, in city Nicely Landscaped, Move in ready. Like New
-
2016-08-24status Due Diligence Period 83-char remark
Show marketing remark (83 chars)
Cozy Cottage! 2 Bedroom, 1 bath, in city Nicely Landscaped, Move in ready. Like New
-
2016-08-08$59,900 Active 83-char remark
Show marketing remark (83 chars)
Cozy Cottage! 2 Bedroom, 1 bath, in city Nicely Landscaped, Move in ready. Like New
-
2013-09-17soldstatus $20,000 263-char remark
Show marketing remark (263 chars)
Great Opportunity to Purchase Your Home in City of Lexington. Great Location, Close to Everything. Covered Front Porch. For Special Financing and incentives, seller requests potential buyers contact Chase Mortgage Banker. Call the Listing Agent for details.
-
2013-08-09$17,820 263-char remark
Show marketing remark (263 chars)
Great Opportunity to Purchase Your Home in City of Lexington. Great Location, Close to Everything. Covered Front Porch. For Special Financing and incentives, seller requests potential buyers contact Chase Mortgage Banker. Call the Listing Agent for details.
-
2000-09-01soldstatus $10,000
-
2000-09-01soldstatus $81,000
-
2000-09-01soldstatus $21,000
-
2000-09-01soldstatus $81,000
ⓘ Source: listings_history table (triggers on properties + properties_extension) + one-shot
backfill from property_details.listing_events for pre-trigger history.
Tax reassessment forecast NC · Resets to sale price
- Current annual tax
- $469 · $39/mo
- Projected year-2 tax
- $1,393 · $116/mo
- Expected delta
- +$924/yr (+$77/mo · 197.0%)
ⓘ Screening estimate from a state-policy table — verify with the county assessor before closing.
Climate risk First Street
- Flood 1/10 Low FEMA zone X (unshaded) · 0% chance over 30 yrs
- Wildfire 1/10 Low
- Heat 6/10 Major 7 d/yr ≥104°F today · 17 d/yr by 30 yrs out
- Wind 4/10 Moderate 13% chance of damaging wind over 30 yrs
- Air quality 2/10 Low 1 unhealthy d/yr today · 2 by 30 yrs out
Nearby sold comps map
Loading sold comps map…
Walkable amenities ~0.75 mi
Loading nearby amenities…
Taxation est. · year 1
- Rental income
- $13,717
- − Mortgage interest
- −$9,517
- − Property taxes
- −$469
- − Insurance
- −$850
- − Repairs & maintenance
- −$1,097
- − Management
- −$1,097
- − Depreciation
- −$4,943
- Taxable loss
- −$4,256
- Est. tax savings @ 24.0%
- +$1,021
- After-tax cash flow
- $-152/yr
For passive investors: Depreciation is non-cash, so a rental often shows a tax loss while cash-flowing — sheltering income. Rental losses are passive: they offset passive income freely, and up to $25,000/yr can offset ordinary (W-2) income if you actively participate and your MAGI is under $100k (phasing out to $0 by $150k); unused losses carry forward. On sale, claimed depreciation is recaptured at up to 25%, and gains may owe capital-gains tax (a 1031 exchange can defer both). Figures are a year-1 estimate at your 24.0% rate — not tax advice; consult a CPA.
Schools (NCES district)
- District
- Lexington City Schools
- NCES district ID
- 3702640
- Math proficiency
- 32% ▲ 3.00%
- Reading proficiency
- 38% ▲ 6.00%
- Median HH income
- $27,758
- Composite
- 28.2/100
- National rank
- #6807
- State rank
- #136 of 178 in NC
Livability — Lexington
- Score
- 72/100
- State rank
- #89
- US rank
- #6051
Category grades
Schools grade is shown separately in the Schools card above.
Census & demographics
- Census place
- Lexington, NC
- County
- Davidson County · 129,088 people
- City population
- 79,578
- Metro
- Winston-Salem, NC
- Population (ZIP)
- 40,311
- Household income
- $57,264
- Rent vs Own
- Severe rent burden
- 1001.0
Population outlook (Davidson County) Hauer SSP2
- Today (2025)
- 167,156 people
- By 2030
- 167,216 · +0.0%
- By 2040
- 164,524 · -1.6%
- By 2050
- 157,229 · -5.9%
- By 2075
- 138,084 · -17.4%
- By 2100
- 112,729 · -32.6%
Race, ethnicity, and origin ACS 2023
- Neighborhood character
- Predominantly White (72%)
- Race & ethnicity
- White 72% Black 13% Two or more races 9% Hispanic / Latino 9% Asian 2%
- Hispanic origin (detail)
- Mexican 7%
- Common ancestry
- Romanian 1% Slovak 1% Serbian 1%
- Foreign-born
- 5% · Canada, Vietnam
- Languages at home
- 91% English-only · Spanish 8%
Political lean MEDSL · Davidson
- 2024 margin
- Solid R (+47.1) · D 25.9% · R 73.0% · Other 1.1%
- 2008→2024 swing
- -13.5pp toward R · 2008: -33.5pp · 2024: -47.1pp
- All cycles
- 2024: R+47.1 2020: R+47.5 2016: R+49.4 2012: R+40.9 2008: R+33.5
Not yet ingested
- Civics
- —
Market trends
- HPI YoY
- ▼ -75.79%
- Current HPI
- 267.074
- Rent YoY
- ▲ 1.37%
- Metro
- Winston-Salem, NC
- State GDP YoY
- ▲ 3.28%
- F500 in state
- 26
Industry mix (Fortune 500 HQ in NC)
| Industry | F500 HQs | Revenue |
|---|---|---|
| Financial Services | 2 | $213B |
|
||
| Retail | 2 | $95B |
|
||
| Industrial Conglomerate | 1 | $38B |
|
||
| Metals / Steel | 1 | $35B |
|
||
| Utilities | 1 | $30B |
|
||
| Industrial Machinery | 1 | $19B |
|
||
Price history
+1599.0% since first listed14 events — show timeline
- 2026-04-29 Pending — Triad MLS
- 2026-04-26 Price Changed $169,900 Triad MLS
- 2026-03-19 Listed $179,900 Triad MLS
- 2026-02-26 Sold (Public Records) $125,000 Public Records
- 2016-10-07 Sold (Public Records) $57,500 Public Records
- 2016-10-07 Sold (MLS) $57,500 Triad MLS
- 2016-08-24 Pending — Triad MLS
- 2016-08-08 Listed $59,900 Triad MLS
- 2013-09-17 Sold (MLS) $20,000 Triad MLS
- 2013-08-09 Listed $17,820 Triad MLS
- 2000-09-01 Sold (Public Records) $81,000 Public Records
- 2000-09-01 Sold (Public Records) $21,000 Public Records
- 2000-09-01 Sold (Public Records) $81,000 Public Records
- 2000-09-01 Sold (Public Records) $10,000 Public Records
Property tax history
-4.3%/yrLatest (2025): $469 · +0.0% YoY. Source: county tax records.
Cash-flow waterfall
monthlySold comps — $/sqft
last 12 mo · ≤1 miLoading sold comps…