 🏷️ Likely Rental
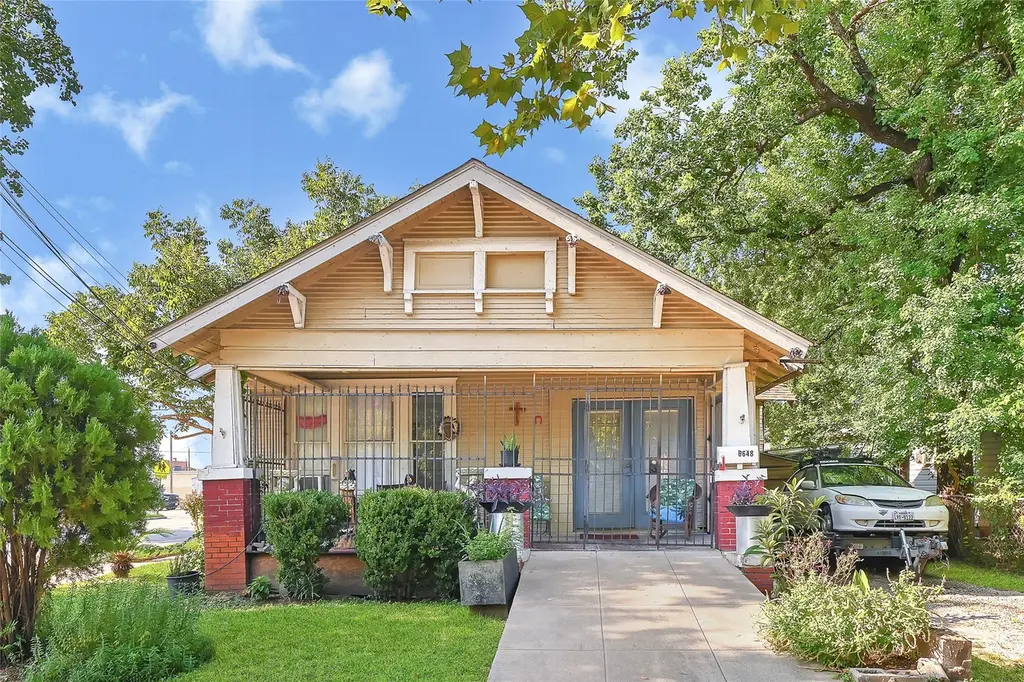
6648 Avenue C · Houston, TX
Flood risk No data
- FEMA flood zone
- —
- Chance of flooding over 30 yrs
- —
- Est. flood insurance / yr
- —
Fire risk No data
- Est. fire insurance / yr
- —
Heat risk No data
- Hot days now (above threshold)
- —
- Hot days in 30 yrs
- —
Wind risk No data
- Chance of severe wind over 30 yrs
- —
Air-quality risk No data
- Unhealthy air days now
- —
- Unhealthy air days in 30 yrs
- —
Risk factors via First Street. Map © Google.
Why this score? — see what drove the B+ grade
The composite is a weighted blend of 9 inputs, each scored 0–100. Each bar is that input's sub-score; the figure is the points it added to the 100-point composite (weight × sub-score).
- Cash flow +25.9/30.0
- ARV discount +15.0/15.0
- Appreciation +10.0/10.0
- DSCR +8.7/10.0
- 1% rule +6.9/10.0
- Livability +3.7/5.0
- Schools +2.7/10.0
- Condition / age +2.2/5.0
- Rent growth +1.8/5.0
$350,000
🖨 Deal sheet 📄 Offer letter ✓ Due diligence
Multi-family units
County records classify this as Multi-Family (2-4 Unit). Listing-text estimate: 1 unit. estimate disagrees with records
Listing remarks MLS
Discover an outstanding mixed-use investment opportunity in Houston’s thriving East End. This property offers unmatched visibility and accessibility with a total of 230 ft of frontage on three different streets, including a traffic count of 2,588 vehicles daily along 67th Street (Cesar Chavez Blvd.) (Tx-Dot, 2021). Located in Opportunity Zone #48201310900, it presents significant tax advantages for investors while sitting in a neighborhood experiencing rapid growth and redevelopment. The site features three residential units alongside a small retail shop, making it ideal for a mixed-use developer or investor seeking both immediate rental income and long-term value. The flexible layout supports a variety of uses, from live/work configurations to multi-tenant leasing, or even future redevelopment into a larger residential or commercial project.
Key facts
- Flexible layout
- Small retail shop
- Variety of uses
Tags
Neighborhood map
What this means for you Summary
Snapshot
- This is a 3-bed/1.0-bath multifamily listed at $350k. Condition is rated fair.
Deal economics
- At list price, monthly cash flow is $858 ($10k/yr) — positive.
- The deal already cash-flows at list — no discount required.
- Meets the 1% rule at list price ($4k rent vs $350k).
- Recommended offer: $308k (12.0% below list) — sets the bar for market timing.
- Cap rate 9.2% vs local median 3.2% in Houston — top-decile yield for the area; either an underpriced asset or a hidden risk that comps aren't pricing in. Stress-test before assuming the spread holds.
Location & tenants
- Location reads 74/100 on livability (#184 in TX, #4,771 nationally) — a middle-class / working-renter tenant base. Strengths: amenities A+, cost of living A+, housing A+; Watch: schools D, crime F.
- Houston ISD (urban): math 27% / reading 35% proficiency, ranked #593 of 826 in TX (top 72%) — families likely to look elsewhere, expect single-tenant / working-renter base with shorter leases; 71% free/reduced lunch — lower-income household profile, screen leases tightly.
- Market conditions: Rents soft (-2.9%/yr); 161 active listings in the ZIP; 1 comparable units currently listed for rent nearby; 29,883 units permitted in Harris County in 2024 (8,621 in 5+ unit buildings).
- At $4,148/mo this rent would consume 99% of the median local household income ($50k/yr) (locally 655% of renters already pay >50% of income on rent) — very limited rent-growth headroom before tenants either downsize or default.
Forward outlook
- In year one you build about $37k of equity ($2k loan paydown + $35k appreciation (10.0% local appreciation)).
- Harris County population projected at +47% by 2050 — long-run rental-demand tailwind backs the buy-and-hold thesis.
- At projected returns (10.0% appreciation + 0.0% rent growth), your $98k cash investment doubles in ~2 years — after that, you're playing with house money.
- By year 2, paydown + projected appreciation supports a ~$60k cash-out refi (75% LTV) — recoverable capital for the next deal without selling this one.
Negotiation context
- It's been on market 284 days — a 12% lower offer ($308k) is reasonable based on typical stale-listing flexibility.
- 6 sale attempts since 4y ago; this cycle's ask has dropped $80k (19%) from the opening price — seller is motivated, your offer sets the floor, not the list.
Risks & watch-outs
- Watch-outs: built in 1949 — expect roof / HVAC / electrical / plumbing capex.
Questions for the listing agent
- It's been on market 284 days. Have you received any prior offers? Is the seller open to a 12% concession, seller financing, or rate buy-down credit?
- Have any recent inspections been done? Can we get a copy of the seller's disclosures and any deferred-maintenance estimates?
- Built in 1949 — when were the roof, HVAC, electrical panel, plumbing, and water heater last replaced?
- Why hasn't it sold? Are there any deal-killer items the seller is aware of (foundation, flood, title, zoning, code violations)?
- Is there a deadline driving the sale (1031 exchange, divorce, estate, relocation)? That informs how much negotiation room exists.
- Schools are D-rated, which usually means shorter tenancies and higher turnover. Who's the typical renter profile here, and what's been the actual vacancy rate?
- Crime grade is F in this area — have there been break-ins, vandalism, or insurance claims at this property in the last 3 years? What carrier currently insures it and at what premium?
- What's the average days-on-market for RENTAL listings here right now (not sales)? A rising rental-DOM trend means longer vacancies and softer asking-rent achievability than the comps imply.
- What's the recent tenant-quality profile in this submarket — average credit score on applications, eviction rate, late-payment / NSF rate, and stable-employment percentage? A property-management company in the area should have these aggregated.
- How much new apartment / multifamily construction is in the pipeline within 1–3 miles? Heavy new supply (>2% of stock underway) typically softens rents 12–24 months out; light construction supports rent growth.
Investment metrics
- 1% rule
- 1.19% ✓
- Cap rate
- 9.24%
- Cash-on-cash
- 10.51%
- DSCR
- 1.47
- GRM
- 7.0
CMA / ARV
- ARV (median comp)
- $456,535
- List price
- $350,000
- Delta
- -23.34%
- Verdict
- UNDERPRICED
- Comps
- 19 within 1.0 mi
Show comp detail 2 sales within ~0.75 mi
| Address | Dist | Beds/Ba | Sqft | Sold | Price | $/sf | Match |
|---|---|---|---|---|---|---|---|
| 6607 Avenue O | 0.64mi | 3/2.0 | 3,000 (-10%) | 8mo | $450,000 | $150 | 43 |
| 7044 Avenue E | 0.52mi | 2/1.0 (-1) | 2,900 (-13%) | 9mo | $415,000 | $143 | 41 |
Match score weights: distance 35% · size 25% · config 20% · recency 20%. Top-matched comps best support the ARV.
Projected returns pro-forma
10.0% appreciation · 0.0% rent growth · sell at horizon
- IRR
- 30.7%
- Equity multiple
- 3.38×
- Total profit
- $233,182
- Equity at exit
- $315,308
- IRR
- 25.7%
- Equity multiple
- 7.35×
- Total profit
- $622,059
- Equity at exit
- $679,973
Cash invested: $98,000 (down + closing). Projections, not guarantees.
Landlord ↔ Tenant lean methodology
- Overall (STATE)
- 87 Strongly Landlord-Friendly
- State Texas
- 87 Strongly Landlord-Friendly · R+5
- County
- — inherits STATE
- City
- — inherits STATE
ZIP-level market 77011
- Home prices YoY
- 30.1%
- Rents YoY
- -2.9%
- Active inventory
- 161
- Price-to-rent
- 21.1×
Monthly cashflow live
- Estimated rent
- $4,148 high interval (Pro) →
- Mortgage (P&I)
- −$1,835
- Tax est. 1.5%
- −$438 /mo · $5,250/yr
- Insurance
- −$146
- HOA
- −$0
- Vacancy / Maint / Mgmt
- −$871
- Net cashflow
- $858
Break-even live
3-unit breakdown (identical units grouped — click to expand)
| Units | Beds | Baths | Est. rent |
|---|---|---|---|
| 3× units | 2 | 1 | $4,149 |
| #1 | 2 | 1 | $1,383 |
| #2 | 2 | 1 | $1,383 |
| #3 | 2 | 1 | $1,383 |
| Total (3 units) | $4,148 | ||
UW: 25.0% down · 7.5% · 30yr · 1.5% tax · 5.0% vac · 8.0% maint · 8.0% mgmt
Financing live
Cash to close
- Down payment
- $87,500
- Closing costs
- $10,500
- Reserves months
- —
- Total cash needed
- —
Loan-product check · same deal, 3 products live
Conventional
25% down · 7.5% · 30yr
- Down + closing
- —
- Monthly P&I
- —
- Monthly cashflow
- —
- DSCR
- —
- Eligible?
- —
Personal DTI + credit; lowest rate.
DSCR
20% down · 8.5% · 30yr
- Down + closing
- —
- Monthly P&I
- —
- Monthly cashflow
- —
- DSCR
- —
- Eligible?
- —
No personal income docs; deal must DSCR.
Hard money
10% down · 12.0% · 12mo
- Down + closing
- —
- Monthly P&I
- —
- Monthly cashflow
- —
- DSCR
- —
- Eligible?
- —
Short-term bridge; refi at stabilization.
Rent comps 1 comps
| Address | Beds | Baths | Sqft | Rent | $/sqft | DOM | Units | Dist |
|---|---|---|---|---|---|---|---|---|
| 207 Edgewood St Houston, TX | 3.0 | 4.0 | 2577 | $3,250 | $1.26 | 43d | 1 | 0.92mi |
Listing history 32 events
-
2026-06-18price $350,000 Active 284 DOM
-
2026-06-18days on market $390,000 Active 284 DOM
-
2026-06-17days on market $390,000 Active 283 DOM
-
2026-06-16days on market $390,000 Active 282 DOM
-
2026-06-15days on market $390,000 Active 281 DOM
-
2026-06-13days on market $390,000 Active 279 DOM
-
2026-06-10days on market $390,000 Active 275 DOM
-
2026-06-08days on market $390,000 Active 274 DOM
-
2026-06-07days on market $390,000 Active 273 DOM
-
2026-06-04days on market $390,000 Active 270 DOM
-
2026-06-01days on market $390,000 Active 267 DOM
-
2026-05-31days on market $390,000 Active 266 DOM
-
2026-04-14price $390,000 864-char remark
Show marketing remark (864 chars)
Discover an outstanding mixed-use investment opportunity in Houston’s thriving East End. This property offers unmatched visibility and accessibility with a total of 230 ft of frontage on three different streets, including a traffic count of 2,588 vehicles daily along 67th Street (Cesar Chavez Blvd.) (Tx-Dot, 2021). Located in Opportunity Zone #48201310900, it presents significant tax advantages for investors while sitting in a neighborhood experiencing rapid growth and redevelopment. The site features three residential units alongside a small retail shop, making it ideal for a mixed-use developer or investor seeking both immediate rental income and long-term value. The flexible layout supports a variety of uses, from live/work configurations to multi-tenant leasing, or even future redevelopment into a larger residential or commercial project.
-
2025-09-07$430,000 Active 864-char remark
Show marketing remark (864 chars)
Discover an outstanding mixed-use investment opportunity in Houston’s thriving East End. This property offers unmatched visibility and accessibility with a total of 230 ft of frontage on three different streets, including a traffic count of 2,588 vehicles daily along 67th Street (Cesar Chavez Blvd.) (Tx-Dot, 2021). Located in Opportunity Zone #48201310900, it presents significant tax advantages for investors while sitting in a neighborhood experiencing rapid growth and redevelopment. The site features three residential units alongside a small retail shop, making it ideal for a mixed-use developer or investor seeking both immediate rental income and long-term value. The flexible layout supports a variety of uses, from live/work configurations to multi-tenant leasing, or even future redevelopment into a larger residential or commercial project.
-
2025-02-03historical
-
2024-11-03price $470,000
-
2024-09-16price $499,000
-
2024-08-28price $520,000
-
2024-08-04status Active
-
2024-08-04price $520,000
-
2024-08-04historical
-
2024-08-04price $540,000
-
2024-07-28$560,000 Active
-
2024-07-06historical
-
2022-08-11historical
-
2022-06-17$580,000 Active
-
2022-06-16historical
-
2022-06-04price $649,000
-
2022-06-04status Active
-
2022-06-01status Pending
-
2022-05-23status Option Pending
-
2022-05-05$700,000 Active
ⓘ Source: listings_history table (triggers on properties + properties_extension) + one-shot
backfill from property_details.listing_events for pre-trigger history.
Nearby sold comps map
Loading sold comps map…
Walkable amenities ~0.75 mi
Loading nearby amenities…
Taxation est. · year 1
- Rental income
- $49,776
- − Mortgage interest
- −$19,605
- − Property taxes
- −$5,250
- − Insurance
- −$1,750
- − Repairs & maintenance
- −$3,982
- − Management
- −$3,982
- − Depreciation
- −$10,182
- Taxable income
- $5,025
- Est. tax owed @ 24.0%
- −$1,206
- After-tax cash flow
- $9,092/yr
For passive investors: Depreciation is non-cash, so a rental often shows a tax loss while cash-flowing — sheltering income. Rental losses are passive: they offset passive income freely, and up to $25,000/yr can offset ordinary (W-2) income if you actively participate and your MAGI is under $100k (phasing out to $0 by $150k); unused losses carry forward. On sale, claimed depreciation is recaptured at up to 25%, and gains may owe capital-gains tax (a 1031 exchange can defer both). Figures are a year-1 estimate at your 24.0% rate — not tax advice; consult a CPA.
Condition & rehab AI · 6 photos
This multi-family property in Houston's East End requires moderate repairs and updates to its exterior and interior to improve its condition and value. The home's location and mixed-use potential make it a promising investment opportunity.
Repairs flagged
- Moderate Exterior siding — Weathered and stained, indicating wear and tear.
- Moderate Interior walls — Signs of wear and may need repainting.
- Moderate Kitchen cabinets — Dated and may need updating.
- Moderate Bathroom fixtures — Dated and may need updating.
- Moderate Hardwood flooring — Worn and may need refinishing.
- Moderate Landscaping — Overgrown and may need trimming and maintenance.
Value-add opportunities
- Resale Paint interior walls — Fresh paint can make a significant difference in the home's appearance and appeal.
- Resale Update kitchen cabinets and appliances — Modernizing the kitchen can attract more buyers and increase the home's value.
- Resale Update bathroom fixtures and tiling — Fresh and updated bathrooms can significantly enhance the home's appeal and value.
- Resale Refinish hardwood flooring — Refinished hardwood flooring can add value and appeal to potential buyers.
- Both Trim and maintain landscaping — A well-maintained and attractive exterior can improve curb appeal and attract more potential buyers or renters.
Renovation cost estimate screening
| Repair item | Severity | Est. cost |
|---|---|---|
| Exterior siding · Weathered and stained, indicating wear and tear. | Moderate | $3,000–15,000 |
| Interior walls · Signs of wear and may need repainting. | Moderate | $3,000–15,000 |
| Kitchen cabinets · Dated and may need updating. | Moderate | $3,000–15,000 |
| Bathroom fixtures · Dated and may need updating. | Moderate | $3,000–15,000 |
| Hardwood flooring · Worn and may need refinishing. | Moderate | $3,000–15,000 |
| Landscaping · Overgrown and may need trimming and maintenance. | Moderate | $3,000–15,000 |
| Total estimated repair cost · 6 items | $18,000–90,000 |
Value-add ROI direction
- Resale Paint interior walls — Fresh paint can make a significant difference in the home's appearance and appeal. ↑
- Resale Update kitchen cabinets and appliances — Modernizing the kitchen can attract more buyers and increase the home's value. ↑
- Resale Update bathroom fixtures and tiling — Fresh and updated bathrooms can significantly enhance the home's appeal and value. ↑
- Resale Refinish hardwood flooring — Refinished hardwood flooring can add value and appeal to potential buyers. ↑
- Both Trim and maintain landscaping — A well-maintained and attractive exterior can improve curb appeal and attract more potential buyers or renters. ↑
ⓘ Cost ranges are severity-bucket heuristics (US national rule-of-thumb). Get contractor quotes + a written scope before underwriting a rehab budget.
Schools (NCES district)
- District
- Houston ISD
- NCES district ID
- 4823640
- Math proficiency
- 27% ▼ -18.00%
- Reading proficiency
- 35% ▼ -6.00%
- Median HH income
- $46,054
- Composite
- 26.63/100
- National rank
- #7173
- State rank
- #593 of 826 in TX
Livability — Houston
- Score
- 74/100
- State rank
- #184
- US rank
- #4771
Category grades
Schools grade is shown separately in the Schools card above.
Census & demographics
- Census place
- Houston, TX
- County
- Harris County · 4,702,590 people
- City population
- 3,226,434
- Metro
- Houston-The Woodlands-Sugar Land, TX
- Population (ZIP)
- 14,940
- Household income
- $50,133
- Rent vs Own
- Severe rent burden
- 655.0
Population outlook (Harris County) Hauer SSP2
- Today (2025)
- 5,571,493 people
- By 2030
- 6,089,821 · +9.3%
- By 2040
- 7,142,806 · +28.2%
- By 2050
- 8,185,864 · +46.9%
- By 2075
- 10,574,329 · +89.8%
- By 2100
- 12,109,958 · +117.4%
Race, ethnicity, and origin ACS 2023
- Neighborhood character
- Predominantly Hispanic (88%)
- Race & ethnicity
- Hispanic / Latino 88% Two or more races 29% White 7% Black 3%
- Hispanic origin (detail)
- Mexican 81%
- Foreign-born
- 33% · Canada
- Languages at home
- 24% English-only · Spanish 76%
Political lean MEDSL · Harris
- 2024 margin
- Lean D (+5.5) · D 52.0% · R 46.4% · Other 1.6%
- 2008→2024 swing
- +3.9pp toward D · 2008: 1.6pp · 2024: 5.5pp
- All cycles
- 2024: D+5.5 2020: D+13.3 2016: D+12.4 2012: D+0.1 2008: D+1.6
Not yet ingested
- Civics
- —
Market trends
- HPI YoY
- ▲ 68.18%
- Current HPI
- 295.1198
- Rent YoY
- ▼ -2.93%
- Metro
- Houston-The Woodlands-Sugar Land, TX
- State GDP YoY
- ▲ 3.95%
- F500 in state
- 110
Industry mix (Fortune 500 HQ in TX)
| Industry | F500 HQs | Revenue |
|---|---|---|
| Energy | 16 | $1,198B |
|
||
| Technology | 5 | $198B |
|
||
| Engineering / Construction | 4 | $72B |
|
||
| Energy Services | 3 | $60B |
|
||
| Utilities | 3 | $41B |
|
||
| Healthcare | 2 | $330B |
|
||
Price history
-44.3% since first listed20 events — show timeline
- 2026-04-14 Price Changed $390,000 HARMLS
- 2025-09-07 Listed $430,000 HARMLS
- 2025-02-03 Listing Removed — HARMLS
- 2024-11-03 Price Changed $470,000 HARMLS
- 2024-09-16 Price Changed $499,000 HARMLS
- 2024-08-28 Price Changed $520,000 HARMLS
- 2024-08-04 Relisted — HARMLS
- 2024-08-04 Price Changed $520,000 HARMLS
- 2024-08-04 Price Changed $540,000 HARMLS
- 2024-08-04 Listing Removed — HARMLS
- 2024-07-28 Listed $560,000 HARMLS
- 2024-07-06 Coming Soon — HARMLS
- 2022-08-11 Listing Removed — HARMLS
- 2022-06-17 Listed $580,000 HARMLS
- 2022-06-16 Listing Removed — HARMLS
- 2022-06-04 Price Changed $649,000 HARMLS
- 2022-06-04 Relisted — HARMLS
- 2022-06-01 Pending — HARMLS
- 2022-05-23 Pending — HARMLS
- 2022-05-05 Listed $700,000 HARMLS
Cash-flow waterfall
monthlySold comps — $/sqft
last 12 mo · ≤1 miLoading sold comps…