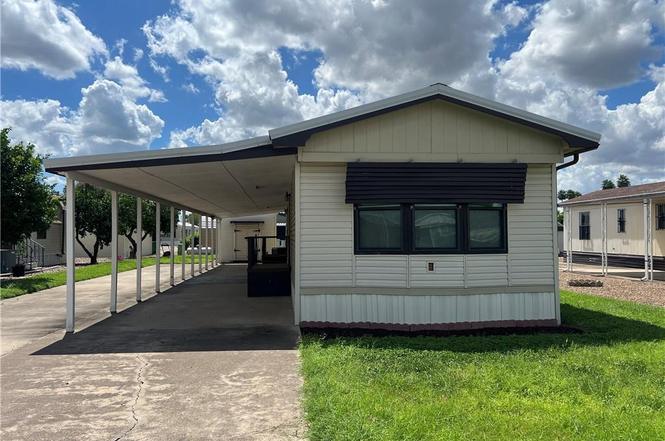
127 Yawn · Perezville, TX
Flood risk 6/10 · Moderate
- FEMA flood zone
- X
- Chance of flooding over 30 yrs
- 0.7%
- Est. flood insurance / yr
- $507 – $1,088
Fire risk 8/10 · Major
- Est. fire insurance / yr
- $1,222 – $2,270
Heat risk 9/10 · Severe
- Hot days now (above 112°F)
- 7 days/yr
- Hot days in 30 yrs
- 21 days/yr
Wind risk 8/10 · Major
- Chance of severe wind over 30 yrs
- 94.0%
Air-quality risk 1/10 · Minimal
- Unhealthy air days now
- 0 days/yr
- Unhealthy air days in 30 yrs
- 0 days/yr
Risk factors via First Street. Map © Google.
Why this score? — see what drove the B+ grade
The composite is a weighted blend of 9 inputs, each scored 0–100. Each bar is that input's sub-score; the figure is the points it added to the 100-point composite (weight × sub-score).
- Cash flow +30.0/30.0
- ARV discount +15.0/15.0
- 1% rule +10.0/10.0
- DSCR +10.0/10.0
- Livability +3.2/5.0
- Rent growth +2.7/5.0
- Condition / age +2.5/5.0
- Schools +1.9/10.0
- Appreciation +0.0/10.0
$60,000
🖨 Deal sheet 📄 Offer letter ✓ Due diligence
Listing remarks
Enjoy comfortable living in the 55+ community of Dream Valley Ranch. This 2 bedroom, 2 bath mobile home offers an open-concept living, dining, and kitchen area that creates a welcoming and functional layout. The property includes the land and is located within a well-established community featuring a recreation center with a variety of activities, as well as opportunities to enjoy walking or biking throughout the neighborhood. Conveniently situated near the Expressway and nearby shopping areas, this home offers both ease of access and an active lifestyle.
Key facts
- Walking or biking
- Open-concept living
- Recreation center
Tags
Neighborhood map
What this means for you Summary
Snapshot
- This is a 3-bed/2.0-bath manufactured listed at $60k.
Deal economics
- At list price, monthly cash flow is $595 ($7k/yr) — positive.
- The deal already cash-flows at list — no discount required.
- Meets the 1% rule at list price ($1k rent vs $60k).
- Recommended offer: $58k (3.0% below list) — sets the bar for market timing.
- Cap rate 18.2% vs local median 6.9% in Perezville — top-decile yield for the area; either an underpriced asset or a hidden risk that comps aren't pricing in. Stress-test before assuming the spread holds.
Location & tenants
- Location reads 64/100 on livability (#743 in TX) — a middle-class / working-renter tenant base. Strengths: cost of living A+, housing A+, crime A-; Watch: amenities F, commute F, health & safety F.
- La Joya ISD (suburban): math 18% / reading 29% proficiency, ranked #759 of 826 in TX (top 92%) — low school quality limits family demand, transient renter base, plan for 1-2y turnover.
- Zoned schools: Henry B Gonzalez El (math 17% / reading 27%, grade F, #3,333 of 4,322 statewide, top 80%, 490 students, 91% FRL); Ann Richards Middle (math 21% / reading 30%, grade F, #1,236 of 1,662 statewide, top 76%, 729 students, 96% FRL); La Joya H S (math 16% / reading 32%, grade F, #1,333 of 1,632 statewide, top 82%, 2,775 students, 92% FRL) — zoned schools average 93% FRL vs 54% district-wide (40 pts higher); higher-poverty schools than district average — tighter screening recommended.
- Market conditions: Rents flat; 852 active listings in the ZIP; 9 comparable units currently listed for rent nearby; rentals lingering (median 44d on market — plan ~5-8 weeks vacancy on turnover, expect pricing pressure); 67% of comp listings sitting > 30 days — soft ceiling on asking rent; 7,378 units permitted in Hidalgo County in 2024 (641 in 5+ unit buildings).
Forward outlook
- Local home prices are declining (-3.0%/yr); year-one equity from $415 of loan paydown is wiped out by about $2k of value loss. Plan a longer hold.
- Hidalgo County population projected at +28% by 2050 — long-run rental-demand tailwind backs the buy-and-hold thesis.
- At projected returns (-3.0% appreciation + 0.9% rent growth), your $17k cash investment doubles in ~3 years — after that, you're playing with house money.
Negotiation context
- It's been on market 42 days — a 3% lower offer ($58k) is reasonable based on typical stale-listing flexibility.
- 3 sale attempts since 2y ago with the ask held roughly flat each time — persistent listings suggest the price (not the market) is what's stuck; bring a comps-based counter.
Risks & watch-outs
- Climate carrying-cost: major flood risk; severe wind risk, 94% chance of damaging wind over 30y; severe wildfire risk; extreme-heat days projected 7→21/yr by 2055 (HVAC capex compounding) — expect insurance premiums to compound above CPI over the hold.
Questions for the listing agent
- It's been on market 42 days. Have you received any prior offers? Is the seller open to a 3% concession, seller financing, or rate buy-down credit?
- What does the HOA fee cover, when was the last increase, and are there any pending special assessments or reserve-fund shortfalls?
- Is there a deadline driving the sale (1031 exchange, divorce, estate, relocation)? That informs how much negotiation room exists.
- Schools are F-rated, which usually means shorter tenancies and higher turnover. Who's the typical renter profile here, and what's been the actual vacancy rate?
- What's the average days-on-market for RENTAL listings here right now (not sales)? A rising rental-DOM trend means longer vacancies and softer asking-rent achievability than the comps imply.
- What's the recent tenant-quality profile in this submarket — average credit score on applications, eviction rate, late-payment / NSF rate, and stable-employment percentage? A property-management company in the area should have these aggregated.
- How much new for-sale + rental construction is in the pipeline within 1–3 miles? Heavy new supply typically softens prices + rents 12–24 months out; constrained supply supports both.
Investment metrics
- 1% rule
- 2.16% ✓
- Cap rate
- 18.19%
- Cash-on-cash
- 42.51%
- DSCR
- 2.89
- GRM
- 3.9
CMA / ARV
- ARV (on-the-fly)
- $96,096
- Comps found
- 2
Show comp detail 2 sales within ~0.75 mi
| Address | Dist | Beds/Ba | Sqft | Sold | Price | $/sf | Match |
|---|---|---|---|---|---|---|---|
| 125 Nap St | 0.05mi | 2/2.5 (-1) | 960 (+4%) | 7mo | $70,000 | $73 | 78 |
| 7225 Monroe St | 0.25mi | 2/2.0 (-1) | 816 (-12%) | 10mo | $84,999 | $104 | 56 |
Match score weights: distance 35% · size 25% · config 20% · recency 20%. Top-matched comps best support the ARV.
Projected returns pro-forma
-3.0% appreciation · 0.93% rent growth · sell at horizon
- IRR
- 36.9%
- Equity multiple
- 2.52×
- Total profit
- $25,564
- Equity at exit
- $8,946
- IRR
- 42.4%
- Equity multiple
- 4.62×
- Total profit
- $60,774
- Equity at exit
- $5,188
Cash invested: $16,800 (down + closing). Projections, not guarantees.
Landlord ↔ Tenant lean methodology
- Overall (STATE)
- 87 Strongly Landlord-Friendly
- State Texas
- 87 Strongly Landlord-Friendly · R+5
- County
- — inherits STATE
- City
- — inherits STATE
ZIP-level market 78572
- Home prices YoY
- -22.9%
- Rents YoY
- 0.9%
- Active inventory
- 852
- Price-to-rent
- 3.9×
Monthly cashflow live
- Estimated rent
- $1,295 high interval (Pro) →
- Mortgage (P&I)
- −$315
- Tax from tax record
- −$63 /mo · $760/yr
- Insurance
- −$25
- HOA
- −$25
- Vacancy / Maint / Mgmt
- −$272
- Net cashflow
- $595
Break-even live
UW: 25.0% down · 7.5% · 30yr · 1.5% tax · 5.0% vac · 8.0% maint · 8.0% mgmt
Financing live
Cash to close
- Down payment
- $15,000
- Closing costs
- $1,800
- Reserves months
- —
- Total cash needed
- —
Loan-product check · same deal, 3 products live
Conventional
25% down · 7.5% · 30yr
- Down + closing
- —
- Monthly P&I
- —
- Monthly cashflow
- —
- DSCR
- —
- Eligible?
- —
Personal DTI + credit; lowest rate.
DSCR
20% down · 8.5% · 30yr
- Down + closing
- —
- Monthly P&I
- —
- Monthly cashflow
- —
- DSCR
- —
- Eligible?
- —
No personal income docs; deal must DSCR.
Hard money
10% down · 12.0% · 12mo
- Down + closing
- —
- Monthly P&I
- —
- Monthly cashflow
- —
- DSCR
- —
- Eligible?
- —
Short-term bridge; refi at stabilization.
Rent comps 9 comps
| Address | Beds | Baths | Sqft | Rent | $/sqft | DOM | Units | Dist |
|---|---|---|---|---|---|---|---|---|
| 1908 Kennedy St Mission, TX | 2.0 | 2.0 | 1062 | $1,300 | $1.22 | 23d | 1 | 0.22mi |
| 7220 W Interstate Highway 2 Fl STW 4 WITH PORCH) FRONT UNIT Mission, TX | 2.0 | 2.0 | 1104 | $1,150 | $1.04 | 43d | 1 | 0.41mi |
| 7220 W Interstate Highway 2 Unit 12 Mission, TX | 2.0 | 2.0 | 1104 | $995 | $0.90 | 21d | 1 | 0.45mi |
| 7220 W Interstate Highway 2 Unit 20 Mission, TX | 2.0 | 2.0 | 1104 | $995 | $0.90 | 43d | 1 | 0.45mi |
| 3717 Clavel St Unit 8 Palmview, TX | 2.0 | 1.0 | 1005 | $800 | $0.80 | 43d | 1 | 0.67mi |
| 3711 Chapa AVE Palmview, TX | 3.0 | 2.0 | 1050 | $1,300 | $1.24 | 43d | 1 | 0.76mi |
| 3711 Chapa AVE Palmview, TX | 2.0 | 2.0 | 995 | $1,150 | $1.16 | 14d | 1 | 0.76mi |
| 3706 Chapa AVE Palmview, TX | 2.0 | 2.0 | 864 | $1,100 | $1.27 | 43d | 1 | 0.77mi |
| 2503 Double Eagle Dr Mission, TX | 2.0 | 2.0 | 840 | $1,300 | $1.55 | 43d | 1 | 0.87mi |
HOA detail
- Monthly dues
- $25 · $300/yr
Listing history 6 events
-
2026-02-24status Pending
-
2026-01-12$60,000 Active
-
2024-12-23historical $650
-
2024-11-13$650
-
2024-11-06historical $650
-
2024-10-25$650
ⓘ Source: listings_history table (triggers on properties + properties_extension) + one-shot
backfill from property_details.listing_events for pre-trigger history.
Tax reassessment forecast TX · Resets to sale price
- Current annual tax
- $760 · $63/mo
- Projected year-2 tax
- $1,098 · $92/mo
- Expected delta
- +$338/yr (+$28/mo · 44.4%)
ⓘ Screening estimate from a state-policy table — verify with the county assessor before closing.
Climate risk First Street
- Flood 6/10 Major FEMA zone X · 70% chance over 30 yrs
- Wildfire 8/10 Severe
- Heat 9/10 Extreme 7 d/yr ≥112°F today · 21 d/yr by 30 yrs out
- Wind 8/10 Severe 94% chance of damaging wind over 30 yrs
- Air quality 1/10 Low 0 unhealthy d/yr today · 0 by 30 yrs out
Nearby sold comps map
Loading sold comps map…
Walkable amenities ~0.75 mi
Loading nearby amenities…
Taxation est. · year 1
- Rental income
- $15,541
- − Mortgage interest
- −$3,361
- − Property taxes
- −$760
- − Insurance
- −$300
- − Repairs & maintenance
- −$1,243
- − Management
- −$1,243
- − HOA
- −$300
- − Depreciation
- −$1,745
- Taxable income
- $6,587
- Est. tax owed @ 24.0%
- −$1,581
- After-tax cash flow
- $5,560/yr
For passive investors: Depreciation is non-cash, so a rental often shows a tax loss while cash-flowing — sheltering income. Rental losses are passive: they offset passive income freely, and up to $25,000/yr can offset ordinary (W-2) income if you actively participate and your MAGI is under $100k (phasing out to $0 by $150k); unused losses carry forward. On sale, claimed depreciation is recaptured at up to 25%, and gains may owe capital-gains tax (a 1031 exchange can defer both). Figures are a year-1 estimate at your 24.0% rate — not tax advice; consult a CPA.
Schools (NCES district)
- District
- La Joya ISD
- NCES district ID
- 4826130
- Math proficiency
- 18% ▼ -35.00%
- Reading proficiency
- 29% ▼ -10.00%
- Median HH income
- $27,845
- Composite
- 18.65/100
- National rank
- #8891
- State rank
- #759 of 826 in TX
Livability — Perezville
- Score
- 64/100
- State rank
- #743
- US rank
- #13748
Category grades
Schools grade is shown separately in the Schools card above.
Census & demographics
- Census place
- Perezville, TX
- County
- Hidalgo County · 623,128 people
- Metro
- McAllen-Edinburg-Mission, TX
- Population (ZIP)
- 78,024
- Household income
- $54,298
- Rent vs Own
- Severe rent burden
- 1714.0
Population outlook (Hidalgo County) Hauer SSP2
- Today (2025)
- 955,232 people
- By 2030
- 1,009,774 · +5.7%
- By 2040
- 1,120,332 · +17.3%
- By 2050
- 1,225,036 · +28.2%
- By 2075
- 1,439,189 · +50.7%
- By 2100
- 1,533,429 · +60.5%
Race, ethnicity, and origin ACS 2023
- Neighborhood character
- Predominantly Hispanic (85%)
- Race & ethnicity
- Hispanic / Latino 85% Two or more races 47% White 12% Asian 2%
- Hispanic origin (detail)
- Mexican 80%
- Common ancestry
- Slovak 1% Portuguese 0%
- Foreign-born
- 28% · Canada, South Korea
- Languages at home
- 22% English-only · Spanish 76%
Political lean MEDSL · Hidalgo
- 2024 margin
- Toss-up / Even · D 48.1% · R 51.0%
- 2008→2024 swing
- -41.6pp toward R · 2008: 38.7pp · 2024: -2.9pp
- All cycles
- 2024: R+2.9 2020: D+17.1 2016: D+40.5 2012: D+41.8 2008: D+38.7
Not yet ingested
- Civics
- —
Market trends
- HPI YoY
- ▼ -62.35%
- Current HPI
- 209.3573
- Rent YoY
- ▲ 0.93%
- Metro
- McAllen-Edinburg-Mission, TX
- State GDP YoY
- ▲ 3.95%
- F500 in state
- 110
Industry mix (Fortune 500 HQ in TX)
| Industry | F500 HQs | Revenue |
|---|---|---|
| Energy | 16 | $1,198B |
|
||
| Technology | 5 | $198B |
|
||
| Engineering / Construction | 4 | $72B |
|
||
| Energy Services | 3 | $60B |
|
||
| Utilities | 3 | $41B |
|
||
| Healthcare | 2 | $330B |
|
||
Price history
6 events — show timeline
- 2026-02-24 Pending — MCALLENMLS
- 2026-01-12 Listed $60,000 MCALLENMLS
- 2024-12-23 Rental Removed $650 RENTSPREE
- 2024-11-13 Listed for Rent $650 RENTSPREE
- 2024-11-06 Rental Removed $650 RENTSPREE
- 2024-10-25 Listed for Rent $650 RENTSPREE
Property tax history
+2.2%/yrLatest (2025): $760 · +15.5% YoY. Source: county tax records.
Cash-flow waterfall
monthlySold comps — $/sqft
last 12 mo · ≤1 miLoading sold comps…